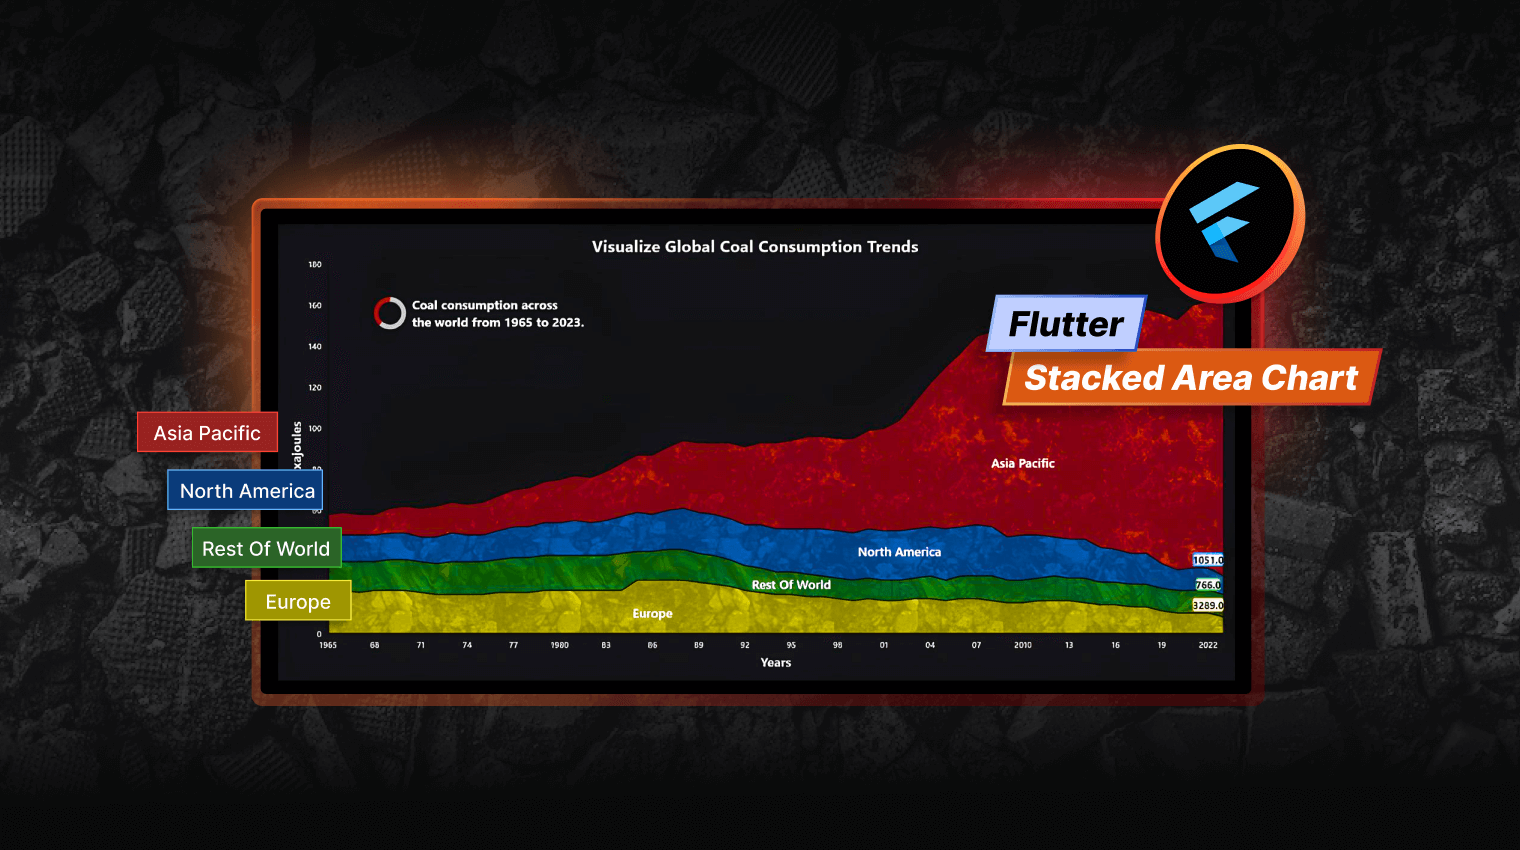
Visualizing Global Coal Consumption Trends with Our Flutter Stacked Area Chart
 syncfusion
TL;DR: Let’s visualize global coal consumption trends using the Flutter Stacked Area Chart. We’ll explore how different regions contribute to total coal use over time. This guide covers data preparation, chart customization, and interactive enhancements like image overlays. Learn to build an insightful visualization using our Flutter Charts!
Welcome to the Chart of the Week blog series!
Charts are a great way to visualize the data, making it easier to understand by presenting it clearly and visually. Among the different types of charts, stacked area charts are especially useful for showing how different parts add up to total overtime. They are great for showing patterns, comparing groups, and tracking combined values, helping you see how individual parts contribute to the whole. This makes stacked area charts a good choice for understanding data from multiple groups, like regions or industries, where both individual and overall trends matter.
This blog is about showing global coal consumption trends using the Syncfusion Flutter Stacked Area Chart. We’ll see how to create an interactive chart that shows coal use in different regions over time. From preparing the data to customizing the chart, this guide gives simple steps to build a clear and effective visualization. You will learn how regions like Asia, Europe, and America have contributed to global coal consumption, making exploring and understanding the data easy.
Stacked Area Chart
The StackedAreaSeries is a part of the SfCartesianChart widget, designed to visualize how multiple data series combine to form a cumulative total overtime or a specific category. Each series is represented as a filled area, stacked one on top of the other.
The Stacked Area Chart allows us to plot multiple data series on top of each other, effectively showing how individual components contribute to a cumulative total. Each area’s height represents its value relative to the entire chart, making it easy to compare different series contributions at any time. The series also supports customizing its elements like colors, gradients, and borders, allowing you to customize the visual appearance based on your needs. The interactive elements, such as tooltips and trackballs, enhance the user’s ability to explore the data dynamically.
Key reasons to use a Stacked Area Chart
Visualizing trends over time: Helps track how different categories contribute to the overall trend over a period.
Effective for part-to-whole relationships: Illustrates how individual components stack up to form a cumulative value.
**Comparing proportions: ** Shows the relative contribution of each category to a total while maintaining the visibility of the whole dataset.
Better for large data sets: When multiple categories need to be analyzed together rather than separately.
Easy identification of growth patterns: Highlights increasing or decreasing trends across multiple categories.
Use cases of Stacked Area Charts
Financial analysis: Tracking revenue, expenses, and profit contributions over time.
Website analytics: Monitoring traffic sources (organic, direct, paid, referral) over time.
Market share analysis: Comparing different company shares within the industry.
Energy consumption: Displaying electricity consumption from different sources (solar, wind, fossil fuels).
Demographic analysis: Visualizing population distribution by age groups across years.
Sales performance: Showing product category-wise contribution to total sales.
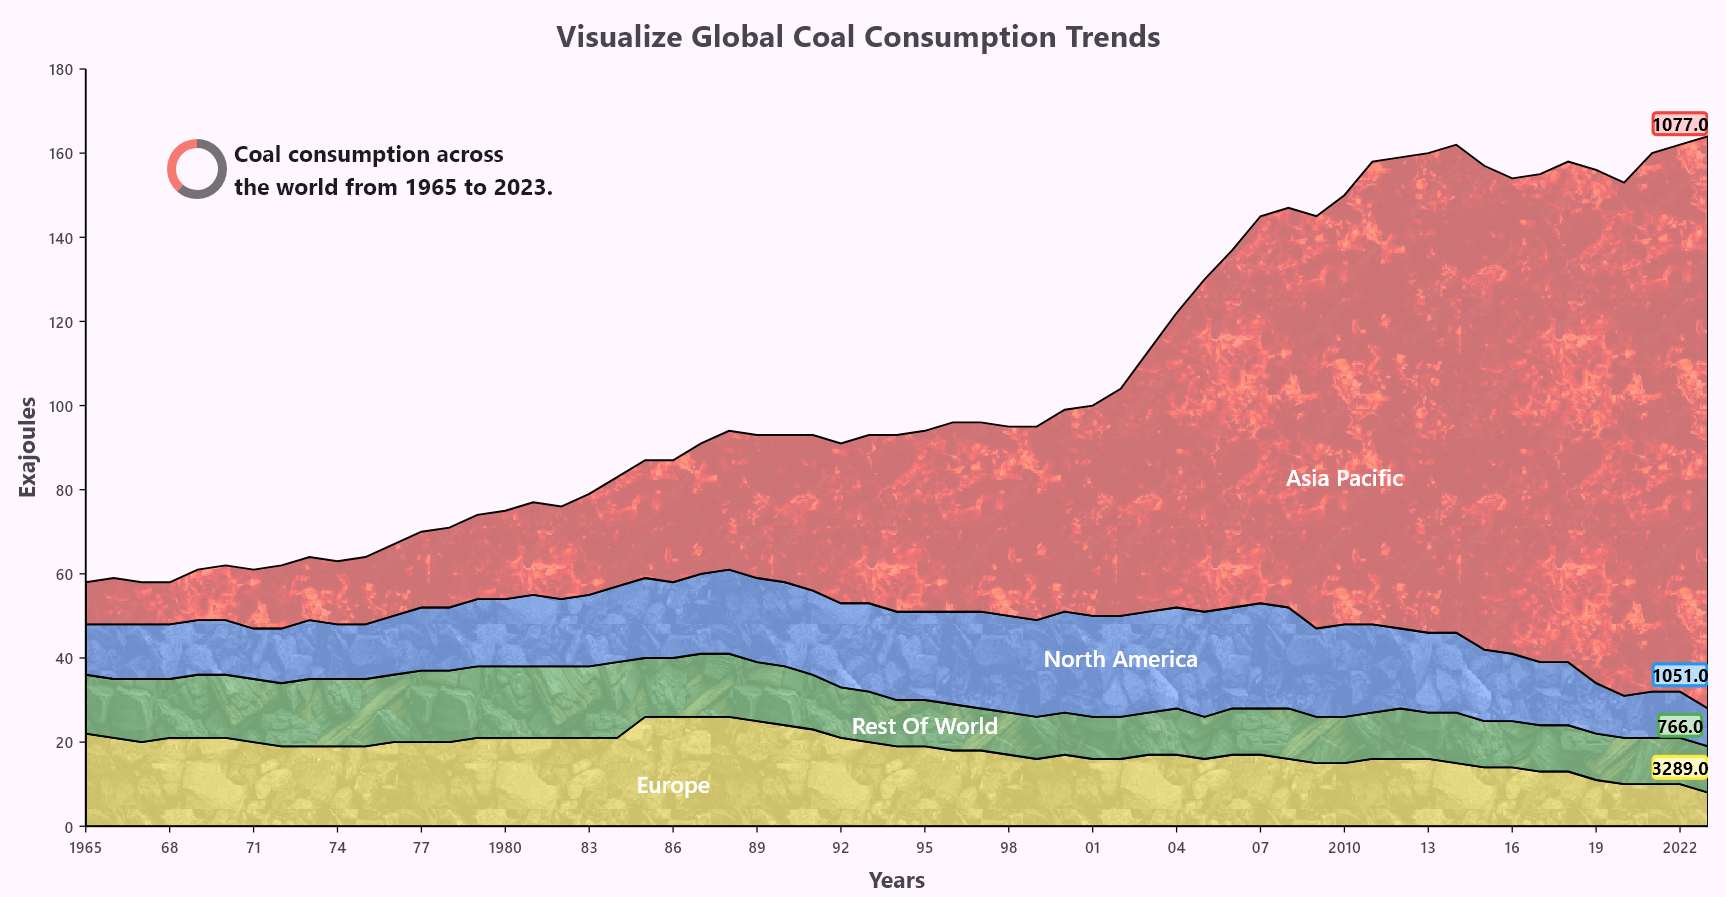
Let’s use the Flutter Stacked Area Chart to visualize the data on coal consumption worldwide! We’ll add an image with overlay colors and annotations, as shown in the following image.

Enhancing StackedAreaSeries with image overlays
The StackedAreaSeries effectively visualizes coal consumption trends over time, illustrating how different regions contribute to total usage. Layering the data highlights each region’s share while emphasizing overall growth. To enhance visual appeal, images are overlaid on each series using the onCreateRenderer property in the SfCartesianChart widget, ensuring a clear and engaging chart by extending the StackedAreaSeriesRenderer.
Images are applied as texture fills using image shaders in the onPaint method of the StackedAreaSegment. Additionally, an overlay color blends the images smoothly with the background, creating a visually distinct representation of global coal consumption.
onCreateRenderer: Defines a renderer for the series.
StackedAreaSeriesRenderer: Creates the renderer for StackedAreaSeries.
StackedAreaSegment: Handles the painting of each segment, allowing image shaders and textures.
Additionally, annotations help us to add additional details or visuals to charts, making them more informative and visually appealing. In SfCartesianChart, you can use the annotations property to place text, images, or shapes at specific positions on the chart. This is useful for highlighting key data points, adding labels, or providing additional context to the chart’s information.
Visualizing coal consumption data using Flutter Stacked Area Chart
Follow these steps to visualize the global coal consumption trends using the Flutter Stacked Area Chart!
Step 1: Gathering the data
Let’s collect data on global coal consumption (measured in Exajoules) from the Energy Institute. This dataset includes coal consumption trends across key regions, such as Europe, North America, Asia-Pacific, and the rest of the world, from 1965 to 2023.
Step 2: Define and populate data to the chart
Now, define the data representing coal consumption trends across different regions over the years. This data will be used to plot the chart and visualize trends effectively.
Refer to the following code example.
class CoalConsumptionData {
  final String year;
  final double europe;
  final double restOfWorld;
  final double northAmerica;
  final double asiaPacific;

  CoalConsumptionData(
    this.year,
    this.europe,
    this.restOfWorld,
    this.northAmerica,
    this.asiaPacific
  );
}
To represent global coal consumption trends in Exajoules from 1965 to 2023, we will create a list named coalConsumptionData. This list will be used as the data source for the Stacked Area Chart, providing a clear visualization of the trends over the years.
Refer to the following code example.
late List<CoalConsumptionData> coalConsumptionData;

@override
void initState() {
  coalConsumptionData = [
    CoalConsumptionData('1965', 10, 14, 12, 22),
    CoalConsumptionData('1966', 11, 14, 13, 21),
    CoalConsumptionData('1967', 10, 15, 13, 20),
    CoalConsumptionData('1968', 10, 14, 13, 21),
    CoalConsumptionData('1969', 12, 15, 13, 21),
    CoalConsumptionData('1970', 13, 15, 13, 21),
    CoalConsumptionData('1971', 14, 15, 12, 20),
    // More data...
  ];
  super.initState();
}
Step 3: Configuring the Flutter Stacked Area Chart
The SfCartesianChart is configured with a CategoryAxis as the primaryXAxis and a NumericAxis as the primaryYAxis to display coal consumption data over time. The X-axis represents years, while the Y-axis measures coal consumption in exajoules.
Multiple StackedAreaSeries are used to visualize data for different regions, including Asia-Pacific, the rest of the world, North America, and Europe. This setup clearly represents coal consumption trends across different regions over the years.
Refer to the following code example.
SfCartesianChart(
  primaryXAxis: _createCategoryAxis(),
  primaryYAxis: _createNumericAxis(),
  series: _buildStackedAreaSeries(),
);

List<StackedAreaSeries<CoalConsumptionData, String>> _buildStackedAreaSeries() {
  final List<double Function(CoalConsumptionData, dynamic)> regionDataMappers = [
    (CoalConsumptionData data, int index) => data.asiaPacific,
    (CoalConsumptionData data, int index) => data.restOfWorld,
    (CoalConsumptionData data, int index) => data.northAmerica,
    (CoalConsumptionData data, int index) => data.europe,
  ];

  return List.generate(4, (index) {
    return StackedAreaSeries<CoalConsumptionData, String>(
      dataSource: coalConsumptionData,
      xValueMapper: (CoalConsumptionData data, int index) => data.year,
      yValueMapper: regionDataMappers[index],
      .....
    );
  });
}
Step 4: Configure axes and disable gridline appearance
The CategoryAxis (X-axis) represents years with an interval of 3, ensuring labels appear every third year for better readability. It is titled Years, and labels are aligned with axis ticks using the labelPlacement property set to onTicks. Gridlines are disabled using the majorGridLines by setting the width to 0, reducing visual clutter.
The Y-axis labelPlacement property represents coal consumption in Exajoules with an interval of 20, providing evenly spaced tick marks. It is titled Exajoules for clarity. Like the X-axis, major gridlines on the Y-axis are also disabled by setting the majorGridLines property as 0, creating a clean and uncluttered chart layout.
The axisLabelFormatter function is used to customize the chart axis labels dynamically. It displays the years that are divisible by 10 (e.g., 1970, 1980) and shortens others to their last two digits (e.g., ’75’ for 1975), except for the first (1965) and last (2022) years.
Refer to the following code example.
SfCartesianChart(
  primaryXAxis: _createCategoryAxis(),
  primaryYAxis: _createNumericAxis(),
  .....
);

CategoryAxis _createCategoryAxis() {
  return CategoryAxis(
    interval: 3,
    title: const AxisTitle(
      text: 'Years',
      textStyle: TextStyle(fontSize: 18, fontWeight: FontWeight.bold),
    ),
    labelPlacement: LabelPlacement.onTicks,
    majorGridLines: const MajorGridLines(width: 0),
    axisLabelFormatter: (AxisLabelRenderDetails details) {
      // Extract year and format
      final yearIndex = details.value.toInt(); // Get the index
      final coalData = coalConsumptionData;
      final year = coalData[yearIndex].year; // Map the index to the year

      // Year is divisible by 10
      final isDivisibleBy10 =
          int.tryParse(year) != null && int.parse(year) % 10 == 0;

      return ChartAxisLabel(
        isDivisibleBy10
            ? year
            : ((year == '1965' || year == '2022')
                ? year
                : year.substring(year.length - 2)),
        details.textStyle,
      );
    },
  );
}

NumericAxis _createNumericAxis() {
  return NumericAxis(
    interval: 20,
    majorGridLines: const MajorGridLines(width: 0),
    title: const AxisTitle(
      text: 'Exajoules',
      textStyle: TextStyle(fontSize: 18, fontWeight: FontWeight.bold),
    ),
  );
}
Step 5: Create and configure the Stacked Area series renderer
The onCreateRenderer property in the SfCartesianChart widget allows us to define a unique renderer for a series. This means that instead of using the default rendering behavior, we can modify how the StackedAreaSeries should be drawn by implementing a specialized renderer.
How does it work?
We define an extend renderer class ( StackedAreaRendererExtension ) that extends the default StackedAreaSeriesRenderer.
The renderer creates an extended segment ( StackedAreaSegmentExtension ), which modifies how the series is painted.
The onCreateRenderer property is used in the StackedAreaSeries to replace the default renderer with our modified renderer.
Refer to the following code example.
SfCartesianChart(
  .....
  series: StackedAreaSeries<CoalConsumptionData, String>(
    .....
    onCreateRenderer: (ChartSeries<dynamic, dynamic> series) =>
        StackedAreaRendererExtension(seriesStackedAreaSeries<CoalConsumptionData, String>),
  ),
);
Define StackedAreaRendererExtension
The StackedAreaRendererExtension class extends StackedAreaSeriesRenderer. It keeps track of the seriesIndex to know which series it belongs to and makes sure multiple series stack correctly.
Now, the StackedAreaRendererExtension class overrides the createSegment() method to return a StackedAreaSegmentExtension. Then, the StackedAreaSegmentExtension handles the actual drawing, including adding textures and overlay colors and ensuring the segments are stacked in the right order for a clear and visually appealing look. The bottomBoundary property stores the bottom boundary of the previous segment.
Refer to the following code example.
class StackedAreaRendererExtension<T, D> extends StackedAreaSeriesRenderer<T, D> {
  static final Map<int, List<Offset>> bottomBoundary = {};

  StackedAreaRendererExtension(StackedAreaSeries<T, D> series) : super();

  @override
  StackedAreaSegment<T, D> createSegment() {
    return StackedAreaSegmentExtension<T, D>();
  }
}
Enhancing the Stacked Area segment
In our demo, the StackedAreaSegmentExtension class extends StackedAreaSegment. The StackedAreaSegmentExtension class is used to customize how each segment in a stacked area chart should be drawn by adding background images and overlay colors. It assigns a unique image and color to each segment based on the seriesIndex. To optimize the performance, the _loadImageForSeries() method is used to load images from assets and store them in the _loadedImages property, preventing redundant loading. This ensures each segment has a distinct visual style without affecting performance.
The onPaint method handles the drawing process by first generating the segment shape with the _generateSegmentPath() method, and then applying an image background using the ImageShader. A semi-transparent overlay color is added for better visibility, and a black border is drawn for clear separation.
The _buildBottomBoundaryPoints() method saves the bottom boundary points, ensuring the correct stacking of segments. This approach enhances the chart’s clarity and visual appeal, making data representation more engaging.
Refer to the following code example.
class StackedAreaSegmentExtension<T, D> extends StackedAreaSegment<T, D> {
  ui.Image? backgroundImage;
  static final Map<int, ui.Image> _loadedImages = {};
  ….
  Future<void> _loadImageForSeries() async {
    if (_loadedImages.containsKey(series.index)) {
      backgroundImage = _loadedImages[series.index];
    } else {
      try {
        final ByteData data = await rootBundle.load(images[series.index]);
        final codec = await ui.instantiateImageCodec(data.buffer.asUint8List());
        final frame = await codec.getNextFrame();
        backgroundImage = frame.image;
        _loadedImages[series.index] = backgroundImage!;
      } catch (e) {
        debugPrint("Image loading error: $e");
      }
    }
  }

  @override
  void onPaint(Canvas canvas) {
    if (points.isEmpty) return;

    // Ensure the image is loaded before painting
    if (backgroundImage == null) {
      _loadImageForSeries();
      return;
    }

    Path segmentPath = _generateSegmentPath(canvas);
    _buildBottomBoundaryPoints();

    // Paint for the image background
    Paint fillPaint = Paint()
      ..color = Colors.black.withValues(alpha: 0.4)
      ..blendMode = BlendMode.darken
      ..shader = ImageShader(
        backgroundImage!,
        TileMode.repeated,
        TileMode.repeated,
        Matrix4.identity().storage,
      );

    canvas.drawPath(segmentPath, fillPaint);
  }

  Path _generateSegmentPath(Canvas canvas) {
    Path path = Path()..moveTo(points.first.dx, points.first.dy);
    for (int i = 1; i < points.length; i++) {
      path.lineTo(points[i].dx, points[i].dy);
    }

    List<Offset> bottomPoints = StackedAreaRendererExtension.bottomBoundary[series.index - 1] ?? [];
    if (series.index == 0 || bottomPoints.isEmpty) {
      double chartBottomY = canvas.getLocalClipBounds().bottom;
      for (int i = points.length - 1; i >= 0; i--) {
        path.lineTo(points[i].dx, chartBottomY);
      }
    } else {
      for (int i = points.length - 1; i >= 0; i--) {
        path.lineTo(bottomPoints[i].dx, bottomPoints[i].dy);
      }
    }
    return path..close();
  }

  void _buildBottomBoundaryPoints() {
    StackedAreaRendererExtension.bottomBoundary[series.index] = List.from(points);
  }
}
Additionally, the required coal images should be added to the assets in your pubspec.yaml file to ensure proper loading and display of each image in the chart. This approach makes the chart visually appealing.
Refer to the following example code.
flutter:
  assets:
    - assets/coal1.jpg
    - assets/coal2.jpg
    - assets/coal3.jpg
Step 6: Adding annotations to the chart
Annotations allow additional information or visual elements to be placed on the chart using the annotations property, which accepts a list of CartesianChartAnnotation objects. The CartesianChartAnnotation method takes a widget, an x value, and a y value to position the annotation at specific coordinates by setting coordinateUnit to point.
Additionally, the SfCircularChart widget with a DoughnutSeries is used as an annotation to provide a visual representation of data within the Cartesian Chart. These annotations are strategically placed using x and y values, ensuring a clear and structured way to visualize coal consumption data.
Refer to the following code example.
SfCartesianChart(
  .....
  annotations: _createAnnotations(),
);

// Helper function to create CartesianChartAnnotation
CartesianChartAnnotation _createAnnotation(Widget widget, String x, double y) {
  return CartesianChartAnnotation(
    widget: widget,
    x: x,
    y: y,
    coordinateUnit: CoordinateUnit.point,
  );
}

// Helper function to create a DecoratedBox with text
Widget createDecoratedBox(String text, Color borderColor, Color color) {
  return Center(
    child: DecoratedBox(
      .....
    ),
  );
}

// Function to create a list of annotations
List<CartesianChartAnnotation> _createAnnotations() {
  TextStyle textStyle = TextStyle(fontSize: 18, color: Colors.white);
  return<CartesianChartAnnotation>[
    _createAnnotation(
      SfCircularChart(
        series:<CircularSeries>[
          DoughnutSeries<ChartData, String>(
            dataSource: [
              ChartData('Example', 40, Colors.black54),
              ChartData('Example', 25, Colors.red.withOpacity(0.7)),
            ],
            xValueMapper: (ChartData data, int index) => data.x,
            yValueMapper: (ChartData data, int index) => data.y,
            pointColorMapper: (ChartData data, int index) => data.color,
          ),
        ],
      ),
      '1969',
      156,
    ),
    _createAnnotation(
      Text(
        "Coal consumption across \nthe world from 1965 to 2023.",
        style: TextStyle(fontSize: 18, fontWeight: FontWeight.bold),
      ),
      '1976',
      156,
    ),
    // Data label annotations on series.
    _createAnnotation(Text("Europe", style: textStyle), '1986', 10),
    _createAnnotation(Text("Rest Of World", style: textStyle), '1995', 24),
    _createAnnotation(Text("North America", style: textStyle), '2002', 40),
    _createAnnotation(Text("Asia Pacific", style: textStyle), '2010', 83),

    // Data label annotations at the edge of the series.
    _createAnnotation(
      createDecoratedBox('$asiaPacific', Colors.red, Colors.red.shade100),
      '2022',
      167,
    ),
    _createAnnotation(
      createDecoratedBox('$northAmerica', Colors.blue, Colors.blue.shade100),
      '2022',
      36,
    ),
    _createAnnotation(
      createDecoratedBox('$restOfWorld', Colors.green, Colors.green.shade100),
      '2022',
      24,
    ),
    _createAnnotation(
      createDecoratedBox('$europe', Colors.yellow, Colors.yellow.shade100),
      '2022',
      14,
    ),
  ];
}
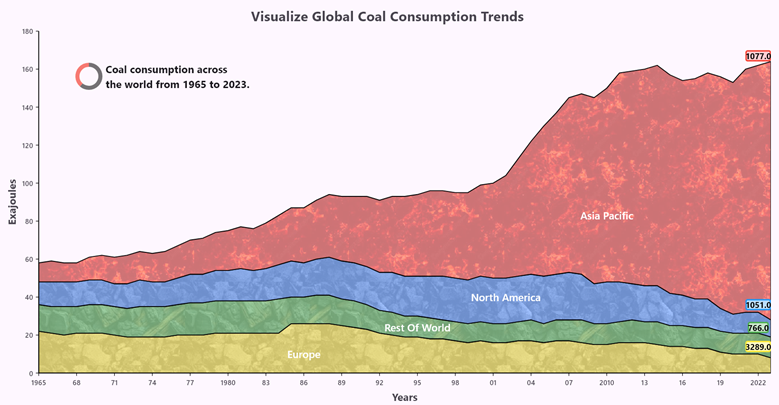
Refer to the following image.

Visualizing the coal consumption in various regions using Flutter Stacked Area Chart
GitHub reference
For more details, refer to the visualizing global coal consumption trends using the Flutter Stacked Area Chart.
Conclusion
Thank you for reading! This blog explains how to visualize the global coal consumption trend using the Syncfusion Flutter Stacked Area Chart. We hope these steps help you easily create a similar visualization and enhance your data representation.
The existing customers can download the new version of Essential Studio® on the License and Downloads page. If you are not a Syncfusion customer, try our 30-day free trial to check out our incredible features.
For questions, you can contact us through our support forums, support portal, or feedback portal. We are always happy to assist you!
Related Blogs
Subscribe to my newsletter
Read articles from syncfusion directly inside your inbox. Subscribe to the newsletter, and don't miss out.
Written by

syncfusion
syncfusion
Syncfusion provides third-party UI components for React, Vue, Angular, JavaScript, Blazor, .NET MAUI, ASP.NET MVC, Core, WinForms, WPF, UWP and Xamarin.