A Complete Guide to Monitoring Kubernetes Clusters using Prometheus and Grafana
 Nikitha Jain
Kubernetes (K8s) is a powerful container orchestration platform, but managing and monitoring it effectively requires robust observability tools. The above diagram illustrates how Prometheus, Grafana, and Helm work together to monitor a Kubernetes cluster. This blog will break down the components and how they interact in this monitoring ecosystem.
Understanding the Kubernetes Architecture

The diagram represents a typical Kubernetes setup, which consists of:
Master Node (Control Plane): This includes the API server, scheduler, controller manager, and etcd database. It orchestrates the cluster, managing deployments and workloads.
Worker Nodes: These nodes run the actual workloads, with each containing a Kubelet that interacts with the control plane.
Metrics Exporter: Kubernetes exposes metrics via node exporters running on each worker node (port 9100) for Prometheus to collect.
Monitoring Stack Overview
To enable effective observability, the architecture integrates Prometheus, Grafana, and Helm.
1. Prometheus - The Time-Series Database
Prometheus is at the heart of this monitoring setup, performing the following tasks:
Scrapes Metrics: It collects metrics from Kubernetes nodes and components.
Stores Time-Series Data: The collected data is stored in a time-series database.
Querying via PromQL: It provides a powerful query language to filter and analyze metrics.
Visualization: Basic graphs can be generated, though Grafana is preferred for advanced visualization.
2. Grafana - The Visualization Tool
Prometheus metrics alone are not user-friendly. Grafana is integrated to provide a dashboard and visualization for:
Visualizing Cluster Metrics: Displays CPU, memory usage, pod health, etc.
Data Source Integration: Grafana connects to Prometheus as a data source, transforming raw metrics into insights.
3. Helm - Kubernetes Package Manager
Helm simplifies deploying monitoring tools like Prometheus and Grafana. It provides:
Pre-configured Charts: Ready-to-use configurations for installing Prometheus and Grafana in Kubernetes.
Easier Management: Simplifies upgrades, rollbacks, and scaling of monitoring components.
How It All Works Together
Kubernetes components (kubelet, kube-state-metrics) expose metrics.
Prometheus scrapes metrics from Kubernetes nodes via exporters.
The collected metrics are stored in Prometheus’s time-series database.
Grafana queries Prometheus and visualizes the data in dashboards.
Helm manages the deployment of Prometheus and Grafana.
Installing Helm:
Using below commands you can install helm and Verify helm version
$ curl -fsSL -o get_helm.sh https://raw.githubusercontent.com/helm/helm/main/scripts/get-helm-3
$ chmod 700 get_helm.sh
$ ./get_helm.sh
$ helm version
Installation using Helm
To install Prometheus and Grafana using Helm, follow these steps:
Add the Helm repository for Prometheus and Grafana:
 helm repo add prometheus-community https://prometheus-community.github.io/helm-charts
 helm repo list
 helm repo update
Create a namespace for monitoring (optional but recommended):
kubectl create namespace monitoring
Install Prometheus and Grafana using Helm:
helm install prometheus-stack prometheus-community/kube-prometheus-stack --namespace monitoring --set prometheus.service.nodePort=30000 --set prometheus.service.type=NodePort --set grafana.service.nodePort=31000 --set grafana.service.type=NodePort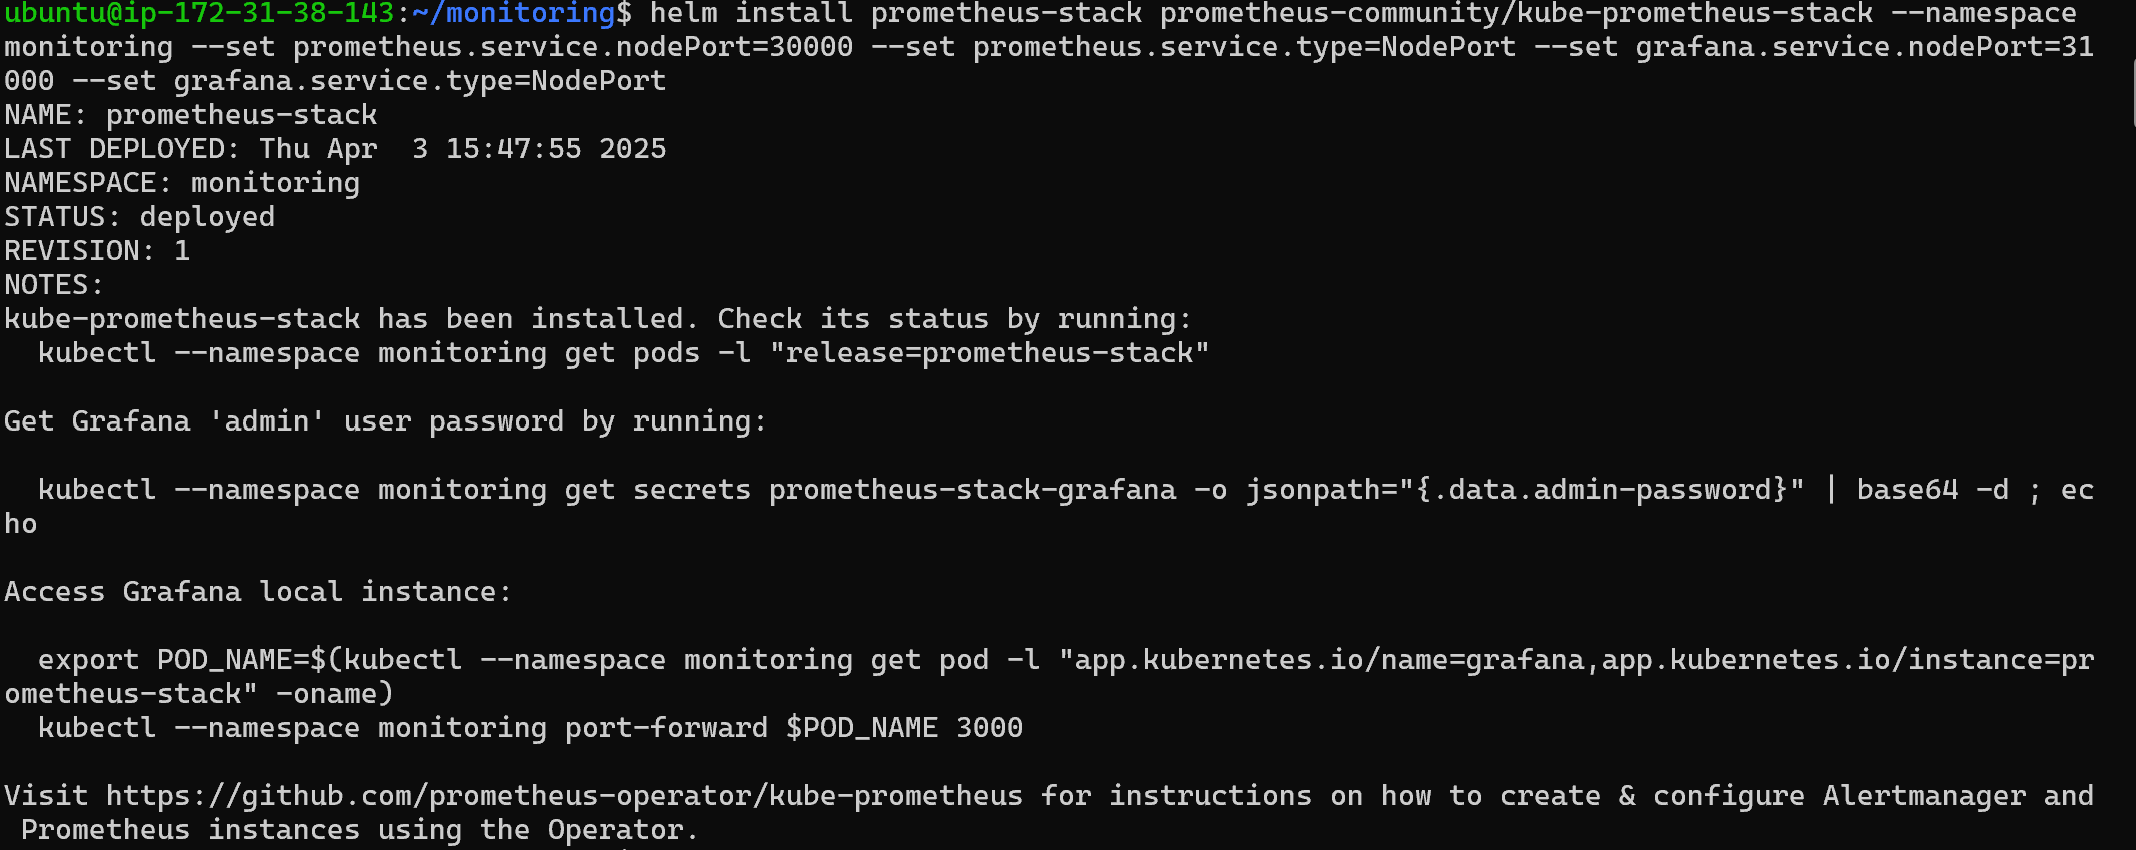
Verify the installation:
kubectl get pods -n monitoring
Verify the services in the monitoring namespace:
kubectl get svc -n monitoring
Access the Prometheus UI:
kubectl port-forward svc/prometheus-stack-kube-prom-prometheus 9090:9090 -n monitoring --address=0.0.0.0Then open
http://localhost:9090in a browser.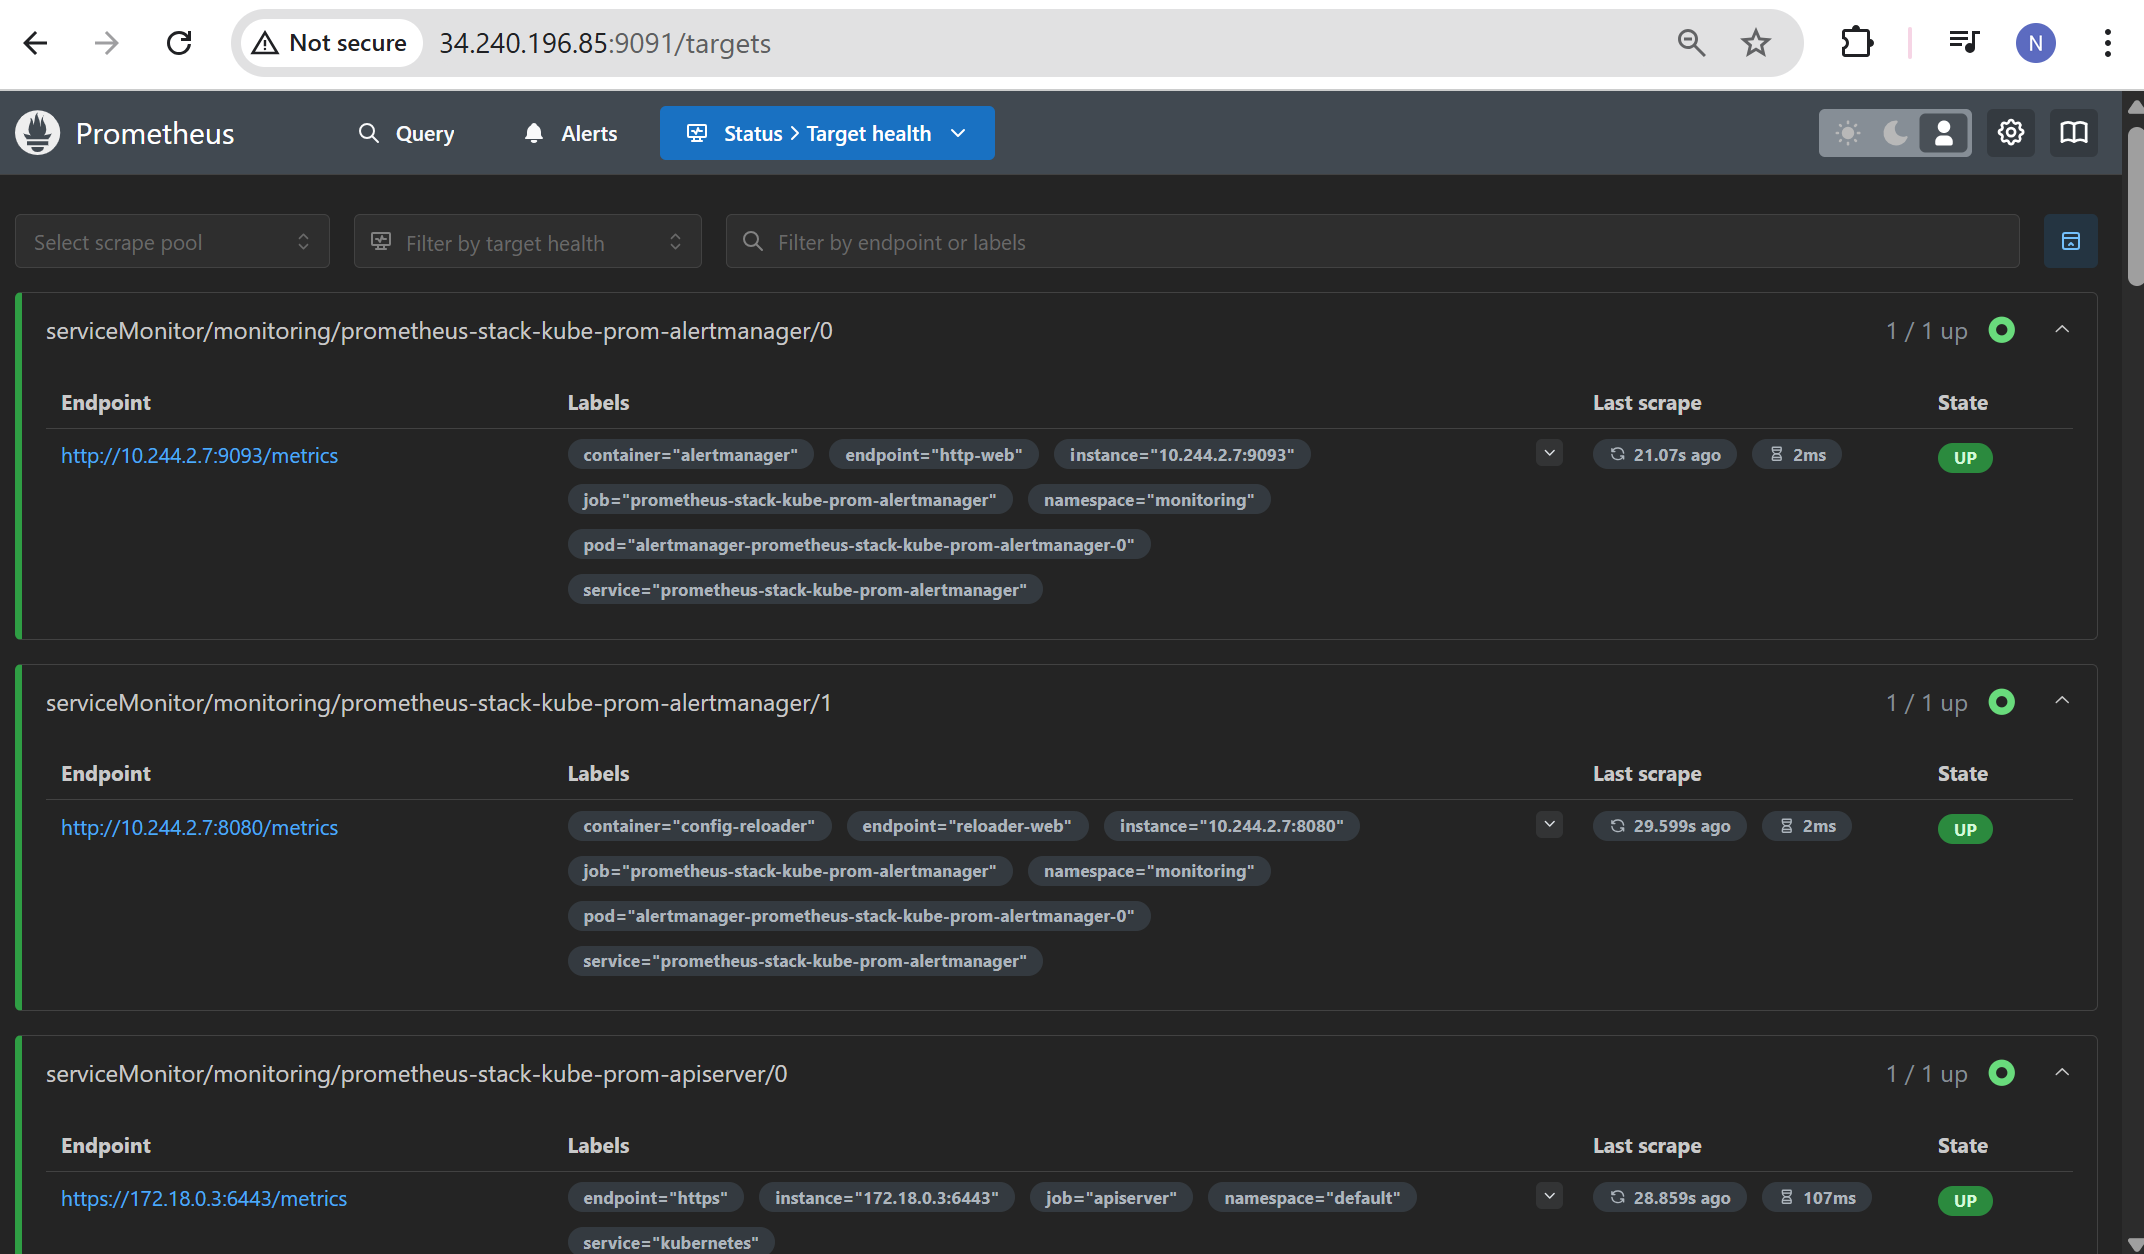
Access the Grafana UI:
kubectl port-forward svc/prometheus-stack-grafana 3000:80 -n monitoring --address=0.0.0.0 &Then open
http://localhost:3000in a browser.Default login credentials:
kubectl get secret prometheus-stack-grafana -n monitoring -o jsonpath="{.data.admin-password}" | base64 --decodeUsername:
adminPassword:
prom-operator
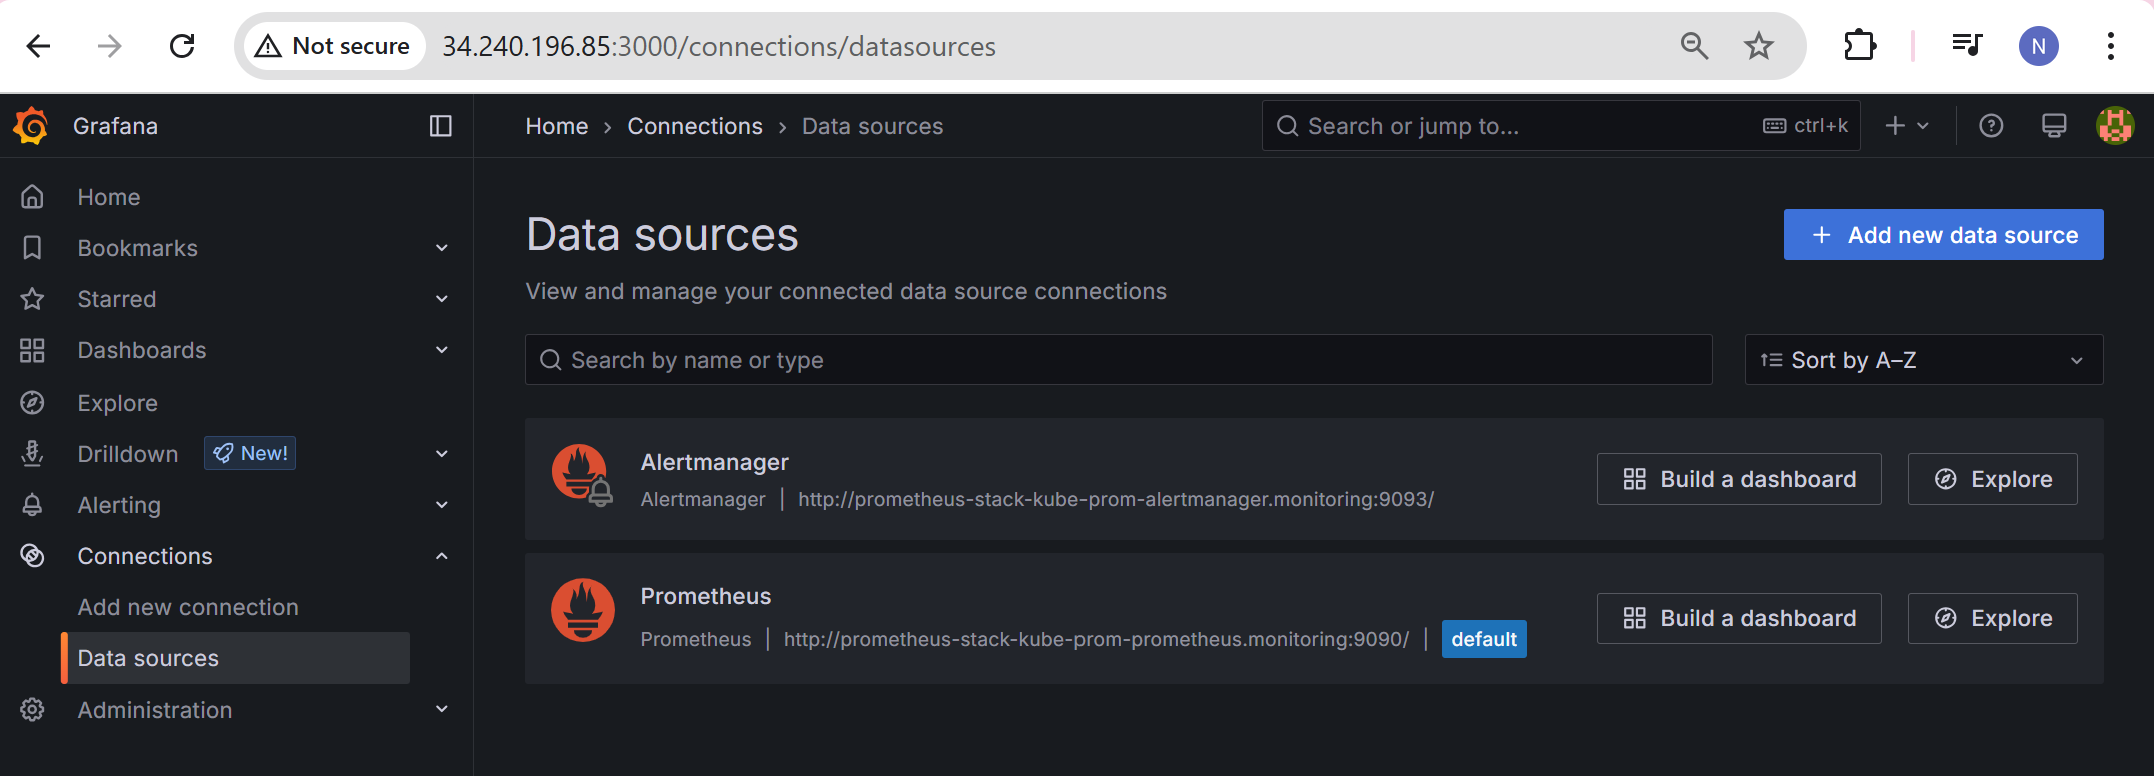
Grafana is accessible now and we go to data sources.
Prometheus is added as we have installed it using Helm.
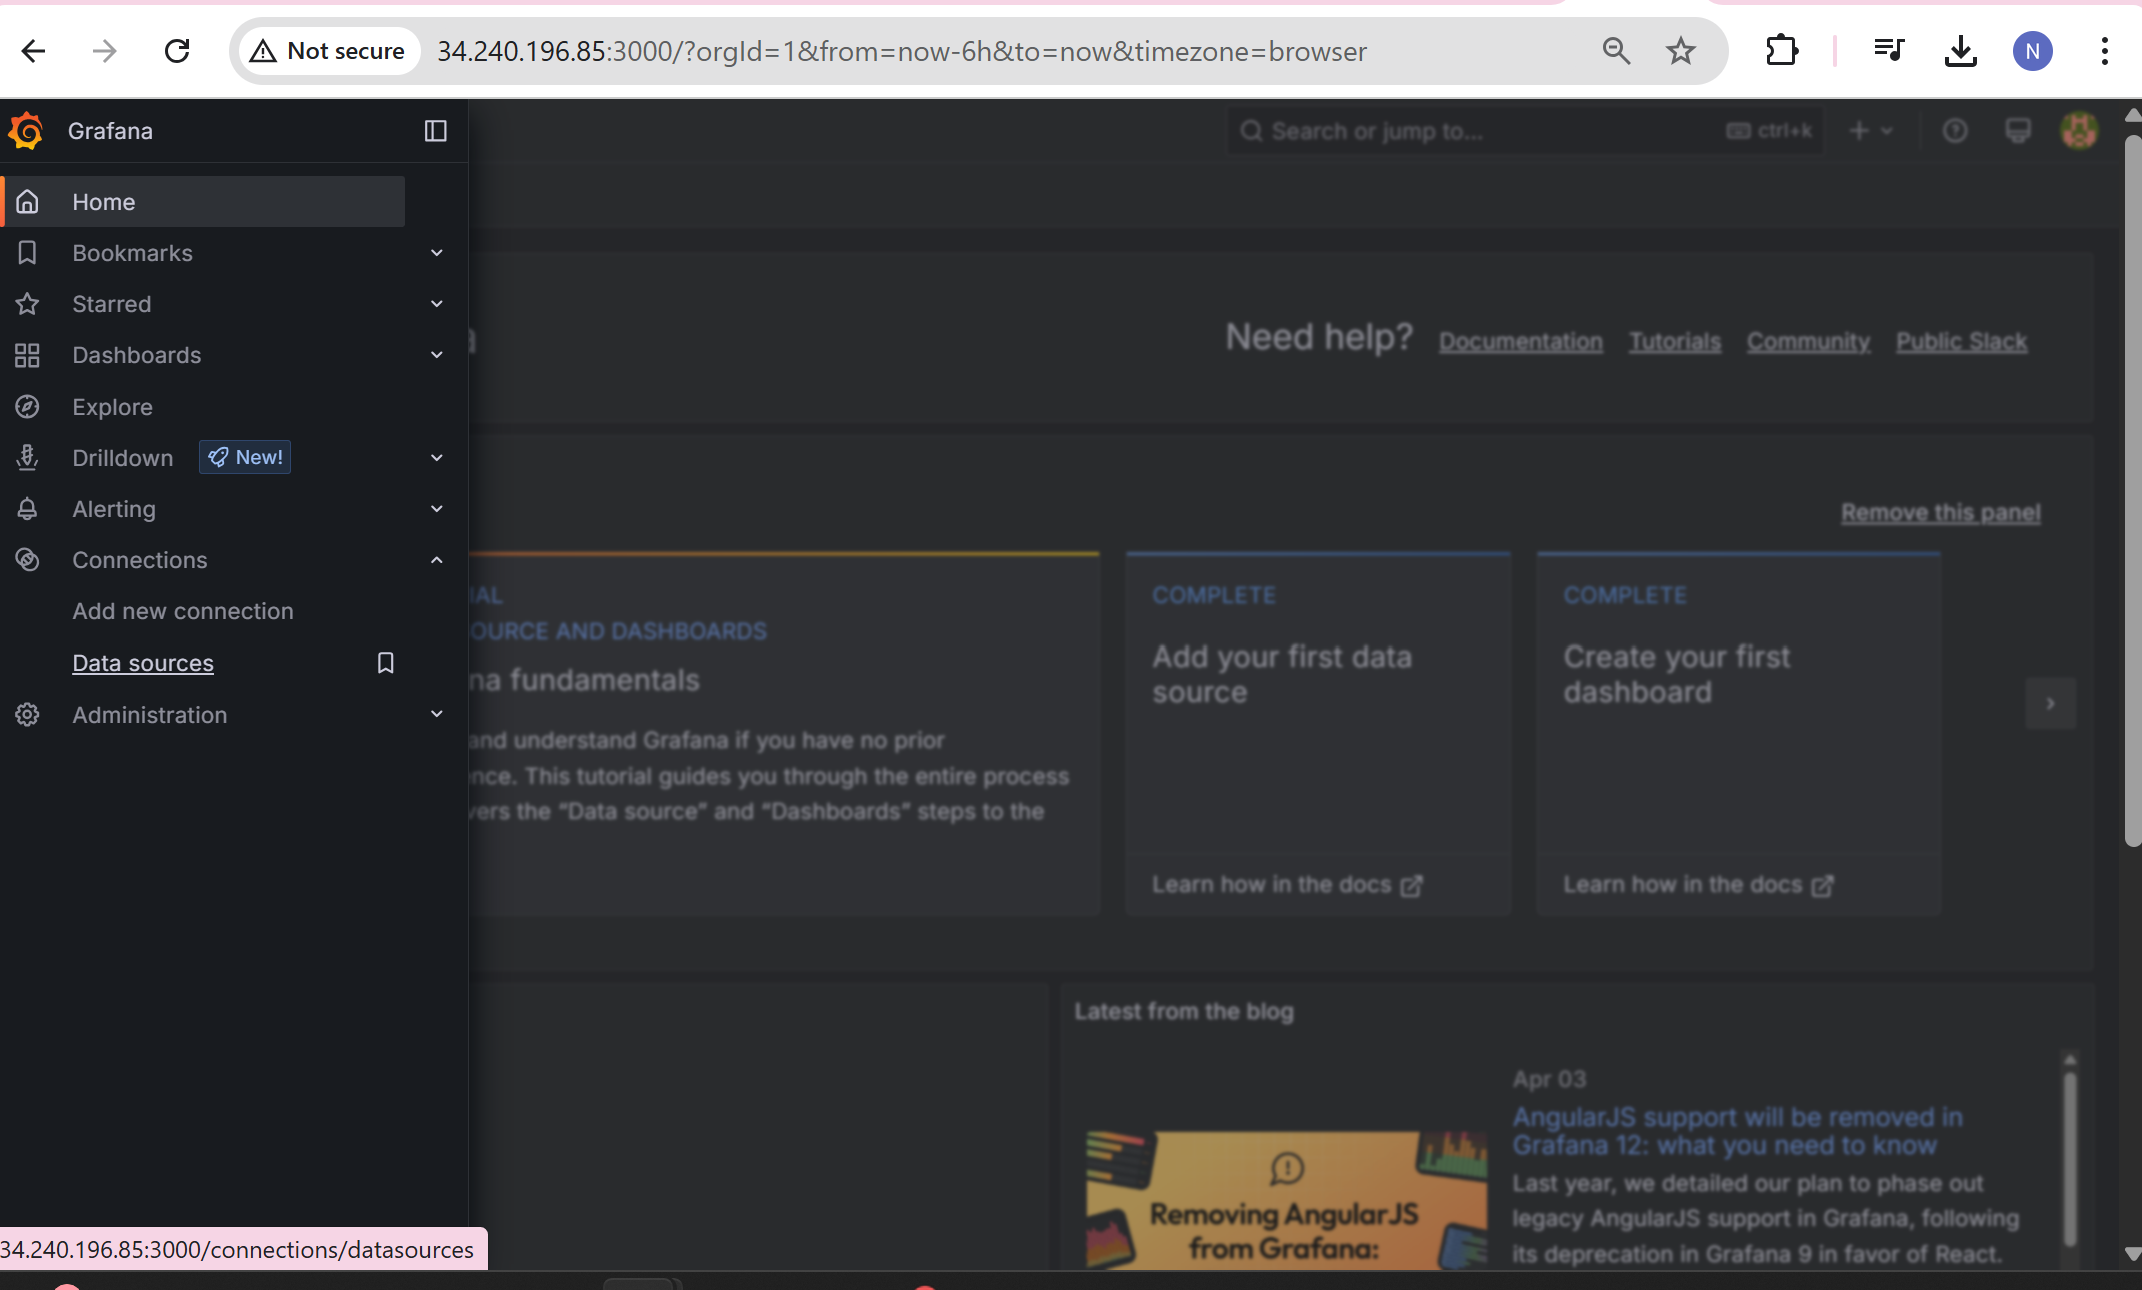
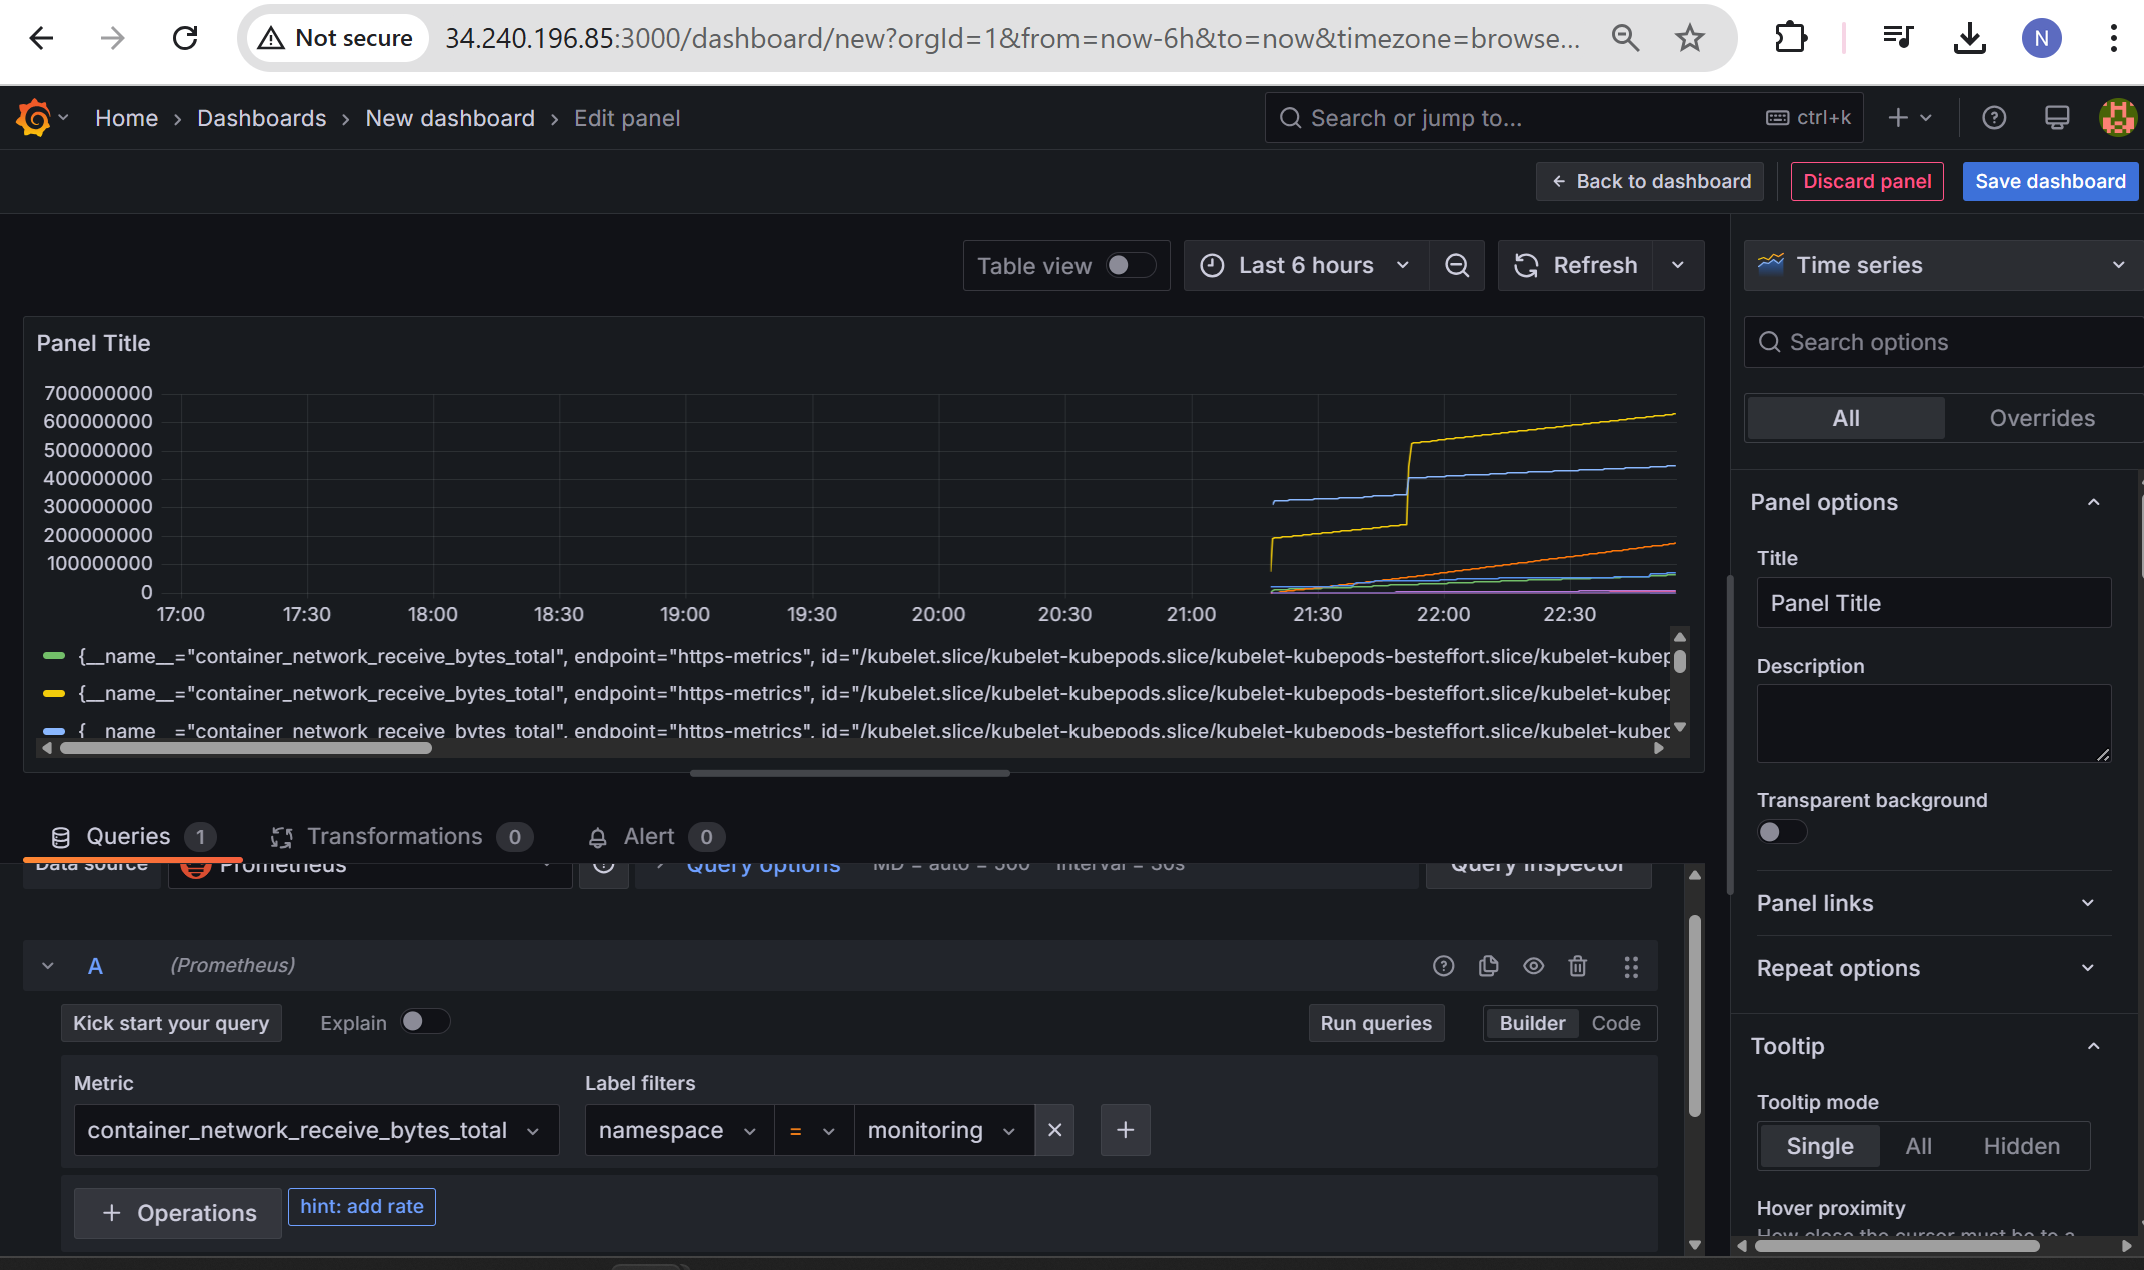
Go to build a dashboard, then add Prometheus data source then you can use below query and run it to get this visualization.
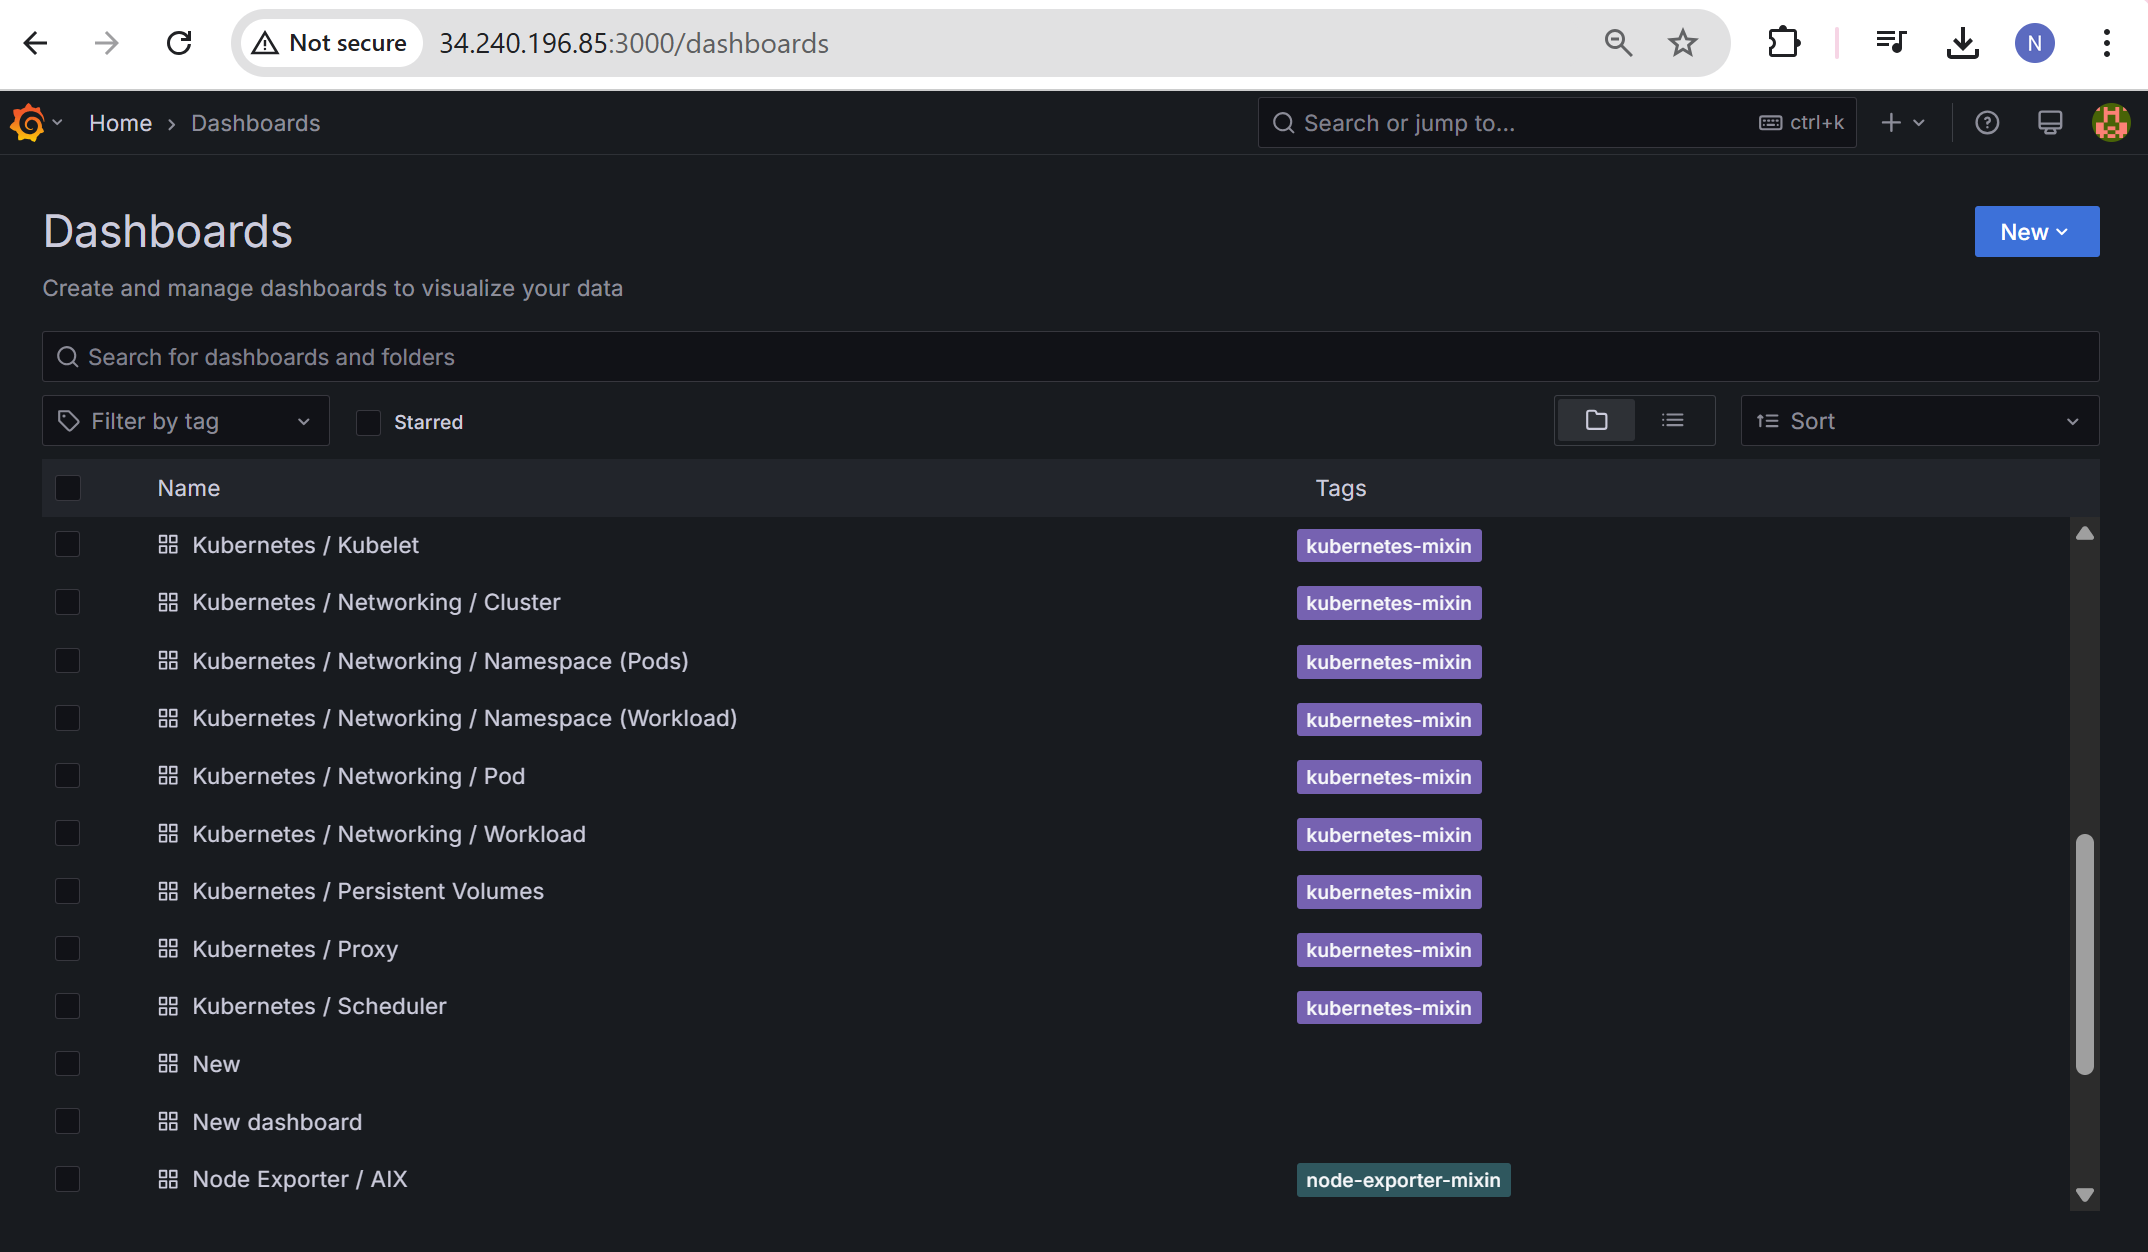
Now go to Dashboard, we already have dashboards related to k8s as below,
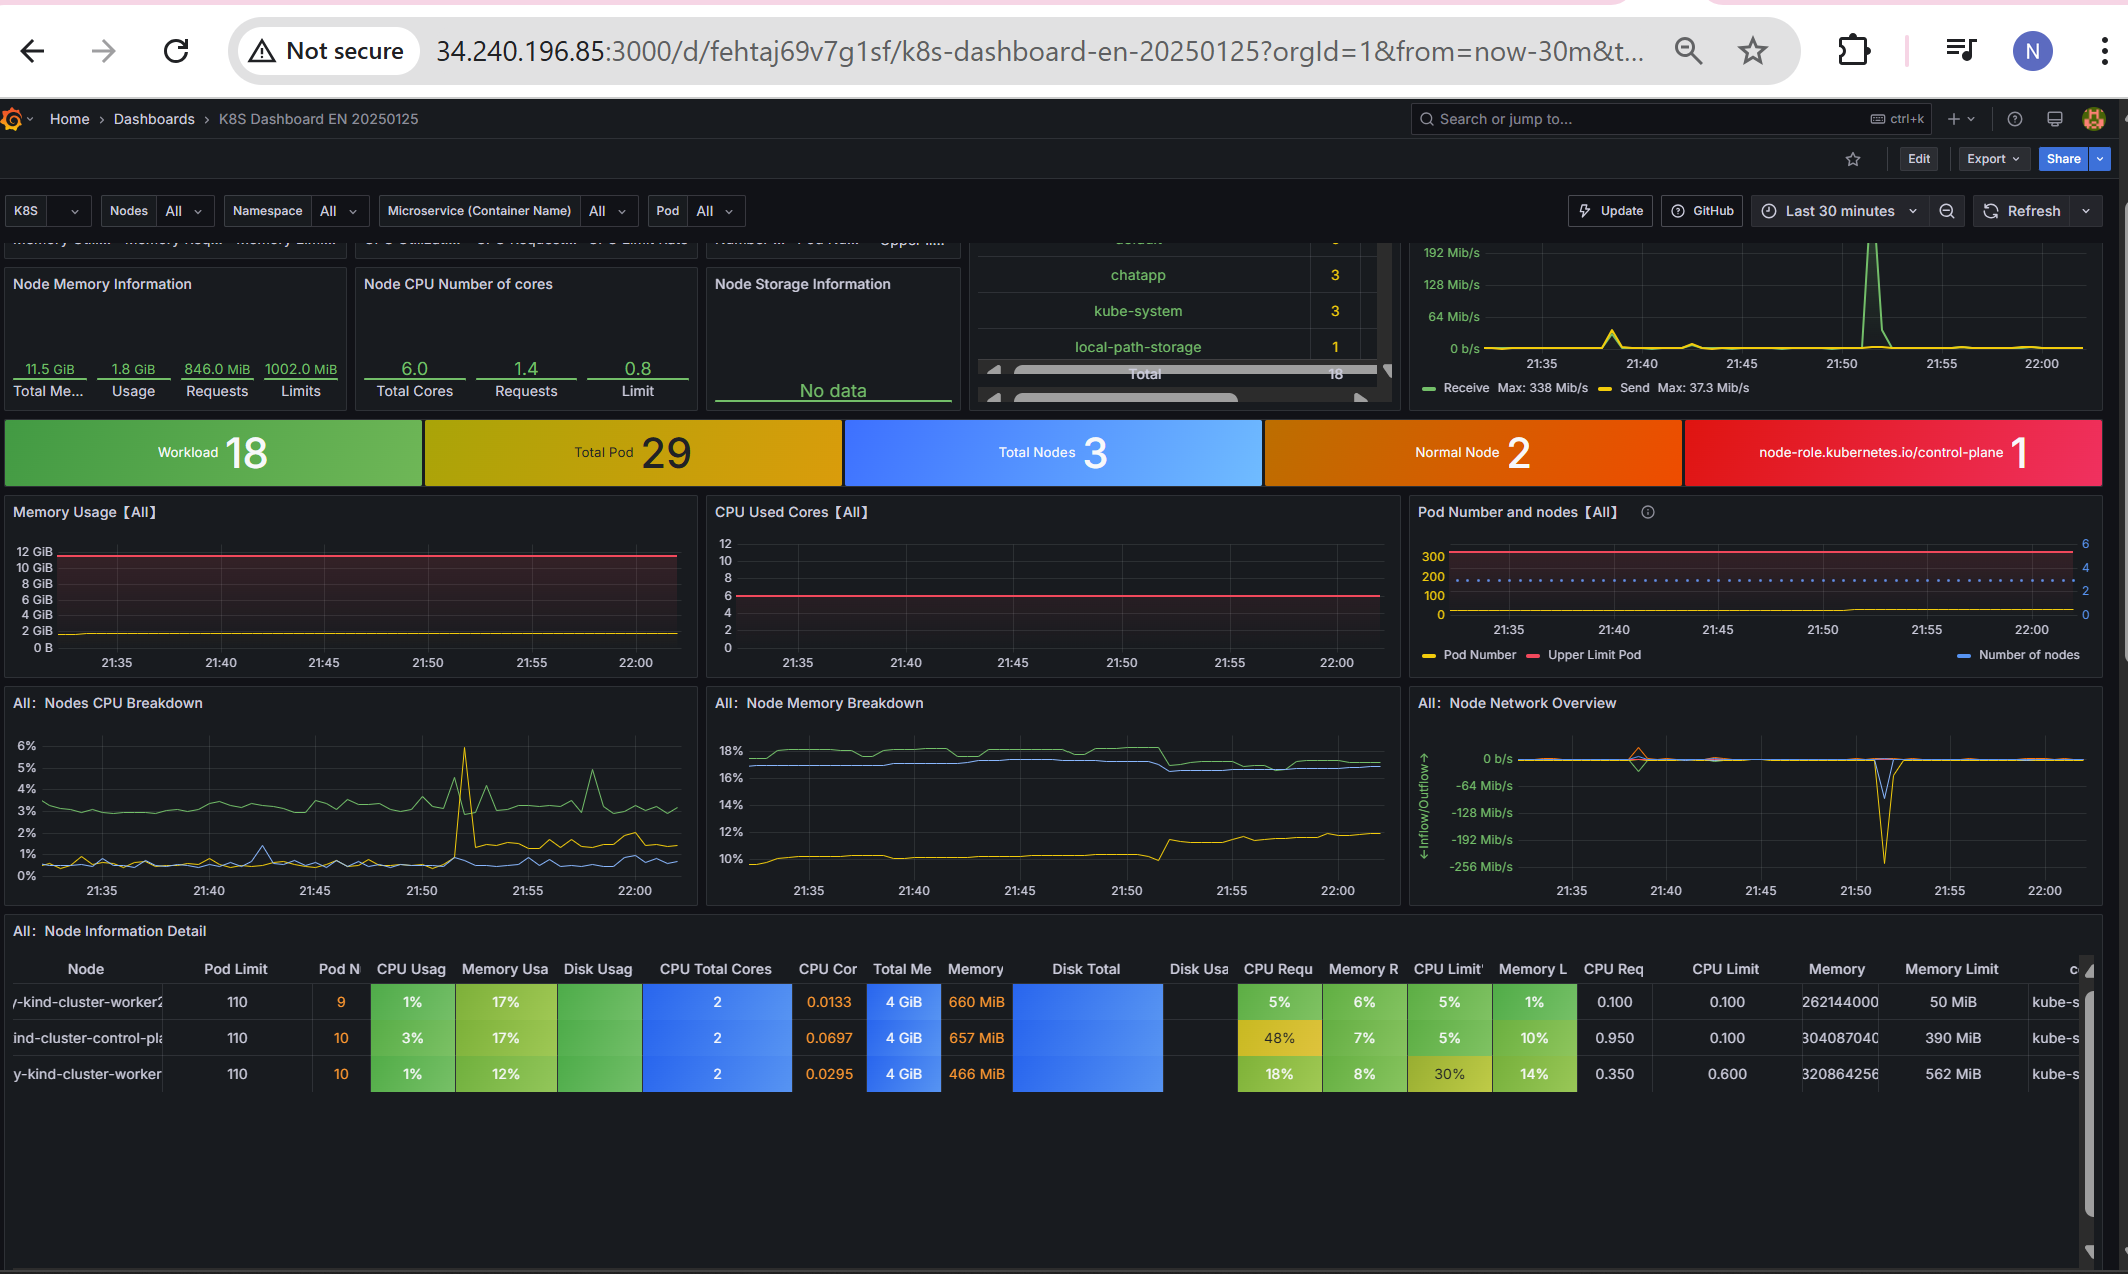
you can visualize from the k8s dashboards as below, we can get all the info about the workload, pod, namespace etc. we can also import Grafana Dashboards, if we want to.
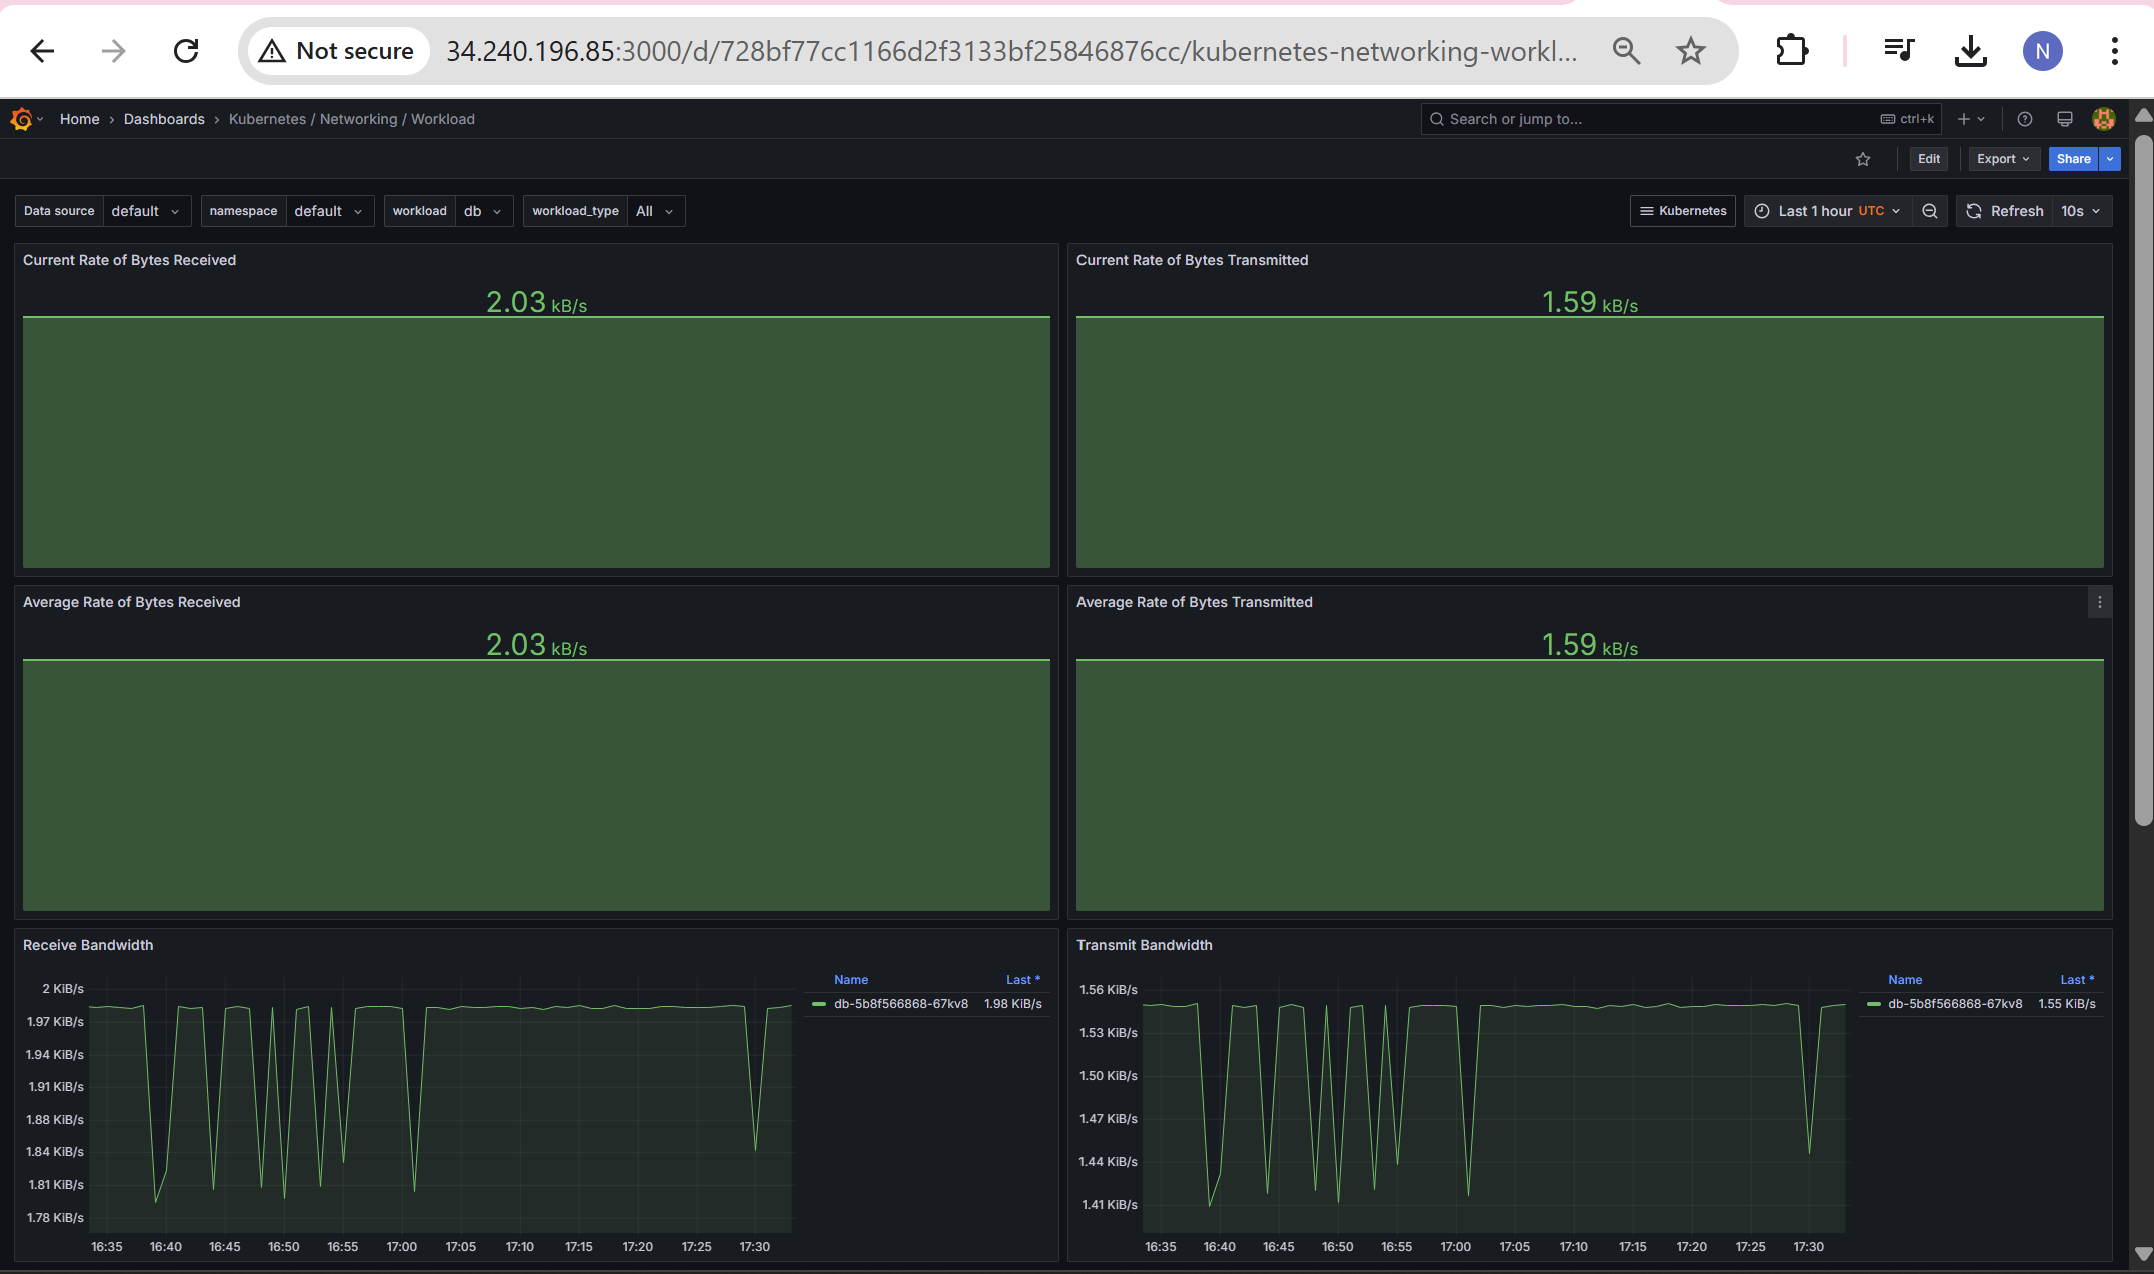
You can deploy any Kubernetes application to get the visualization.
Here is a visualization of the application that i deployed in k8s, Here you can monitor the application with the help of this Grafana Dashboard.
Conclusion:
This architecture ensures real-time monitoring, better debugging, and proactive alerting in Kubernetes clusters. Using Prometheus, Grafana, and Helm together simplifies observability and makes monitoring Kubernetes workloads efficient. By leveraging these tools, DevOps teams can gain valuable insights and keep their infrastructure healthy and performant.
Happy Helming!
Subscribe to my newsletter
Read articles from Nikitha Jain directly inside your inbox. Subscribe to the newsletter, and don't miss out.
Written by
