Deploy Hotstar Clone Application on Kubernetes [ EKS ] and monitor using prometheus/blackbox_exporter
 Nitesh Wayafalkar
Tools used in the current project:
Cloud: AWS
Server/VM: t3.medium
Containerization: docker
Orchestration: Kubernetes EKS
Node Types: Two instances of t2.Medium Nodes
SAST: Sonarqube, Trivy Scan | OWASP DC
Monitoring: prometheus/blackbox exporter
Dashboards: Grafana
Setting up Jenkins Server
Launch t3.Medium Ec2 Instance as Jenkins Server
Clone the git repository: https://github.com/niteshtheqa/hotstar-kubernetes.git
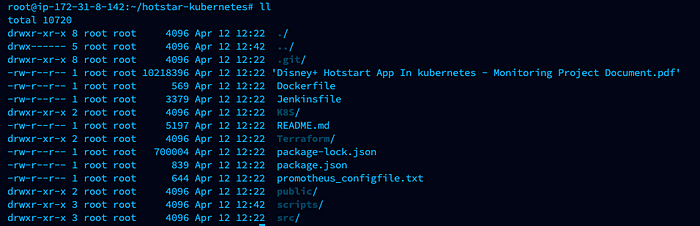
Navigate the scripts directory and first execute ./permissionexecute.sh
This will change permissions of all shell scripts, which will be helpful to install required applications on the Jenkins server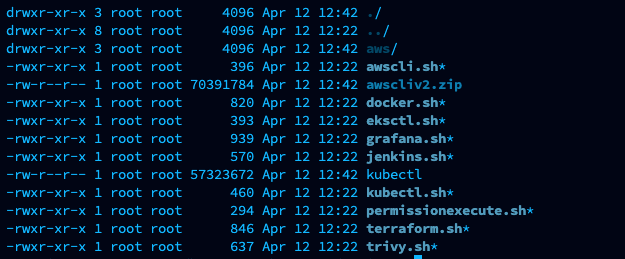
To set up Jenkins Server, follow instructions on the blog
Install Jenkins, launch Sonarqube as a docker container, and integrate both applications


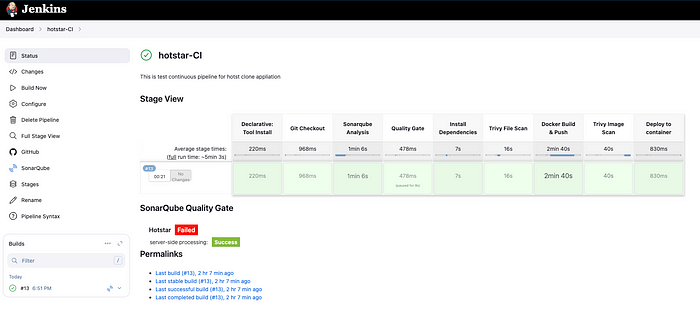
Now, let's build the Jenkins pipeline
Hotstar-CI
pipeline {
  agent any
  tools {
    jdk 'jdk'
    nodejs 'node'
  }
  environment {
    SCANNER_HOME = tool 'sonar-scanner'
  }
  stages {
    stage('Git Checkout') {
      steps {
        git branch: 'main', url: 'https://github.com/niteshtheqa/hotstar-kubernetes.git'
      }
    }
    stage("Sonarqube Analysis ") {
      steps {
        withSonarQubeEnv('sonar-scanner') {
          sh ''
          '
          $SCANNER_HOME / bin / sonar - scanner - Dsonar.projectName = Hotstar\ -
            Dsonar.projectKey = Hotstar ''
          '

        }
      }
    }
    stage("Quality Gate") {
      steps {
        script {
          waitForQualityGate abortPipeline: false, credentialsId: 'sonar-token'
        }
      }
    }
    /* stage('OWASP FS SCAN') {
            steps {
                dependencyCheck additionalArguments: '--scan ./ --disableYarnAudit --disableNodeAudit --nvdApiKey a58f03a4-2cf0-4db7-8abc-a107fe349435', odcInstallation: 'dc'
                dependencyCheckPublisher pattern: '**/
    /*dependency-check-report.xml'
           }
        } */

    stage("Install Dependencies") {
      steps {
        sh 'npm install'
      }
    }
    stage("Trivy File Scan") {
      steps {
        sh 'trivy fs -f table -o fs_scan_report.txt .'
      }
    }
    stage("Docker Build & Push") {
      steps {
        script {
          // This step should not normally be used in your script. Consult the inline help for details.
          withDockerRegistry(credentialsId: 'docker-token', toolName: 'docker') {
            sh "docker build -t hotstar ."
            sh "docker tag hotstar nitesh2611/hotstar:latest "
            sh "docker push nitesh2611/hotstar:latest "
          }
        }
      }
    }
    stage("Trivy Image Scan") {
      steps {
        sh "trivy image -f table -o img_scan_report.txt nitesh2611/hotstar:latest"
      }
    }
    stage('Deploy to container') {
      steps {
        sh 'docker run -d --name hotstar -p 3000:3000 nitesh2611/hotstar:latest'
      }
    }
  }
}

Application Deployed Successfully on Docker Container
Access your Hotstar clone application :
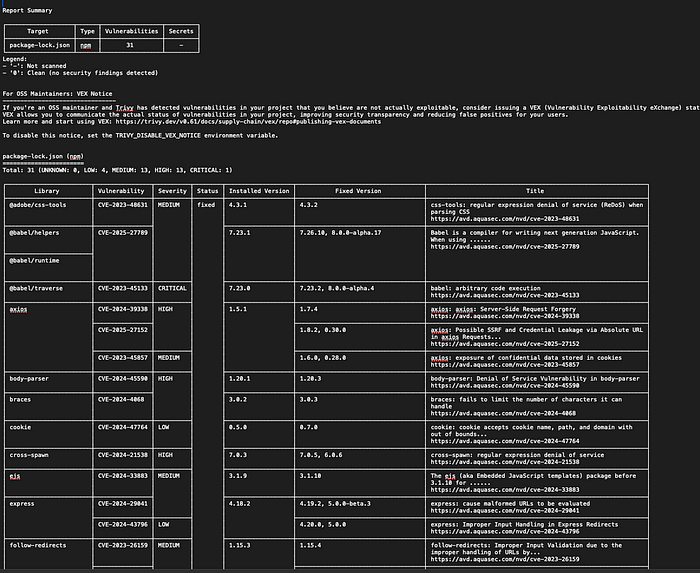
Trivy File Scan Report
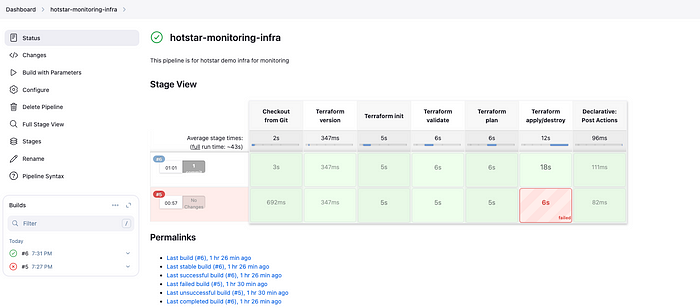
Create Terraform Infra Pipeline to set up Monitoring Server
pipeline {
    agent any

    environment {
        AWS_ACCESS_KEY_ID     = credentials('AWS_ACCESS_KEY_ID')
        AWS_SECRET_ACCESS_KEY = credentials('AWS_SECRET_ACCESS_KEY')
    }
 parameters {
        string(name: 'action', defaultValue: 'apply', description: 'Terraform action: apply or destroy')
    }
    stages {
        stage('Checkout from Git') {
            steps {
                 git branch: 'main', url: 'https://github.com/niteshtheqa/hotstar-kubernetes.git'
            }
        }

        stage('Terraform version') {
            steps {
                sh 'terraform --version'
            }
        }

        stage('Terraform init') {
            steps {
                dir('Terraform') {
                    sh '''
                    terraform init \
                    -backend-config="access_key=$AWS_ACCESS_KEY_ID" \
                    -backend-config="secret_key=$AWS_SECRET_ACCESS_KEY"
                    '''
                }
            }
        }

        stage('Terraform validate') {
            steps {
                dir('Terraform') {
                    sh 'terraform validate'
                }
            }
        }

        stage('Terraform plan') {
            steps {
                dir('Terraform') {
                    sh '''
                    terraform plan \
                    -var="access_key=$AWS_ACCESS_KEY_ID" \
                    -var="secret_key=$AWS_SECRET_ACCESS_KEY"
                    '''
                }
            }
        }

        stage('Terraform apply/destroy') {
            steps {
                dir('Terraform') {
                    sh '''
                    terraform ${action} --auto-approve \
                    -var="access_key=$AWS_ACCESS_KEY_ID" \
                    -var="secret_key=$AWS_SECRET_ACCESS_KEY"
                    '''
                }
            }
        }
    }

    post {
        success {
            echo '✅ Terraform execution completed successfully!'
        }
        failure {
            echo '❌ Terraform execution failed! Check the logs.'
        }
    }
}
Now, follow the below steps to deploy the Application on AWS EKS and install prometheus and black-box exporter and create a grafana dashboard
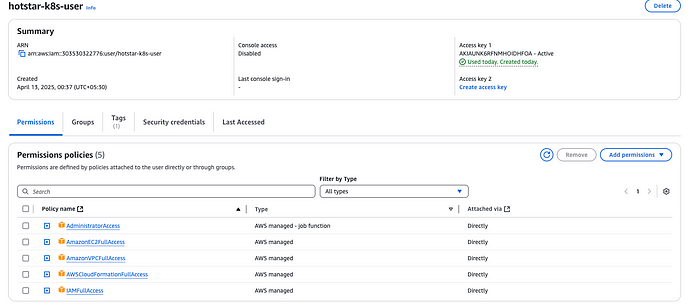
CREATE IAM User:
AWS IAM User & Secrets (Short Steps):
Sign in to the AWS Console.
Go to IAM > Users > Add user.
Enter the username, select “Programmatic access”.
Set permissions (groups or direct policies — least privilege!).
Review and create user.
Download the .csv file with the Access Key ID and Secret Access Key immediately and store it securely. You won’t see the Secret Key again.
Manage Keys: IAM User > Security credentials > Access keys.
Steps to Attach Admin-Like Policies (VPC, CloudFormation, EC2) to an IAM User:
Sign in to AWS Console.
Go to IAM > Users.
Select the IAM user.
Go to the “Permissions” tab.
Click “Add permissions”.
Select “Attach existing policies directly”.
Search and select the following AWS-managed policies:
AmazonVPCFullAccessAWSCloudFormationFullAccessAmazonEC2FullAccess
Click “Next: Review”.
Click “Add permissions”.
install AWSCLI and EKSCTL on Jenknis server
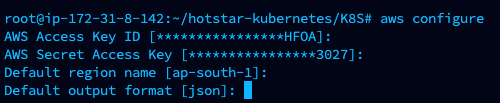
Pass the AWS Secrets
AWS CONFIGURE
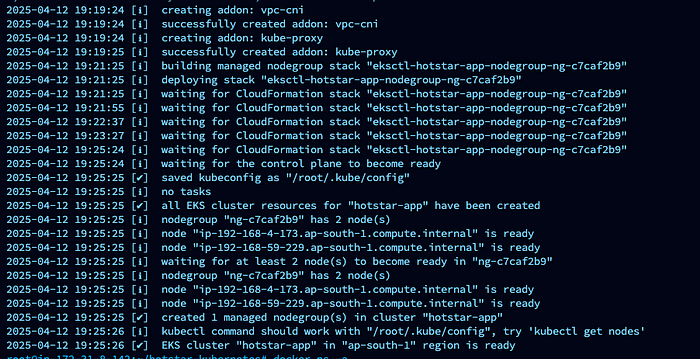
Create EKS Cluster by running the below command
eksctl create cluster --name cluster_name --region ap-south-1 --node-type t2.medium
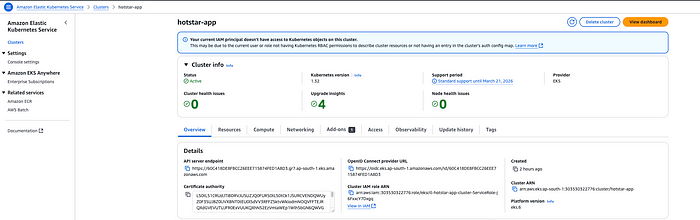
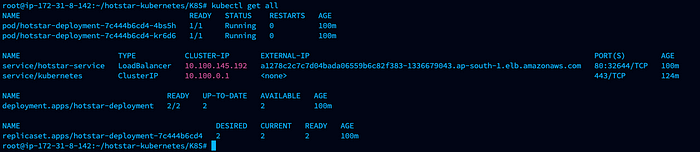
Execute command to deploy application on EKS Cluster
Navigate to directory K8S
kubectl apply -f manifest.yml
#Setting Up Prometheus and Grafana
Download prometheus and Blackbox_exporter from the following link
https://prometheus.io/download/
unzip both files
run shell script ./prometheus and ./blackbox_exporter
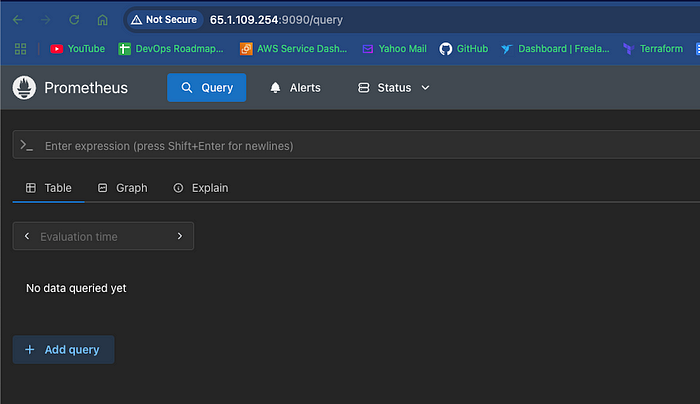
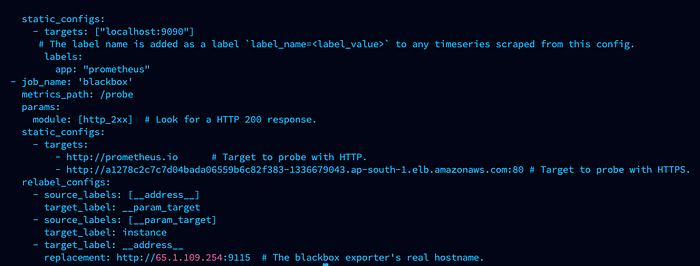
Add this block according to your servers and hosts in prometheus.yml
refresh and start ./prometheus
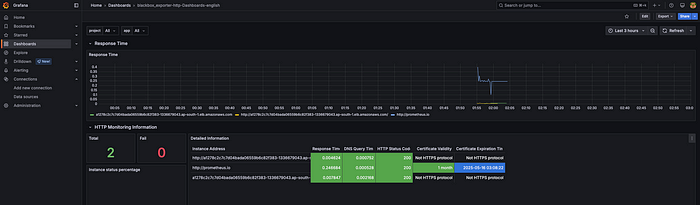
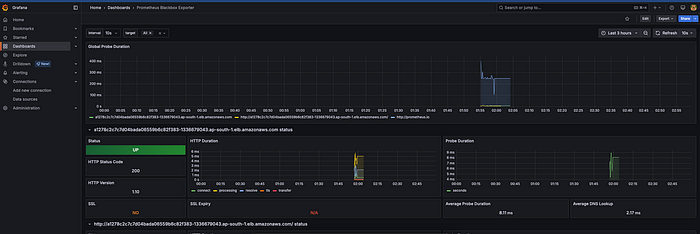
#Import Grafana Dashboard
1. Add Datasource as Prometheus
2. Search Dashboard on the grafana dashboard marketplace place
3. Import dashboard
prometheus.yml
Subscribe to my newsletter
Read articles from Nitesh Wayafalkar directly inside your inbox. Subscribe to the newsletter, and don't miss out.
Written by
Nitesh Wayafalkar
Nitesh Wayafalkar
I am carrying 9.5 Years of experience into IT. Earlier, I used to automate manual tests using Selenium and Rest assured to make the application robust and find defects in the early stage. Now, I help businesses time the market by automating application deployment process and secure them using different SAST and DAST tools along with various dashboard and alerting mechanism like Grafana. Also helped production by making application highly available and more faiure tolerant.