Forecast Stock Market Trends with AI-Powered Blazor Candle Charts
 syncfusion
TL;DR: Build an AI-powered stock forecasting tool using Blazor Candle Charts to predict market trends and make informed trading decisions for the next 45 days. The article covers setting up a data model, fetching stock data, configuring the chart, and adding interactive filters. It also details how to integrate Azure OpenAI in a Blazor application to generate and display future predictions.
Welcome to our “ Weekly Data Visualization ” blog series!
Stock trading is a dynamic field where traders must stay ahead of market trends to maximize profits and minimize risks. While historical data offers valuable insights into past trends, accurate forecasting is crucial for making informed investment decisions.
With advancements in AI-driven analytics, traders can now analyze historical stock data to predict future market trends more effectively. Blazor, a modern web framework developed by Microsoft, combined with Syncfusion Blazor Charts, empowers developers to create interactive financial dashboards that display historical data and predicted stock trends.
In this blog, we’ll explore how to:
Visualize stock market trends using a Syncfusion Blazor Candle Chart.
Integrate AI-powered predictive analytics to forecast stock prices for the next 45 days .
Enhance user interaction with filter options and customization.
By the end of this blog, you’ll have a powerful AI-driven stock forecasting tool that helps traders make more informed strategies.
Benefits of AI-Powered Candle Chart
Using AI to predict stock trends offers several advantages:
Informed decision-making: AI-based forecasts allow traders to anticipate potential price movements and adjust their strategies accordingly. These insights help identify opportunities and minimize risks.
Clear and intuitive visualization: The Syncfusion Blazor Candle Chart offers a visual representation of both historical trends and future predictions, making it easier to analyze stock patterns.
Strategic advantage in trading: By leveraging AI-driven insights, traders can take proactive measures, such as adjusting their investments based on anticipated market fluctuations.
Implementing the solution
We’ll build a Blazor application integrating AI-based predictive analytics into a Syncfusion Blazor Candle Chart.
Step 1: Setting up the data model
Why do we need a data model?
A data model is crucial for structuring and managing stock data efficiently. It ensures the Candle Chart receives properly formatted data, enabling smooth rendering and accurate AI-based forecasting.
Defining the stock data model
The C# class below represents stock details, including the date, open price, high price, low price, and close price. These attributes are essential for a Candle Chart, as they determine the shape and color of each candlestick.
public class StockDataModel
{
    public DateTime Period { get; set; }
    public double High { get; set; }
    public double Low { get; set; }
    public double Open { get; set; }
    public double Close { get; set; }
}
Understanding each property
Period: Used as the X-axis value, tracking stock prices over time.
Open: The first traded price at the market’s opening.
High: The highest price reached during the trading period.
Low: The lowest price recorded.
Close: The final traded price at the market’s close.
By defining this structure, we standardize the data, ensuring seamless integration with Syncfusion Blazor Charts.
Step 2: Initializing stock data
Most real-world stock data is fetched from external sources, such as financial APIs or CSV/JSON files. We use JSON files containing structured stock information to simulate a real-time data flow.
Fetching data asynchronously
We use Blazor’s OnInitializedAsync() lifecycle method to fetch stock data from a JSON file.
public List<StockDataModel> StockData { get; set; } = new List<StockDataModel>();

protected override async Task OnInitializedAsync()
{
    StockData = await Http.GetFromJsonAsync<List<StockDataModel>>(NavigationManager.BaseUri + "data/financial-data.json");
}
Example of JSON file structure (financial-data.json)
[
     {"Period": "2024-02-10", "Open": 150.25, "High": 155.75, "Low": 148.90, "Close": 153.30},
     {"Period": "2024-02-11", "Open": 153.40, "High": 157.00, "Low": 151.60, "Close": 156.10}
]
Step 3: Configuring the Syncfusion Blazor Candle Chart
Once the data is available, we configure the Candle Chart to display stock trends.
Refer to the following code example.
<SfChart>
    <ChartArea>
        <ChartAreaBorder Width="0"></ChartAreaBorder>
    </ChartArea>
    <ChartPrimaryXAxis ValueType="Syncfusion.Blazor.Charts.ValueType.DateTime" IntervalType="Syncfusion.Blazor.Charts.IntervalType.Months" Format="MMM dd" ZoomFactor="@ZoomFactor">
        <ChartAxisMajorGridLines Width="0"></ChartAxisMajorGridLines>
        <ChartAxisMajorTickLines Width="0" Height="0"></ChartAxisMajorTickLines>
        <ChartAxisLineStyle Width="0.2"></ChartAxisLineStyle>
        <ChartStriplines>
            <ChartStripline Start="@StripStartDate" End="@StripEndDate" Color="#E0E0E0" />
        </ChartStriplines>
    </ChartPrimaryXAxis>
    <ChartPrimaryYAxis>
        <ChartAxisMajorTickLines Width="0"></ChartAxisMajorTickLines>
        <ChartAxisLineStyle Width="0"></ChartAxisLineStyle>
    </ChartPrimaryYAxis>
    <ChartSeriesCollection>
        <ChartSeries DataSource="@StockData" XName="Period" Low="Low" High="High" Close="Close" Volume="Volume" Open="Open"
        Width="2" Type="ChartSeriesType.Candle" BearFillColor="#2ecd71" BullFillColor="#e74c3d">
        </ChartSeries>
    </ChartSeriesCollection>
</SfChart>
Key customizations
X-Axis (Time-Series) – Configured as DateTime to display stock trends over time.
Y-Axis (Stock Prices) – Displays open, close, high, and low values.
Bear/Bull Color Indicators – Green (#2ecd71) for price increases and Red (#e74c3d) for price drops.
This setup ensures a clear visualization of stock movements.
Step 4: Adding interactive filters with Blazor Grouped Button Control
To allow users to filter data by different time periods, we use the Blazor Grouped Button Control.
Refer to the following code example.
<SfButtonGroup Mode="Syncfusion.Blazor.SplitButtons.SelectionMode.Multiple">
    <ButtonGroupButton @bind-Selected="@IsOneMonthSelected" @onclick="GetOneMonthData">1 Month<</ButtonGroupButton>
    <ButtonGroupButton @bind-Selected="@IsThreeMonthsSelected" @onclick="GetThreeMonthsData">3 Months</ButtonGroupButton>
    <ButtonGroupButton @bind-Selected="@IsSixMonthsSelected" @onclick="GetSixMonthsData">6 Months</ButtonGroupButton>
</SfButtonGroup>
The chart will now appear, as shown in the following image, displaying the stock details for the last three months.
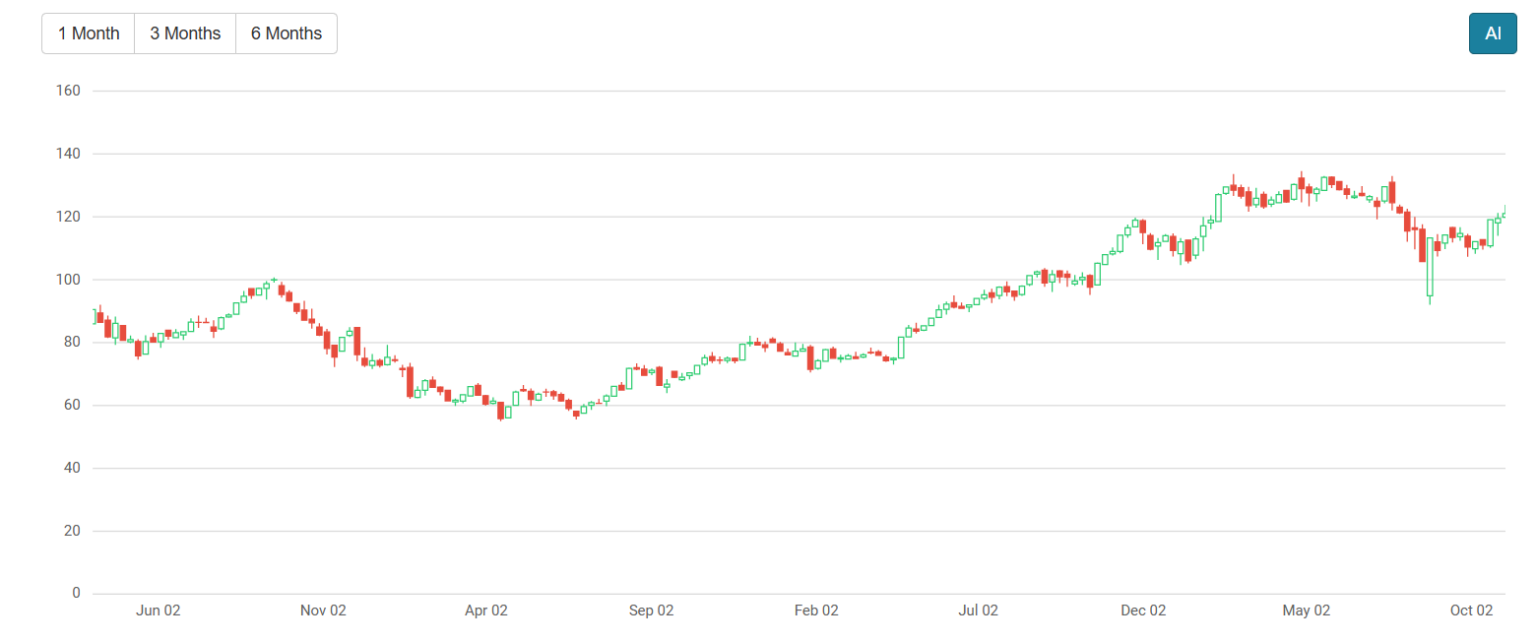
Interactive Filters with Blazor Grouped Button Control
Step 5: AI-driven stock prediction
We’ll use Azure OpenAI to analyze historical data and predict the stock’s performance over the next 45 days. The AI model identifies patterns in the data and leverages them to forecast future prices, providing insights into potential market movements.
Let’s look at how we can achieve these results.
Integrating Azure OpenAI with your Blazor app
First, ensure you have access to Azure OpenAI and have created a deployment in the Azure portal. Then, you can find the Azure.AI.OpenAI NuGet package in the NuGet Gallery.
Follow these steps once you have your key, endpoint, and deployment model.
Implementing Azure OpenAI service in Blazor
Create a service class in Blazor to manage communication with Azure OpenAI.
public class AzureOpenAIService
 {
     private readonly HttpClient _httpClient;
     private readonly string _endpoint = "{YOUR_END_POINT}";
     private readonly string _apiKey = "{YOUR_API_KEY}";
     private readonly string _deployment = "{YOUR_MODEL_NAME";

     public AzureOpenAIService(HttpClient httpClient)
     {
         _httpClient = httpClient ?? throw new ArgumentNullException(nameof(httpClient));
     }
}
Registering the service
Modify the Program.cs file to register the service
builder.Services.AddScoped<AzureOpenAIService>();
Creating a prompt and triggering AI
To generate stock price predictions, we need to create a structured prompt and send it to Azure OpenAI.
Building the prompt:
public string GeneratePrompt(List<StockDataModel> historicalData)
{
    var prompt = new StringBuilder("Predict OHLC values for the next 45 days based on the given historical data:\n");

    foreach (var data in historicalData)
    {
        prompt.AppendLine($"{data.Period:yyyy-MM-dd}: {data.High}, {data.Low}, {data.Open}, {data.Close}");
    }

    prompt.AppendLine("\n### STRICT OUTPUT REQUIREMENTS ###");
    prompt.AppendLine("- Generate EXACTLY 45 rows of data.");
    prompt.AppendLine("- Each row must be in the format: yyyy-MM-dd:High:Low:Open:Close.");
    prompt.AppendLine("- The predictions must include a natural mix of both upward and downward trends.");
    prompt.AppendLine("- NO missing or duplicate dates.");
    prompt.AppendLine("- NO extra text, explanations, or labels—just raw data.");
    prompt.AppendLine("- Ensure that each day's values are **realistic** and follow stock market behavior.");

    return prompt.ToString();
}
Sending the request to Azure OpenAI:
public async Task<string> GetResponseFromOpenAI(string prompt)
{
    var requestBody = new
    {
        messages = new[]
    {
       new { role = "user", content = prompt }
    },
        max_tokens = 2000
    };

    var request = new HttpRequestMessage(HttpMethod.Post, $"{_endpoint}/openai/deployments/{_deployment}/chat/completions?api-version=2023-07-01-preview")
    {
        Content = JsonContent.Create(requestBody)
    };

    request.Headers.Add("api-key", _apiKey);

    var response = await _httpClient.SendAsync(request);
    if (response.IsSuccessStatusCode)
    {
        var responseJson = await response.Content.ReadAsStringAsync();
        using var doc = JsonDocument.Parse(responseJson);
        return doc.RootElement.GetProperty("choices")[0].GetProperty("message").GetProperty("content").GetString();
    }
    else
    {
        var errorContent = await response.Content.ReadAsStringAsync();
        return $"Error: {response.StatusCode} - {errorContent}";
    }
}
Displaying forecasted data
Once we receive the AI-generated predictions, we can update our Blazor component to display them using a Candle Chart.
Updating the UI with predicted data:
 private async Task GenerateCollection(string dataSource)
{
    StripStartDate = StockData.Last().Period;
    string[] rows = dataSource.Split(new[] { "\r\n", "\n" }, StringSplitOptions.RemoveEmptyEntries);

    if (StockData == null)
        StockData = new List<StockDataModel>();

    foreach (string row in rows)
    {
        string[] columns = row.Split(':');

        if (columns.Length < 5) continue;

        if (!DateTime.TryParse(columns[0].Trim(), out DateTime period)) continue;

        StockDataModel item = new StockDataModel
        {
            Period = period,
            Open = GetDouble(columns[3]),
            High = GetDouble(columns[1]),
            Low = GetDouble(columns[2]),
            Close = GetDouble(columns[4])
        };

        StripEndDate = period;
        StockData.Add(item);
        await InvokeAsync(StateHasChanged);

        // Simulate live update every 500ms
        await Task.Delay(500);
    }
}
Refer to the following output image.
Forecasting Stock Trends with AI-Powered Blazor Candle Chart
GitHub reference
For more details, refer to the forecasting stock trends with AI-powered smart Blazor Candle Chart GitHub demo.
Conclusion
Thanks for reading! In this blog, we’ve explored forecasting stock trends using the AI-powered smart Syncfusion Blazor Candle Chart. We also learned to integrate Azure OpenAI for robust predictive analytics to support intelligent trading decisions. Try out the steps outlined in this blog, and feel free to leave your feedback in the comments section below!
The latest version of the Blazor Charts component is available for existing customers from the License and Downloads page. If you are not yet a customer, try our 30-day free trial to check it out.
You can also contact us through our support forum, support portal, orfeedback portal. We are always happy to assist you!
Related Blogs
Subscribe to my newsletter
Read articles from syncfusion directly inside your inbox. Subscribe to the newsletter, and don't miss out.
Written by
syncfusion
syncfusion
Syncfusion provides third-party UI components for React, Vue, Angular, JavaScript, Blazor, .NET MAUI, ASP.NET MVC, Core, WinForms, WPF, UWP and Xamarin.