Analyze Investment Portfolios with .NET MAUI Charts
 syncfusion
TL;DR: Learn how to use the .NET MAUI Toolkit to create interactive charts for investment portfolio analysis. This guide covers implementing pie, line, and column charts, complete with code examples and instructions, to build a dashboard for visualizing asset allocation and performance.
Welcome to the Chart of the Week blog series!
Why portfolio charts?
Portfolio charts are used to visually track the performance, allocation, and diversification of investments over time. They help analyze risk, return, and asset distribution effectively. An investment portfolio is a collection of assets like stocks, bonds, and mutual funds managed to achieve financial goals. Portfolio management helps diversify risk, maximize returns, and align investments with long-term objectives. It is widely used by individual investors, financial advisors, and institutions for wealth growth and risk assessment.
By analyzing portfolio performance, investors can make informed decisions about asset allocation and strategy adjustments. Corporations, banks, and hedge funds use portfolio analysis for financial planning and risk mitigation.
Today, we will explore how to create a comprehensive Investment Portfolio Analysis using Syncfusion’s SfCartesianChart and SfCircularChart in .NET MAUI. This visualization will illustrate the 20-year trajectory of portfolio growth, annual returns, and asset allocation distribution, offering valuable insights into investment performance over time. By leveraging multiple chart types, this analysis will provide a holistic view of investment strategies, risk management, and long-term financial gains.
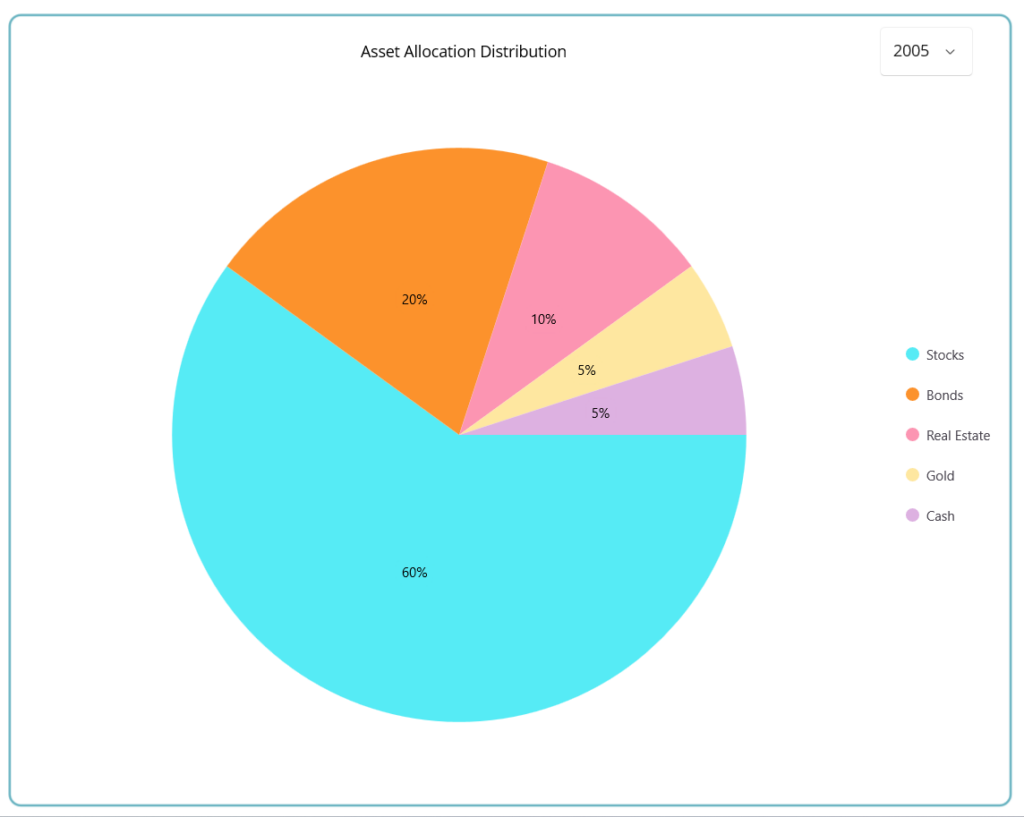
One of the key aspects of this analysis is asset allocation distribution, represented by a Pie Series. This chart will effectively display the proportional breakdown of various asset classes, such as equities, bonds, real estate, and alternative investments, within a portfolio. This visualization enables investors to assess diversification strategies and risk exposure, ensuring a balanced investment approach.
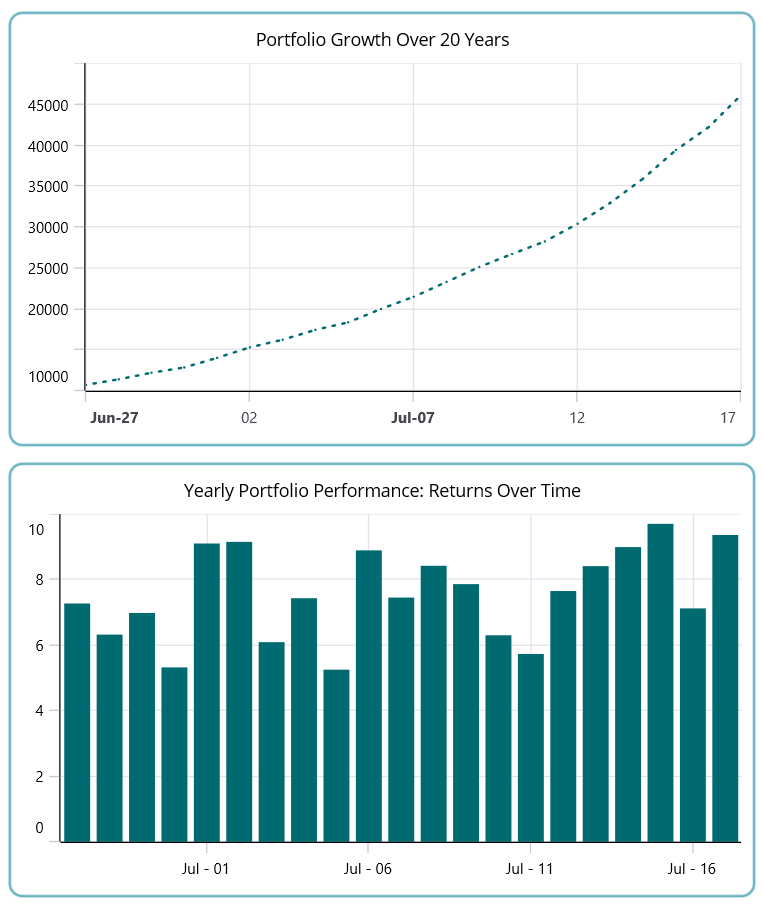
Additionally, we will use a Line Series to illustrate portfolio growth over the past 20 years. This series visualization will highlight how the value of investments has evolved, showcasing trends in appreciation, market downturns, and recovery periods. A steady upward trend signifies consistent growth, while fluctuations reflect market volatility.
The Yearly Portfolio Performance will be represented using a Column Series, providing a clear depiction of annual returns. Each column will indicate the percentage return for a given year, allowing investors to compare different periods and identify high-performing years versus market downturns.
In this dashboard, multiple UI elements, including Line, Column, and Pie charts, come together to present a clear and insightful visualization of investment performance. This comprehensive approach will empower individuals to make informed financial decisions, ensuring a well-structured and optimized investment portfolio over time.
Let’s explore the steps involved in visualizing the investment portfolio using the Syncfusion MAUI Cartesian Chart.
Step 1: Preparing the data for the chart
Before creating the investment analysis charts, it’s essential to structure the data properly. This involves defining a PortfolioModel, which represents individual portfolio components, and a PortfolioViewModel, which manages data manipulation and communication between the model and the charts.
  public class PortfolioModel
 {
     public int Year { get; set; }
     public double PortfolioValue { get; set; }
     public double AnnualReturn { get; set; }
     public string? Sector { get; set; }
     public double Value { get; set; }
     public PortfolioModel(string? sector, double value)
     {
         Sector = sector;
         Value = value;
     }
 }
Next, create a PortfolioViewModel to hold the collection of dataScriptorStartFragment, as shown in the following code example.ScriptorEndFragment
public class PortfolioViewModel : INotifyPropertyChanged
{
    public ObservableCollection<PortfolioModel> PortfolioHistory { get; set; }
    public ObservableCollection<string> Years { get; set; }
    public string SelectedYear { get; set; }

    private ObservableCollection<PortfolioModel>? _portfolioData;
    public ObservableCollection<PortfolioModel> PortfolioData
    {
        get => _portfolioData!;
        set
        {
            if (_portfolioData != value)
            {
                _portfolioData = value;
                OnPropertyChanged(nameof(PortfolioData));
            }
        }
    }

    public event PropertyChangedEventHandler? PropertyChanged;

    public PortfolioViewModel()
    {
        PortfolioHistory = new ObservableCollection<PortfolioModel>();
        Years = new ObservableCollection<string> { "2005", "2010", "2015", "2020", "2025" };
        SelectedYear = "2005";

        UpdatePortfolioData(SelectedYear);
        GeneratePortfolioData();
    }

    protected void OnPropertyChanged(string propertyName)
    {
        PropertyChanged?.Invoke(this, new PropertyChangedEventArgs(propertyName));
    }

    public void UpdatePortfolioData(string year)
    {
        PortfolioData = year switch
        {
            "2005" => new ObservableCollection<PortfolioModel>
            {
                new PortfolioModel("Stocks", 60),
                new PortfolioModel("Bonds", 20),
                new PortfolioModel("Real Estate", 10),
                new PortfolioModel("Gold", 5),
                new PortfolioModel("Cash", 5)
            },
            "2010" => new ObservableCollection<PortfolioModel>
            {
                new PortfolioModel("Stocks", 55),
                new PortfolioModel("Bonds", 25),
                new PortfolioModel("Real Estate", 12),
                new PortfolioModel("Gold", 5),
                new PortfolioModel("Cash", 3)
            },
            "2015" => new ObservableCollection<PortfolioModel>
            {
                new PortfolioModel("Stocks", 50),
                new PortfolioModel("Bonds", 30),
                new PortfolioModel("Real Estate", 15),
                new PortfolioModel("Gold", 4),
                new PortfolioModel("Cash", 1)
            },
            "2020" => new ObservableCollection<PortfolioModel>
            {
                new PortfolioModel("Stocks", 45),
                new PortfolioModel("Bonds", 35),
                new PortfolioModel("Real Estate", 17),
                new PortfolioModel("Gold", 2),
                new PortfolioModel("Cash", 1)
            },
            "2025" => new ObservableCollection<PortfolioModel>
            {
                new PortfolioModel("Stocks", 40),
                new PortfolioModel("Bonds", 40),
                new PortfolioModel("Real Estate", 18),
                new PortfolioModel("Gold", 1),
                new PortfolioModel("Cash", 1)
            },
            _ => PortfolioData
        };
    }

    private void GeneratePortfolioData()
    {
        double initialInvestment = 10000;
        double currentValue = initialInvestment;
        Random rand = new();

        for (int year = 2005; year <= 2025; year++)
        {
            double annualReturn = 5 + rand.NextDouble() * 5;
            currentValue *= 1 + annualReturn / 100;

            PortfolioHistory.Add(new PortfolioModel
            {
                Year = year,
                PortfolioValue = Math.Round(currentValue, 2),
                AnnualReturn = Math.Round(annualReturn, 2)
            });
        }
    }
}
Step 2: Configure the Syncfusion MAUI Toolkit Cartesian Chart
Let’s configure the Syncfusion MAUI Toolkit Cartesian Chart control using the provided documentation.
<chart:SfCartesianChart>
    <chart:SfCartesianChart.XAxes>
       <chart:DateTimeAxis/>
    </chart:SfCartesianChart.XAxes>
    <chart:SfCartesianChart.YAxes>
       <chart:NumericalAxis/>
    </chart:SfCartesianChart.YAxes>
</chart:SfCartesianChart>
Binding data to the chart for portfolio growth
Bind the view model properties with the Line Series in SfCartesianChart to visualize the portfolio’s historical growth. The ItemsSource binds to PortfolioHistory, using XBindingPath (Year) and YBindingPath (PortfolioValue) to plot data points.
<!—Portfolio Growth-->
<Border Grid.Row="0" Grid.Column="1">
   <chart:SfCartesianChart >
      <chart:LineSeries ItemsSource="{Binding PortfolioHistory}" YBindingPath="PortfolioValue">
      </chart:LineSeries>
   </chart:SfCartesianChart>
</Border>
Binding data to the chart for portfolio performance
Bind the view model properties with the Column Series in SfCartesianChart , which represents annual portfolio returns. The ItemsSource binds to PortfolioHistory, mapping XBindingPath (Year) and YBindingPath (AnnualReturn) for visualization.
<!—Portfolio Performance-->
<Border Grid.Row="1" Grid.Column="1" >
    <chart:SfCartesianChart>
     <chart:ColumnSeries ItemsSource="{Binding PortfolioHistory}" XBindingPath="Year" YBindingPath="AnnualReturn">
     </chart:ColumnSeries>
    </chart:SfCartesianChart>
</Border>
Customizing the axis
Syncfusion charts offer extensive customization options for both XAxes and YAxes, allowing users to define ranges, axis line style, and label styles for improved clarity and context. The IsVisible property in the axis determines whether the axis line should be displayed or not.
<chart:SfCartesianChart.XAxes>
    <chart:DateTimeAxis>
     <chart:DateTimeAxis.LabelStyle>
      <chart:ChartAxisLabelStyle TextColor="Black"/>
     </chart:DateTimeAxis.LabelStyle>
     <chart:DateTimeAxis.AxisLineStyle>
      <chart:ChartLineStyle Stroke="Black"/>
     </chart:DateTimeAxis.AxisLineStyle>
    </chart:DateTimeAxis>
</chart:SfCartesianChart.XAxes>

<chart:SfCartesianChart.YAxes>
    <chart:NumericalAxis>
     <chart:NumericalAxis.LabelStyle>
      <chart:ChartAxisLabelStyle Stroke="Black" TextColor="Black"/>
     </chart:NumericalAxis.LabelStyle>
     <chart:NumericalAxis.AxisLineStyle>
      <chart:ChartLineStyle Stroke="Black"/>
     </chart:NumericalAxis.AxisLineStyle>
    </chart:NumericalAxis>
</chart:SfCartesianChart.YAxes>
Customizing the series
We can enhance the series appearance using Fill, StrokeWidth, and StrokeDashArray properties as follows:
<!--Growth Chart-->

<chart:SfCartesianChart >
    <chart:LineSeries ItemsSource="{Binding PortfolioHistory} EnableTooltip="True" StrokeDashArray="1,3" Fill="#006A71" StrokeWidth="2" XBindingPath="Year" YBindingPath="PortfolioValue">
    </chart:LineSeries>
</chart:SfCartesianChart>

<!--Performance Chart-->

<chart:SfCartesianChart >
    <chart:ColumnSeries ItemsSource="{Binding PortfolioHistory}" EnableTooltip="True" Fill="#006A71" XBindingPath="Year" YBindingPath="AnnualReturn">
    </chart:ColumnSeries>
</chart:SfCartesianChart>
MAUI Toolkit Cartesian Chart control
Step 3: Configure the Syncfusion MAUI Toolkit Circular Chart
Let’s configure the Syncfusion MAUI Toolkit Circular Chart control using the provided documentation.
<Border Grid.Column="0">
    <chart:SfCircularChart></chart:SfCircularChart>
</Border>
Binding data to the chart for asset allocation
Bind the PortfolioViewModel to the chart’s BindingContext and the view model properties with the Pie Series of SfCircularChart represents sector-wise allocation. The ItemsSource property binds to PortfolioData, while XBindingPath and YBindingPath map sector names (Sector) and their respective values (Value).
Refer to the following code example.
<!—Asset Allocation-->
<chart:SfCircularChart>
    <chart:PieSeries ItemsSource="{Binding PortfolioData}" XBindingPath="Sector" YBindingPath="Value">
    </chart:PieSeries>
</chart:SfCircularChart>
Customizing the chart legend
The legend provides a list of data points that helps identify the corresponding data points in the chart. We can place the legend in the required position using the Placement Property.
<chart:SfCircularChart.Legend>
    <chart:ChartLegend Placement="Right"/>
</chart:SfCircularChart.Legend>
Customize the Pie Chart color
Refer to the following example code to customize the chart’s color using the PaletteBrushes property.
<chart:PieSeries PaletteBrushes="{Binding Palette}">
</chart:PieSeries>
C#
public class PortfolioViewModel
{
    public ObservableCollection<Brush> Palette { get; set; }

    public PortfolioViewModel()
    {
        Palette = new ObservableCollection<Brush>
        {
            new SolidColorBrush(Color.FromArgb("#56EBF5")),
            new SolidColorBrush(Color.FromArgb("#FC922C")),
            new SolidColorBrush(Color.FromArgb("#FC95B2")),
            new SolidColorBrush(Color.FromArgb("#FEE7A0")),
            new SolidColorBrush(Color.FromArgb("#DDB1E1")),
            new SolidColorBrush(Color.FromArgb("#EBD9EB"))
        };
    }
}
Enhancing the interactivity of Circular Chart titles with Combo Box selection
Let’s make our distribution data chart more interactive. We can use the picker to change the year and update the data in the pie chart.
<chart:SfCircularChart Grid.Row="0"
    <chart:SfCircularChart.Title>
     <HorizontalStackLayout HorizontalOptions="CenterAndExpand">
      <Label Text="Asset Allocation Distribution"
             HorizontalOptions="Center"
             TextColor="Black" />
      <Picker ItemsSource="{Binding Source={x:Reference viewModel}, Path=Years}"
              SelectedIndex="0
              HorizontalOptions="End"
              SelectedIndexChanged="Picker_SelectedIndexChanged"/>
     </HorizontalStackLayout>
    </chart:SfCircularChart.Title>
</chart:SfCircularChart>
MAUI Toolkit Circular Chart control
By combining the portfolio growth chart, annual return analyzer, and asset allocation distribution, we create a comprehensive dashboard for investment analysis. This provides users with valuable insights into their financial performance, helping them make informed decisions and optimize their investment strategies for long-term growth.
<Grid >
    <Grid.RowDefinitions>
     <RowDefinition Height="0.1*"/>
     <RowDefinition Height="0.9*"/>
    </Grid.RowDefinitions>

    <Grid Grid.Row="0" >
    </Grid>

    <Grid Grid.Row="1" ColumnSpacing="15">
     <Grid.ColumnDefinitions>
      <ColumnDefinition Width="0.6*"/>
      <ColumnDefinition Width="0.4*"/>
     </Grid.ColumnDefinitions>

     <!—Asset Allocation-->
     <Border Grid.Column="0" >
     </Border>

     <Grid Grid.Column="1" Grid.Row="1" RowSpacing="12">
      <Grid.RowDefinitions>
       <RowDefinition/>
       <RowDefinition/>
      </Grid.RowDefinitions>

      <!—Portfolio Growth-->
      <Border Grid.Row="0" Grid.Column="1" >
      </Border>

      <!—Portfolio Performance-->
      <Border Grid.Row="1" Grid.Column="1" >
      </Border>
     </Grid>
    </Grid>
</Grid>
After executing the previous code examples, the output will look like the following image.
Visualize Investment Portfolio with .NET MAUI Toolkit charts
GitHub reference
For more details, refer to the project on Visualizing Investment Portfolio with .NET MAUI Toolkit charts GitHub demo.
Conclusion
Thank you for reading! In this blog, we have explored how to create a .NET MAUI portfolio visualization using Pie, Line, and Column Charts. These charts help illustrate sector allocation, portfolio growth, and annual returns effectively. We encourage you to follow the steps outlined in this blog and share your feedback in the comments section below.
Existing customers can access the new version of Essential Studio® on the License and Downloads page. If you aren’t a Syncfusion customer, try our 30-day free trial to experience our fantastic features.
If you require assistance, please don’t hesitate to contact us via our support forum, support portal, or feedback portal. We are always eager to help you!
Related Blogs
Subscribe to my newsletter
Read articles from syncfusion directly inside your inbox. Subscribe to the newsletter, and don't miss out.
Written by
syncfusion
syncfusion
Syncfusion provides third-party UI components for React, Vue, Angular, JavaScript, Blazor, .NET MAUI, ASP.NET MVC, Core, WinForms, WPF, UWP and Xamarin.