Istio: A Service Mesh Tools
 Harshit Sahu
What is Istio?
Istio is like a “traffic controller” for your app’s services when they talk to each other over the network. Instead of you writing code to manage security, balancing loads, and monitoring traffic between services, Istio handles it for you, allowing services to talk safely and efficiently. It helps with:
Securing Communication: Istio encrypts data between services to keep it safe.
Traffic Management: It balances traffic between services so one doesn’t get overloaded.
Observing Performance: Istio keeps track of how well services are doing and logs any issues.
This all happens automatically without needing to change your app’s code.

How Istio Works: Control Plane and Data Plane
Control Plane (The Brain)
The control plane is like Istio’s “brain.” It’s where all the rules for traffic, security, and monitoring are set up. The control plane tells proxies (see below) how to manage traffic between services.
Data Plane (The Worker)
The data plane is the “worker” that actually does the job. It has proxies (small helpers) next to each service. These proxies make sure that traffic flows as it should, based on the rules the control plane sets up.
- Proxies: These are small tools next to each service. They manage traffic, secure communication, and collect information about how well services are working.
How Proxies Work: Sidecar vs. Ambient Mode
Sidecar Mode: Each service has its own proxy attached to it. This is the more common setup, giving a lot of control but adds a little extra load on each service.
Ambient Mode: One proxy on each server manages traffic for all services. This reduces the extra load but has slightly fewer features.
Why Use Istio?
Security: Istio encrypts communication, adding strong protection.
Efficiency: It keeps traffic balanced, so no single service is overloaded.
Easy Monitoring: Istio collects data, showing you how well services are working without needing extra code.
Installing Istio
Below are the steps to install Istio on a Kubernetes cluster. This guide uses the default profile, a great choice for production setups.
Step 1: Download Istio
- Download the Istio installation file for your operating system.
For Linux or macOS, run the following command:
curl -L https://istio.io/downloadIstio | sh -
2. Move to the Istio package directory. The directory name may vary with each version (e.g., istio-1.23.2).
cd istio-1.25.2
Note: Ensure you’re in the correct directory as we’ll be using the
bin,samples/addons, andsamples/bookinfofolders in the following steps.
Step 2: Add istioctl to Your Path
To make the istioctl command easy to use, add it to your system path. Run this command:
export PATH=$PWD/bin:$PATH
Step 3: Install Istio with the Default Profile
- To install Istio on your Kubernetes cluster with the default configuration, use the following command:
istioctl install -f samples/bookinfo/demo-profile-no-gateways.yaml -y
- Add a namespace label to instruct Istio to automatically inject Envoy sidecar proxies when you deploy your application later:
kubectl label namespace default istio-injection=enabled
namespace/default labeled
Install the Kubernetes Gateway API CRDs
The Kubernetes Gateway API CRDs do not come installed by default on most Kubernetes clusters, so make sure they are installed before using the Gateway API.
Install the Gateway API CRDs, if they are not already present:
kubectl get crd gateways.gateway.networking.k8s.io &> /dev/null || \
{ kubectl kustomize "github.com/kubernetes-sigs/gateway-api/config/crd?ref=v1.2.1" | kubectl apply -f -; }
Deploying the Bookinfo Application
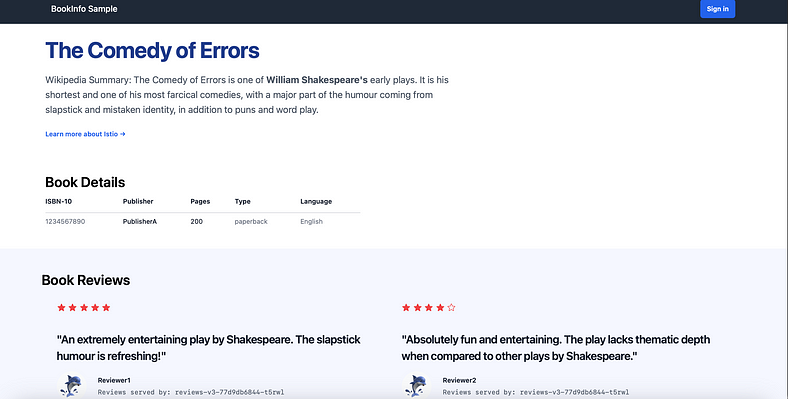
The Bookinfo application is a sample app from the Istio that demonstrates various Istio features. It consists of four microservices:
productpage: Displays information about a book.
details: Provides book details (e.g., ISBN, number of pages).
reviews: Displays book reviews with three different versions:
v1: No rating stars.
v2: Shows 1–5 black stars.
v3: Shows 1–5 red stars.ratings: Provides the rating data for reviews.
These services come together to form a simple bookstore app, which is excellent for exploring Istio’s traffic management, security, and observability features.
Step 1: Set Up Your Kubernetes Namespace for Istio
- Label the
defaultnamespace for sidecar injection:
kubectl get ns default --show-labels
NAME         STATUS   AGE     LABELS
default   Active   4h58m   istio-injection=enabled
2. Deploy the Bookinfo app:
kubectl apply -f samples/bookinfo/platform/kube/bookinfo.yaml
service/details created serviceaccount/bookinfo-details created deployment.apps/details-v1 created service/ratings created serviceaccount/bookinfo-ratings created deployment.apps/ratings-v1 created service/reviews created serviceaccount/bookinfo-reviews created deployment.apps/reviews-v1 created deployment.apps/reviews-v2 created deployment.apps/reviews-v3 created service/productpage created serviceaccount/bookinfo-productpage created deployment.apps/productpage-v1 created
This command launches all four services along with all three versions of the reviews service. Confirm they’re running:
$ kubectl get po,svc
NAME                                 READY   STATUS    RESTARTS   AGE
pod/details-v1-7d775cb4f6-4xn6n      2/2     Running   0          17m
pod/productpage-v1-7c4b6b857-ncm58   2/2     Running   0          17m
pod/ratings-v1-5b896f8544-54mf6      2/2     Running   0          17m
pod/reviews-v1-746f96c9d4-rn7xk      2/2     Running   0          17m
pod/reviews-v2-97bdf5876-fgs72       2/2     Running   0          17m
pod/reviews-v3-77d9db6844-t5rwl      2/2     Running   0          17m

NAME                  TYPE        CLUSTER-IP       EXTERNAL-IP   PORT(S)    AGE
service/details       ClusterIP   10.245.29.228    <none>        9080/TCP   17m
service/productpage   ClusterIP   10.245.212.66    <none>        9080/TCP   17m
service/ratings       ClusterIP   10.245.225.182   <none>        9080/TCP   17m
service/reviews       ClusterIP   10.245.207.220   <none>        9080/TCP   17m
Validate that the app is running inside the cluster by checking for the page title in the response:
kubectl exec "$(kubectl get pod -l app=ratings -o jsonpath='{.items[0].metadata.name}')" -c ratings -- curl -sS productpage:9080/productpage | grep -o "<title>.*</title>"
Step 2: Expose the Bookinfo App to External Traffic
The Bookinfo application is deployed, but not accessible from the outside. To make it accessible, you need to create an ingress gateway, which maps a path to a route at the edge of your mesh.
Create a Kubernetes Gateway for the Bookinfo application:
kubectl apply -f samples/bookinfo/gateway-api/bookinfo-gateway.yamlgateway.gateway.networking.k8s.io/bookinfo-gateway created httproute.gateway.networking.k8s.io/bookinfo created
By default, Istio creates a
LoadBalancerservice for a gateway. As we will access this gateway by a tunnel, we don’t need a load balancer. If you want to learn about how load balancers are configured for external IP addresses, read the ingress gateways documentation.Change the service type to
ClusterIPby annotating the gateway:kubectl annotate gateway bookinfo-gateway networking.istio.io/service-type=ClusterIP --namespace=defaultTo check the status of the gateway, run:
 kubectl get gateway
 NAME               CLASS   ADDRESS                                            PROGRAMMED   AGE
 bookinfo-gateway   istio   bookinfo-gateway-istio.default.svc.cluster.local   True         42s
Access the application
You will connect to the Bookinfo productpage service through the gateway you just provisioned. To access the gateway, you need to use the kubectl port-forward command:
kubectl port-forward svc/bookinfo-gateway-istio 8080:80
Open your browser and navigate to http://localhost:8080/productpage to view the Bookinfo application.
OR
kubectl port-forward svc/bookinfo-gateway-istio 8080:80 --address 0.0.0.0
Open your browser and navigate to http://<Public-IP -Of-server>:8080/productpage to view the Bookinfo application.
If you refresh the page, you should see the book reviews and ratings changing as the requests are distributed across the different versions of the reviews service.
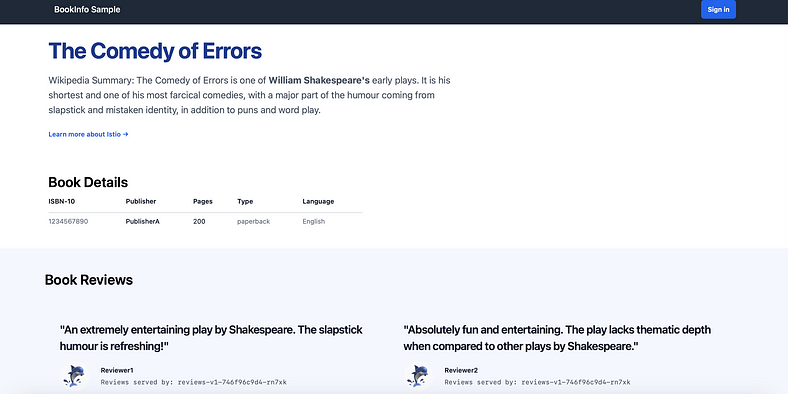
Book Info example
With Istio and the Bookinfo app deployed, you now have a powerful setup to explore Istio’s traffic routing, security, and observability features in a hands-on way. From managing traffic between different versions to collecting real-time metrics, you can use Istio to effectively control and monitor your microservices!
Viewing the Dashboard: Monitor Your Service Mesh with Telemetry Tools
Once the Bookinfo application is up and running, you can access Istio’s telemetry tools to gain insights into your service mesh’s health, structure, and traffic flows.
Istio integrates with several different telemetry applications. These can help you gain an understanding of the structure of your service mesh, display the topology of the mesh, and analyze the health of your mesh.
- Deploy Kiali and other telemetry addons:
To deploy Kiali along with Prometheus, Grafana, and Jaeger, use the following command:
kubectl apply -f samples/addons
2. Verify Kiali Deployment:
Wait for the Kiali deployment to finish:
kubectl rollout status deployment/kiali -n istio-system
You should see a message like this once Kiali is successfully deployed:
Waiting for deployment "kiali" rollout to finish: 0 of 1 updated replicas are available...
deployment "kiali" successfully rolled out
3. Access the Kiali Dashboard:
Open the Kiali dashboard to visualize your service mesh by running:
istioctl dashboard kiali
If you find any error like, Istioctl not found, then run the following command:
curl -sL https://istio.io/downloadIstioctl | sh -
export PATH=$HOME/.istioctl/bin:$PATH
This command will open the Kiali dashboard in your default browser.
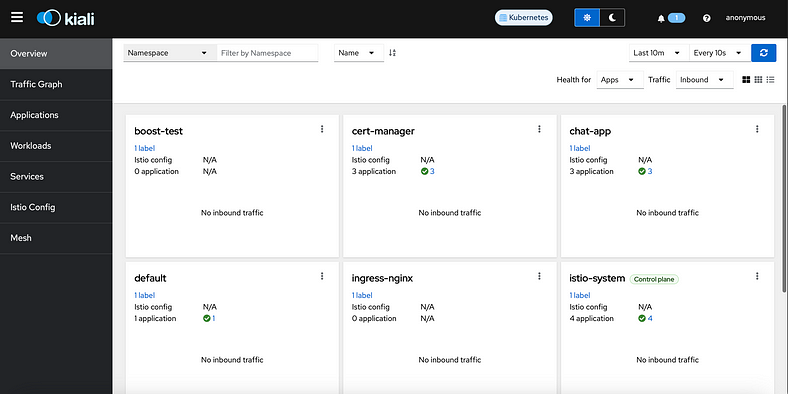
4. Explore the Kiali Graph:
In the Kiali dashboard, navigate to Traffic Graph from the left menu.
Select isstio-test from the Namespace dropdown to view the structure and relationships between services in the Bookinfo application.
You can visualize traffic flow, error rates, and latency metrics in real-time, helping you analyze and monitor service dependencies and health.
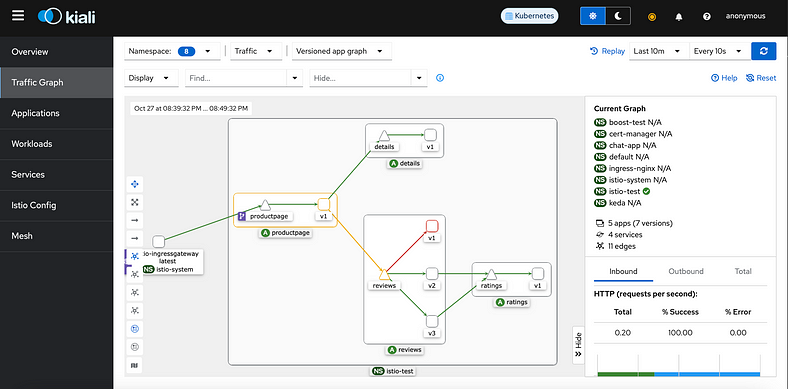
The Kiali dashboard shows an overview of your mesh with the relationships between the services in the Bookinfo sample application. It also provides filters to visualize the traffic flow.
Additional Dashboards: Prometheus, Grafana, and Jaeger
In addition to Kiali, Istio provides integration with Prometheus, Grafana, and Jaeger to give a comprehensive view of your service mesh:
Prometheus: Use Prometheus to monitor Istio metrics and capture key performance indicators (KPIs) for the services and mesh.
Grafana: Grafana dashboards visualize metrics gathered by Prometheus, with options like the Mesh Dashboard for an overview or the Service Dashboard for detailed service metrics.
Jaeger: Jaeger provides distributed tracing to help troubleshoot latency issues and track the flow of requests across services.
These tools can be accessed from the istioctl command as well:
Grafana:
istioctl dashboard grafanaPrometheus:
istioctl dashboard prometheusJaeger:
istioctl dashboard jaeger
$ kubectl get po,svc -n istio-system
NAME                                        READY   STATUS    RESTARTS   AGE
pod/grafana-f459cd95-895tw                  1/1     Running   0          4h55m
pod/istio-ingressgateway-85bddc5cb8-mddfz   1/1     Running   0          5h3m
pod/istiod-8c4cd4448-xpjjd                  1/1     Running   0          5h3m
pod/jaeger-54c44d879f-v7xw5                 1/1     Running   0          4h55m
pod/kiali-5bc5879b57-8rjqr                  1/1     Running   0          4h55m
pod/loki-0                                  1/1     Running   0          4h55m
pod/prometheus-84676b8788-2jfdv             2/2     Running   0          4h55m

NAME                           TYPE           CLUSTER-IP       EXTERNAL-IP     PORT(S)                                          AGE
service/grafana                ClusterIP      10.245.127.48    <none>          3000/TCP                                         4h55m
service/istio-ingressgateway   LoadBalancer   10.245.224.34    209.38.50.117   15021:31189/TCP,80:31351/TCP,443:30851/TCP       5h3m
service/istiod                 ClusterIP      10.245.184.152   <none>          15010/TCP,15012/TCP,443/TCP,15014/TCP            5h3m
service/jaeger-collector       ClusterIP      10.245.29.221    <none>          14268/TCP,14250/TCP,9411/TCP,4317/TCP,4318/TCP   4h55m
service/kiali                  ClusterIP      10.245.254.224   <none>          20001/TCP,9090/TCP                               4h55m
service/loki                   ClusterIP      10.245.129.40    <none>          3100/TCP,9095/TCP                                4h55m
service/loki-headless          ClusterIP      None             <none>          3100/TCP                                         4h55m
service/loki-memberlist        ClusterIP      None             <none>          7946/TCP                                         4h55m
service/prometheus             ClusterIP      10.245.13.126    <none>          9090/TCP                                         4h55m
service/tracing                ClusterIP      10.245.17.140    <none>          80/TCP,16685/TCP                                 4h55m
service/zipkin                 ClusterIP      10.245.5.239     <none>          9411/TCP                                         4h55m
Source Code
You’re invited to explore our GitHub repository, which houses a comprehensive collection of source code for Kubernetes.
Also, if we welcome your feedback and suggestions! If you encounter any issues or have ideas for improvements, please open an issue on our GitHub repository. 🚀
Connect With Me
If you found this blog insightful and are eager to delve deeper into topics like AWS, cloud strategies, Kubernetes, or anything related, I’m excited to connect with you on LinkedIn. Let’s spark meaningful conversations, share insights, and explore the vast realm of cloud computing together.
Feel free to reach out, share your thoughts, or ask any questions. I look forward to connecting and growing together in this dynamic field!
My LinkedIn: https://www.linkedin.com/in/harshitsahu2311
My GitHub: https://github.com/harshitsahu2311
Happy deploying! 🚀
Happy Kubernetings! ⎈
Subscribe to my newsletter
Read articles from Harshit Sahu directly inside your inbox. Subscribe to the newsletter, and don't miss out.
Written by
Harshit Sahu
Harshit Sahu
Enthusiastic about DevOps tools like Docker, Kubernetes, Maven, Nagios, Chef, and Ansible and currently learning and gaining experience by doing some hands-on projects on these tools. Also, started learning about AWS and GCP (Cloud Computing Platforms).