Deep Dive into Real-Time Log Monitoring on Linux with journalctl -f
 Lightning Developer
System administrators and developers working with systemd-based Linux distributions often rely on logs to debug issues and monitor service health. One of the most efficient tools for live log streaming is journalctl, a native part of systemd. With the -f (follow) flag, it provides a powerful and flexible way to monitor logs in real time—far beyond what tail -f can do.
In this article, we explore how to effectively use journalctl -f for live log monitoring, with practical use cases, service-specific tracking, advanced filtering, and even methods for integrating logs into visual dashboards like Grafana.
Basic Real-Time Log Streaming
To start live log monitoring, use:
journalctl -f
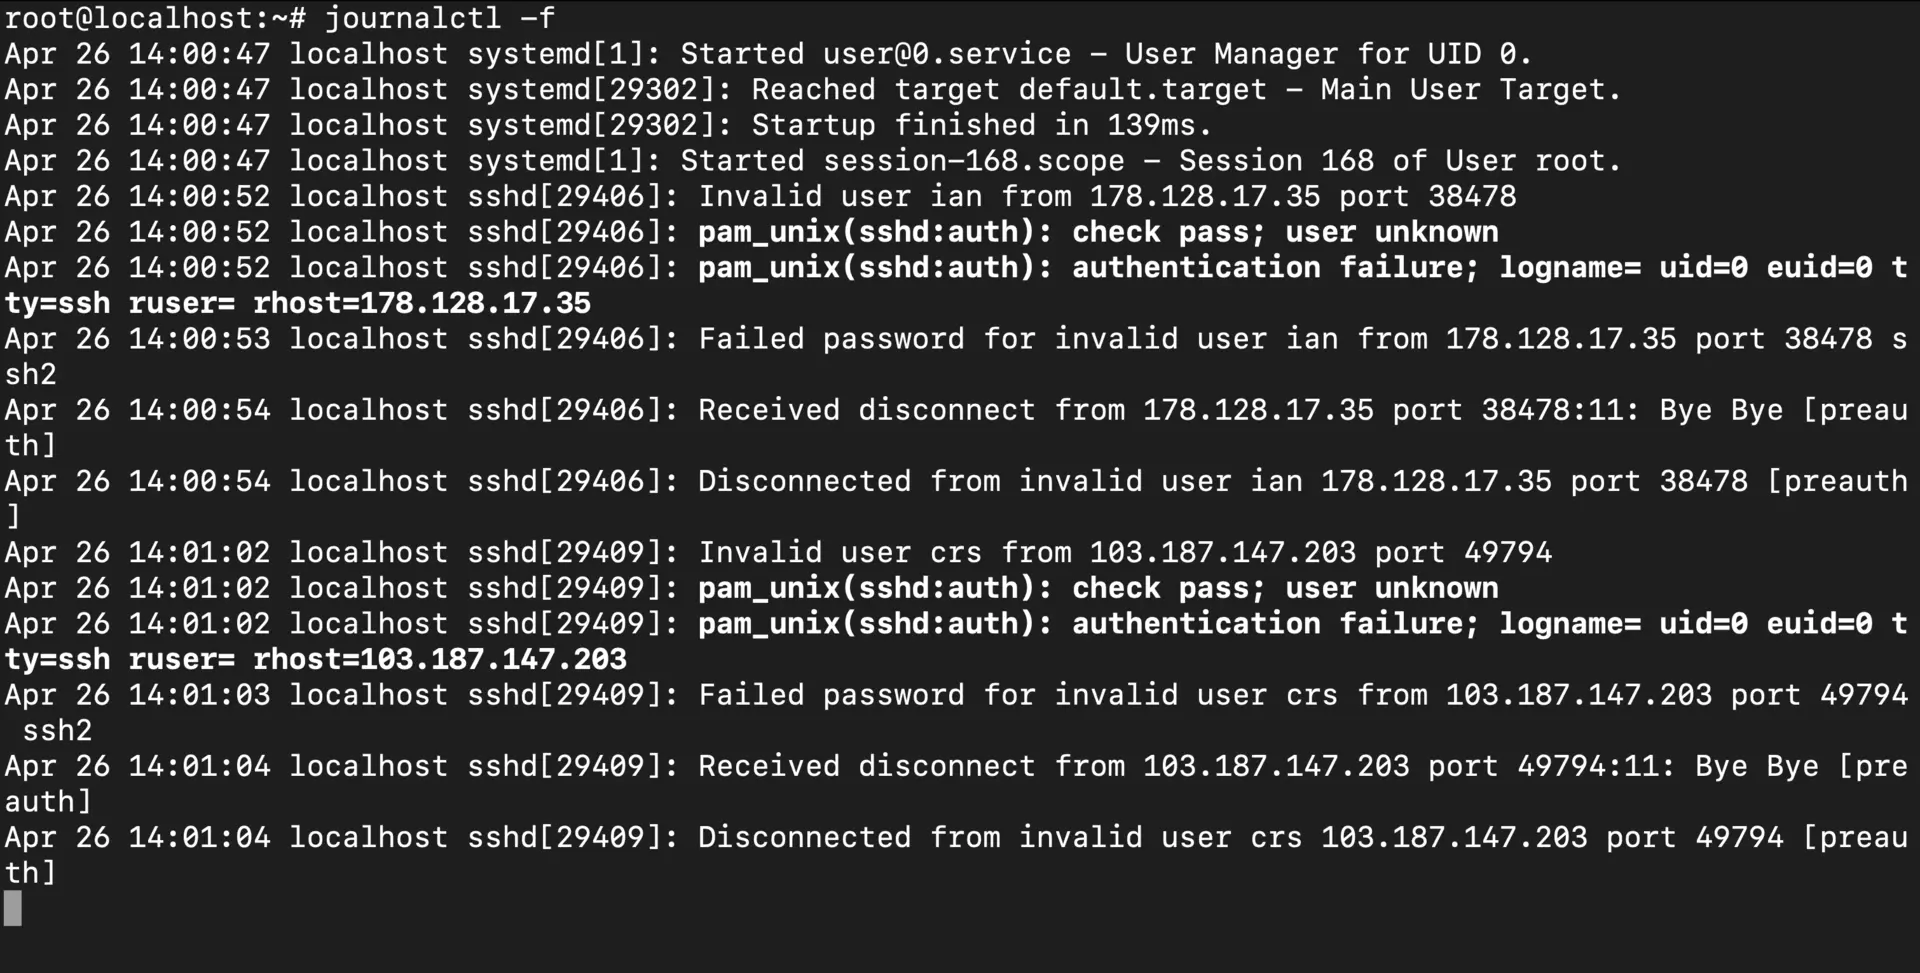
This streams log entries as they are written, making it ideal for observing real-time system behavior during updates, restarts, or errors. Press Ctrl+C to stop the stream.
Monitoring Specific Services
To narrow the focus, you can watch logs for a particular service:
journalctl -u <service-name> -f
Examples:
journalctl -u ssh -f         # Monitor SSH
journalctl -u nginx -f       # Monitor Nginx
journalctl -u my-app.service -f  # Monitor a custom application
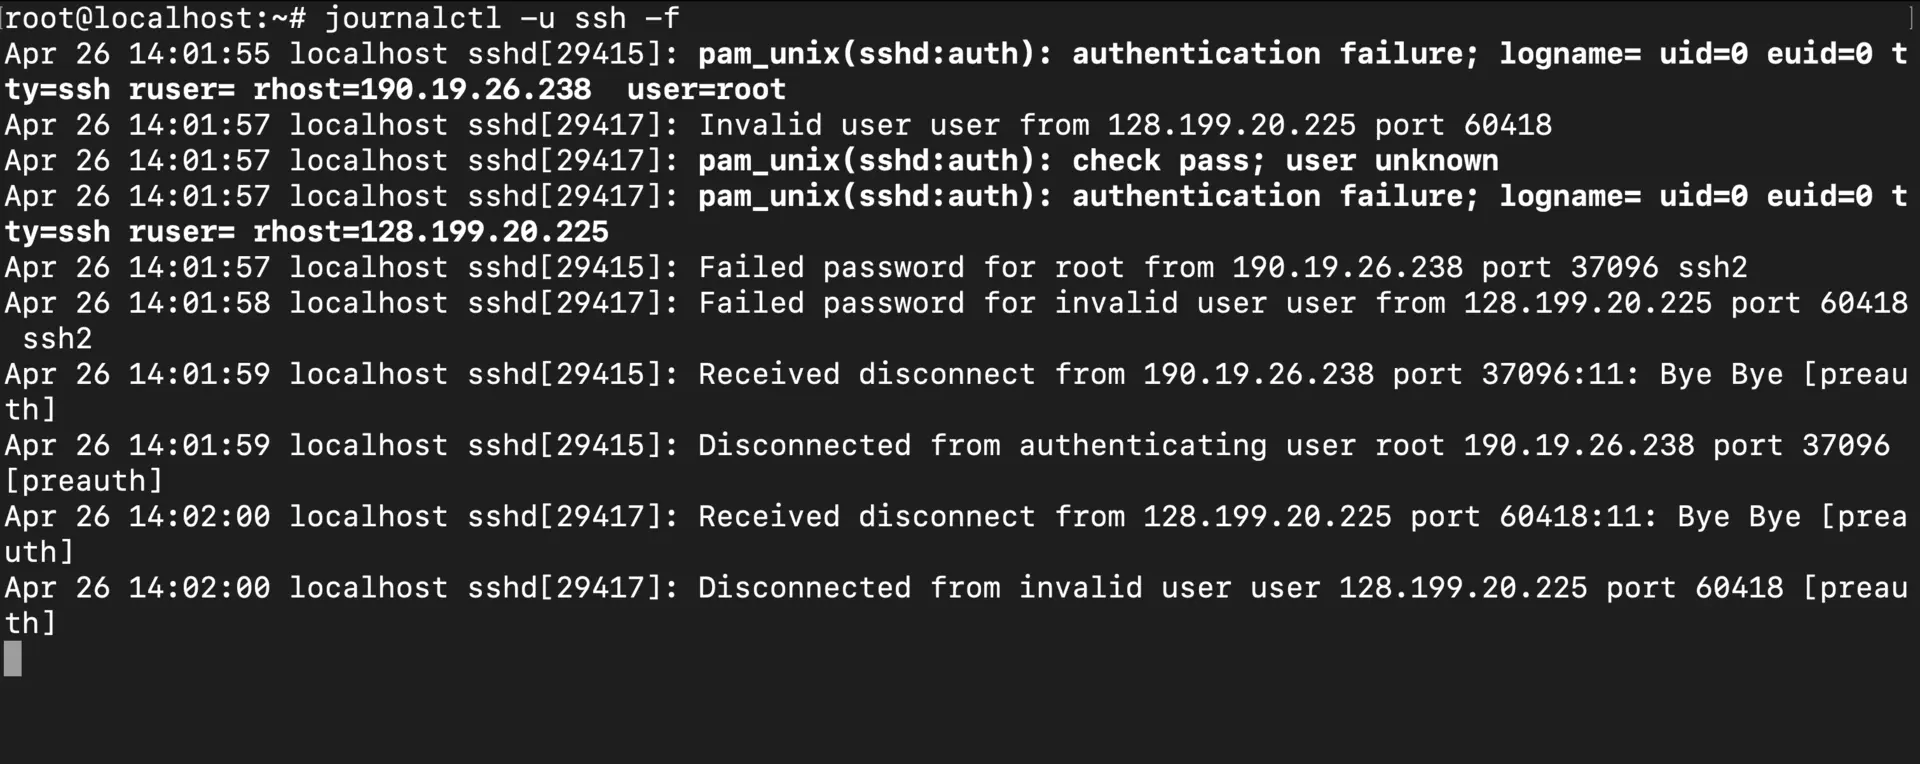
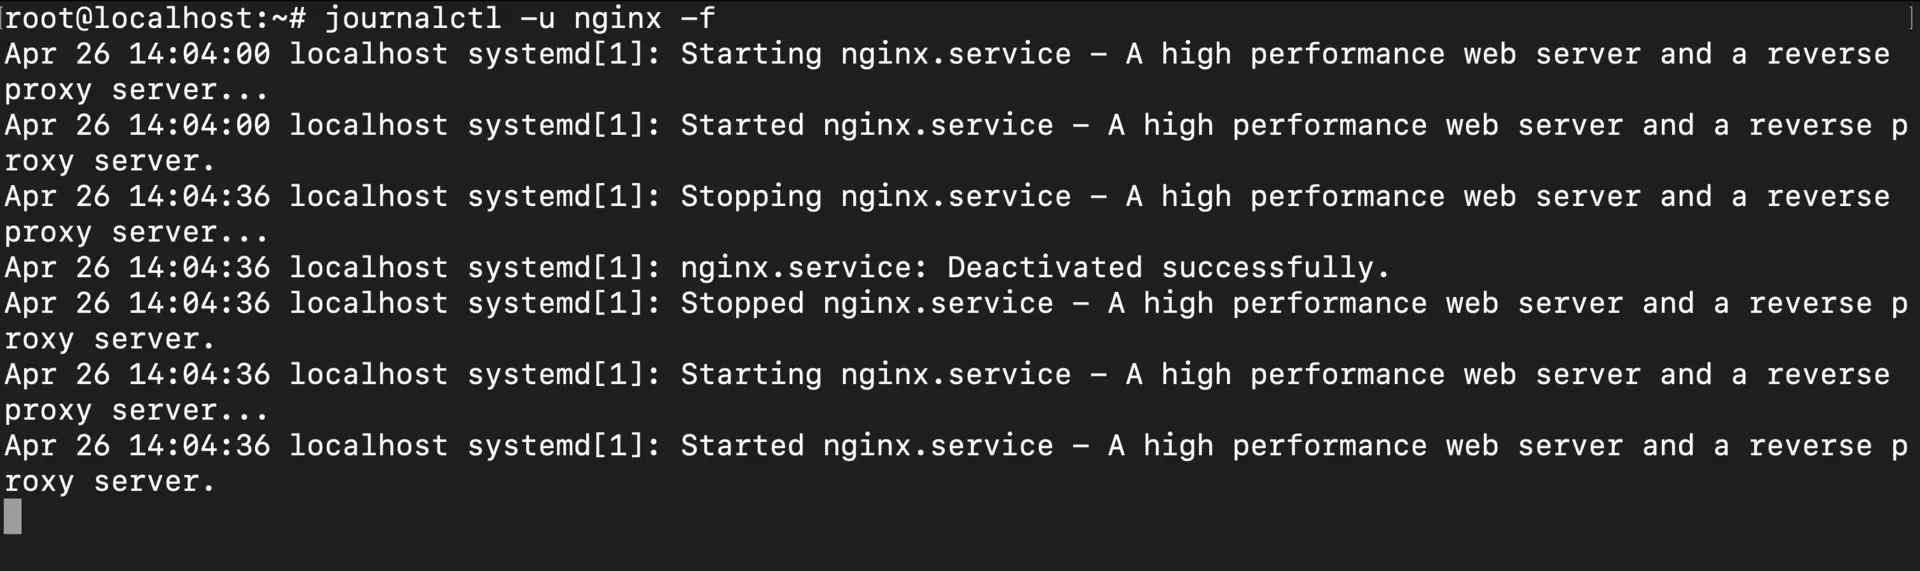
This is especially useful when debugging a failing deployment or observing how a service behaves over time.
Filter Logs by Priority and Time
Focus on critical events by filtering logs by severity:
journalctl -f -p err # Show only error-level logs
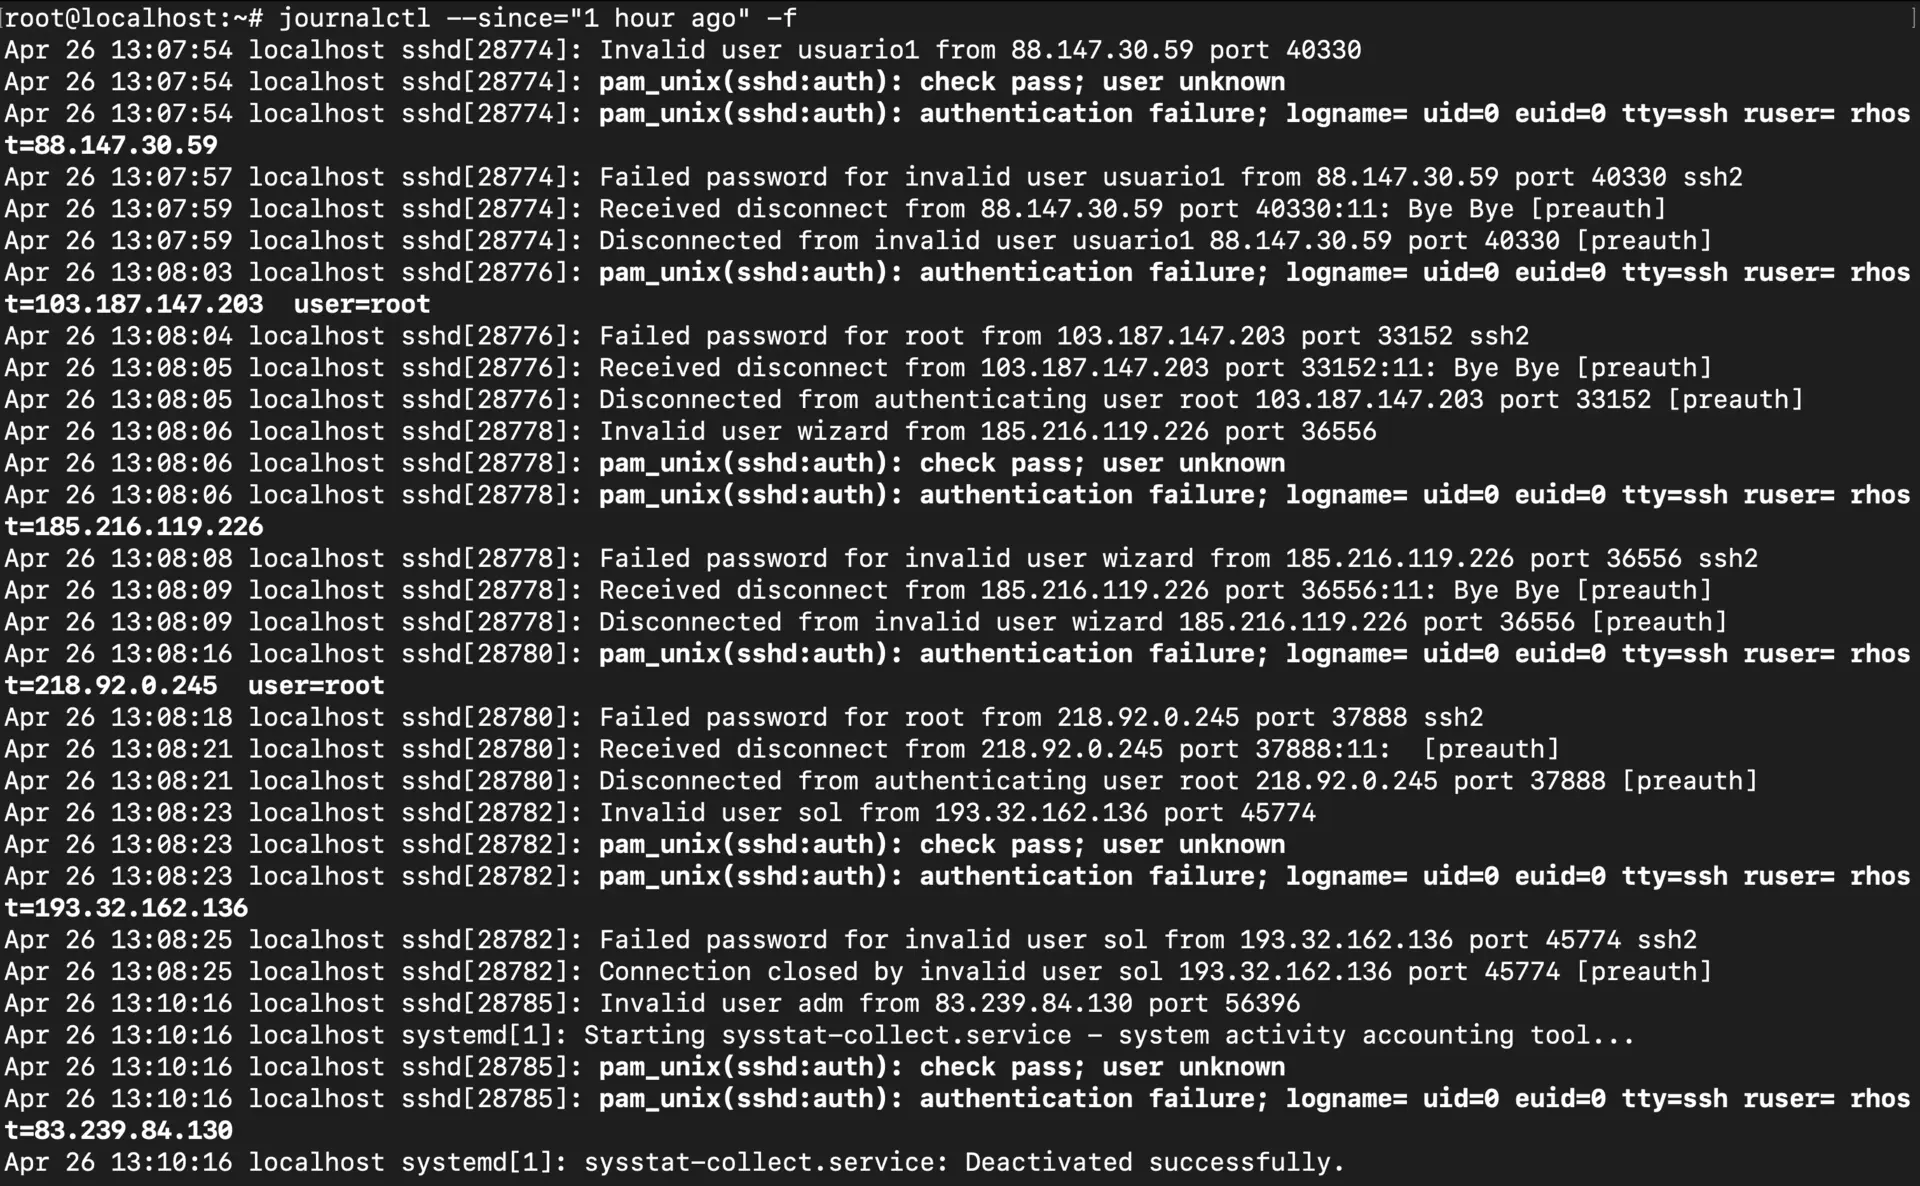
Or filter by time:
journalctl --since="1 hour ago" -f # Logs from the last hour
journalctl --since=boot -f # Logs since the last system boot
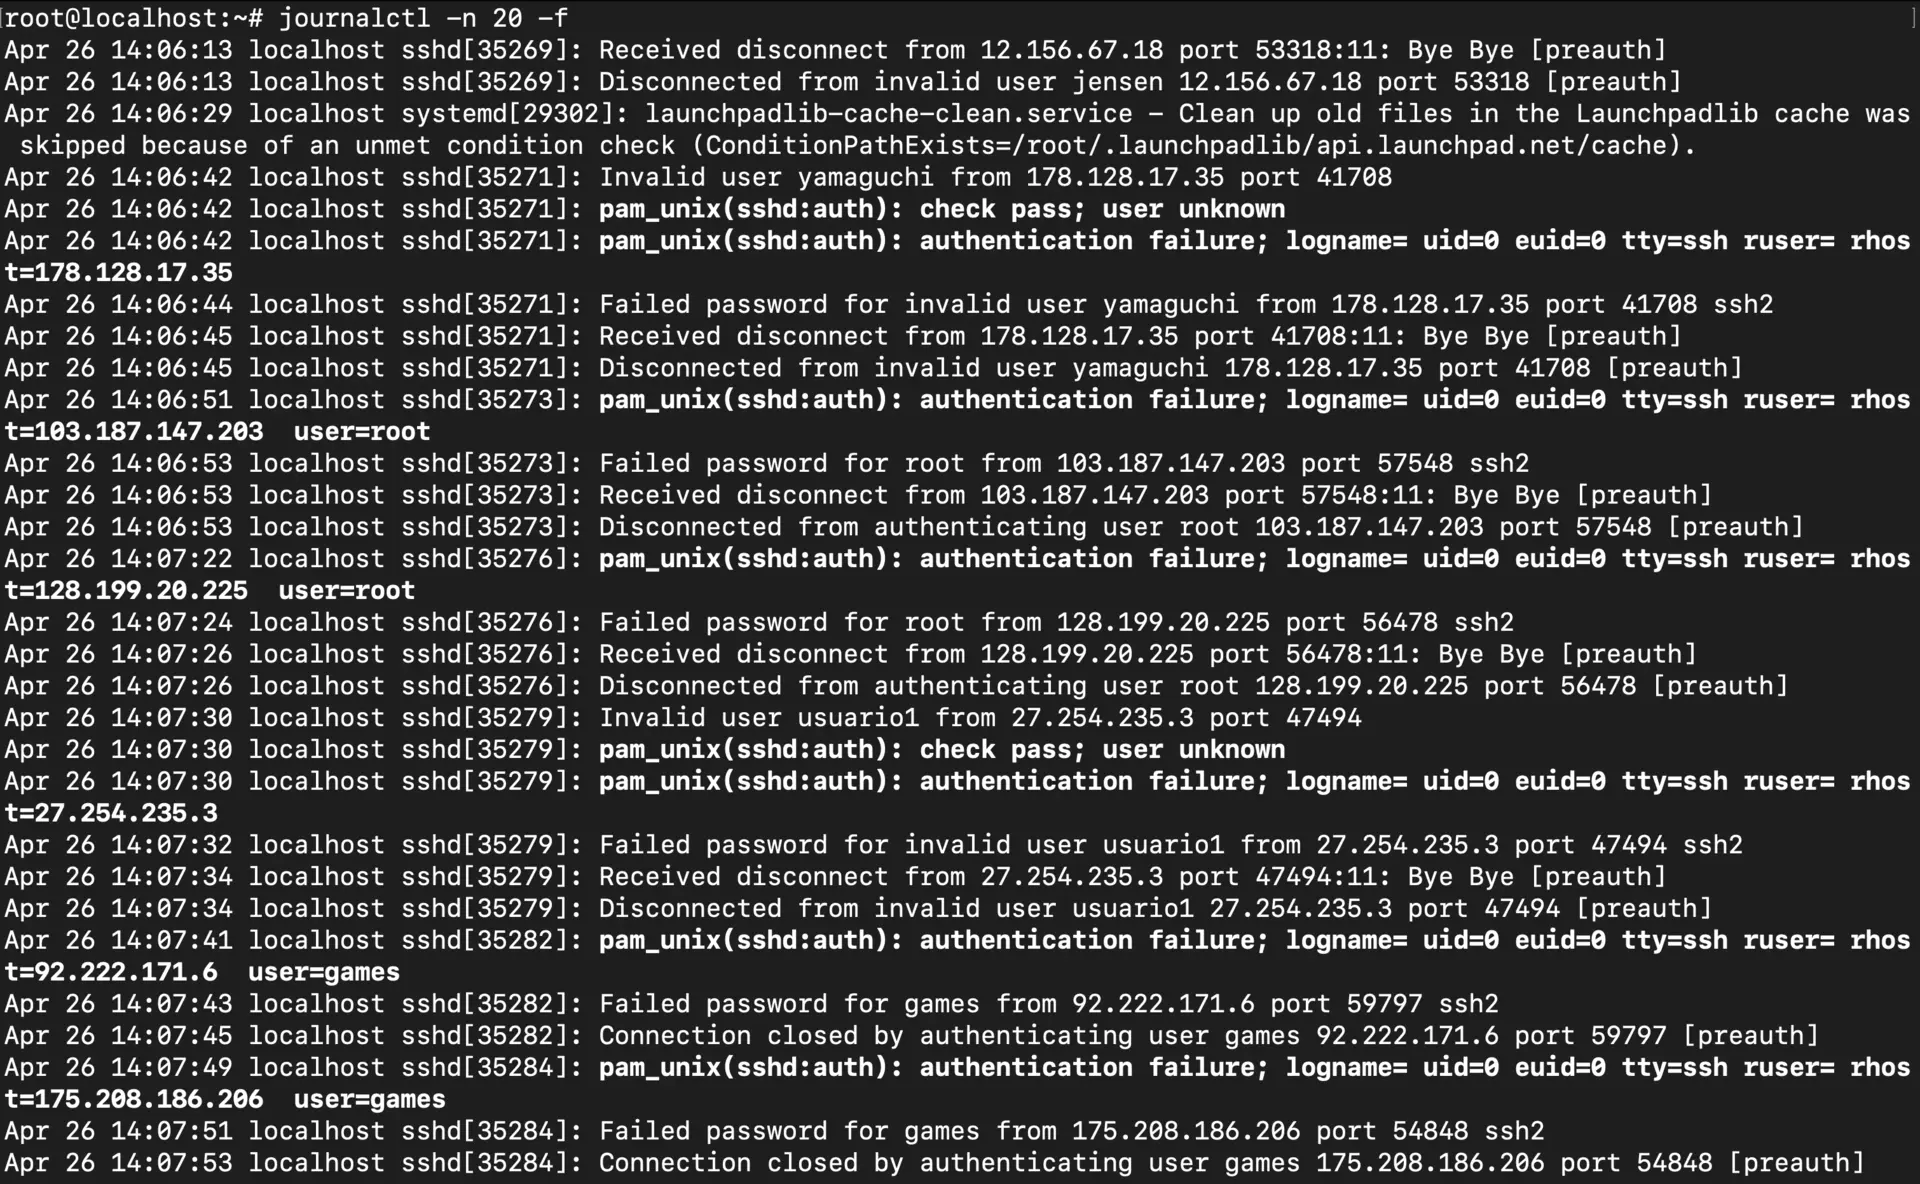
journalctl -n 20 -f # Show last 20 entries, then stream live
Combine filters for precise log monitoring:
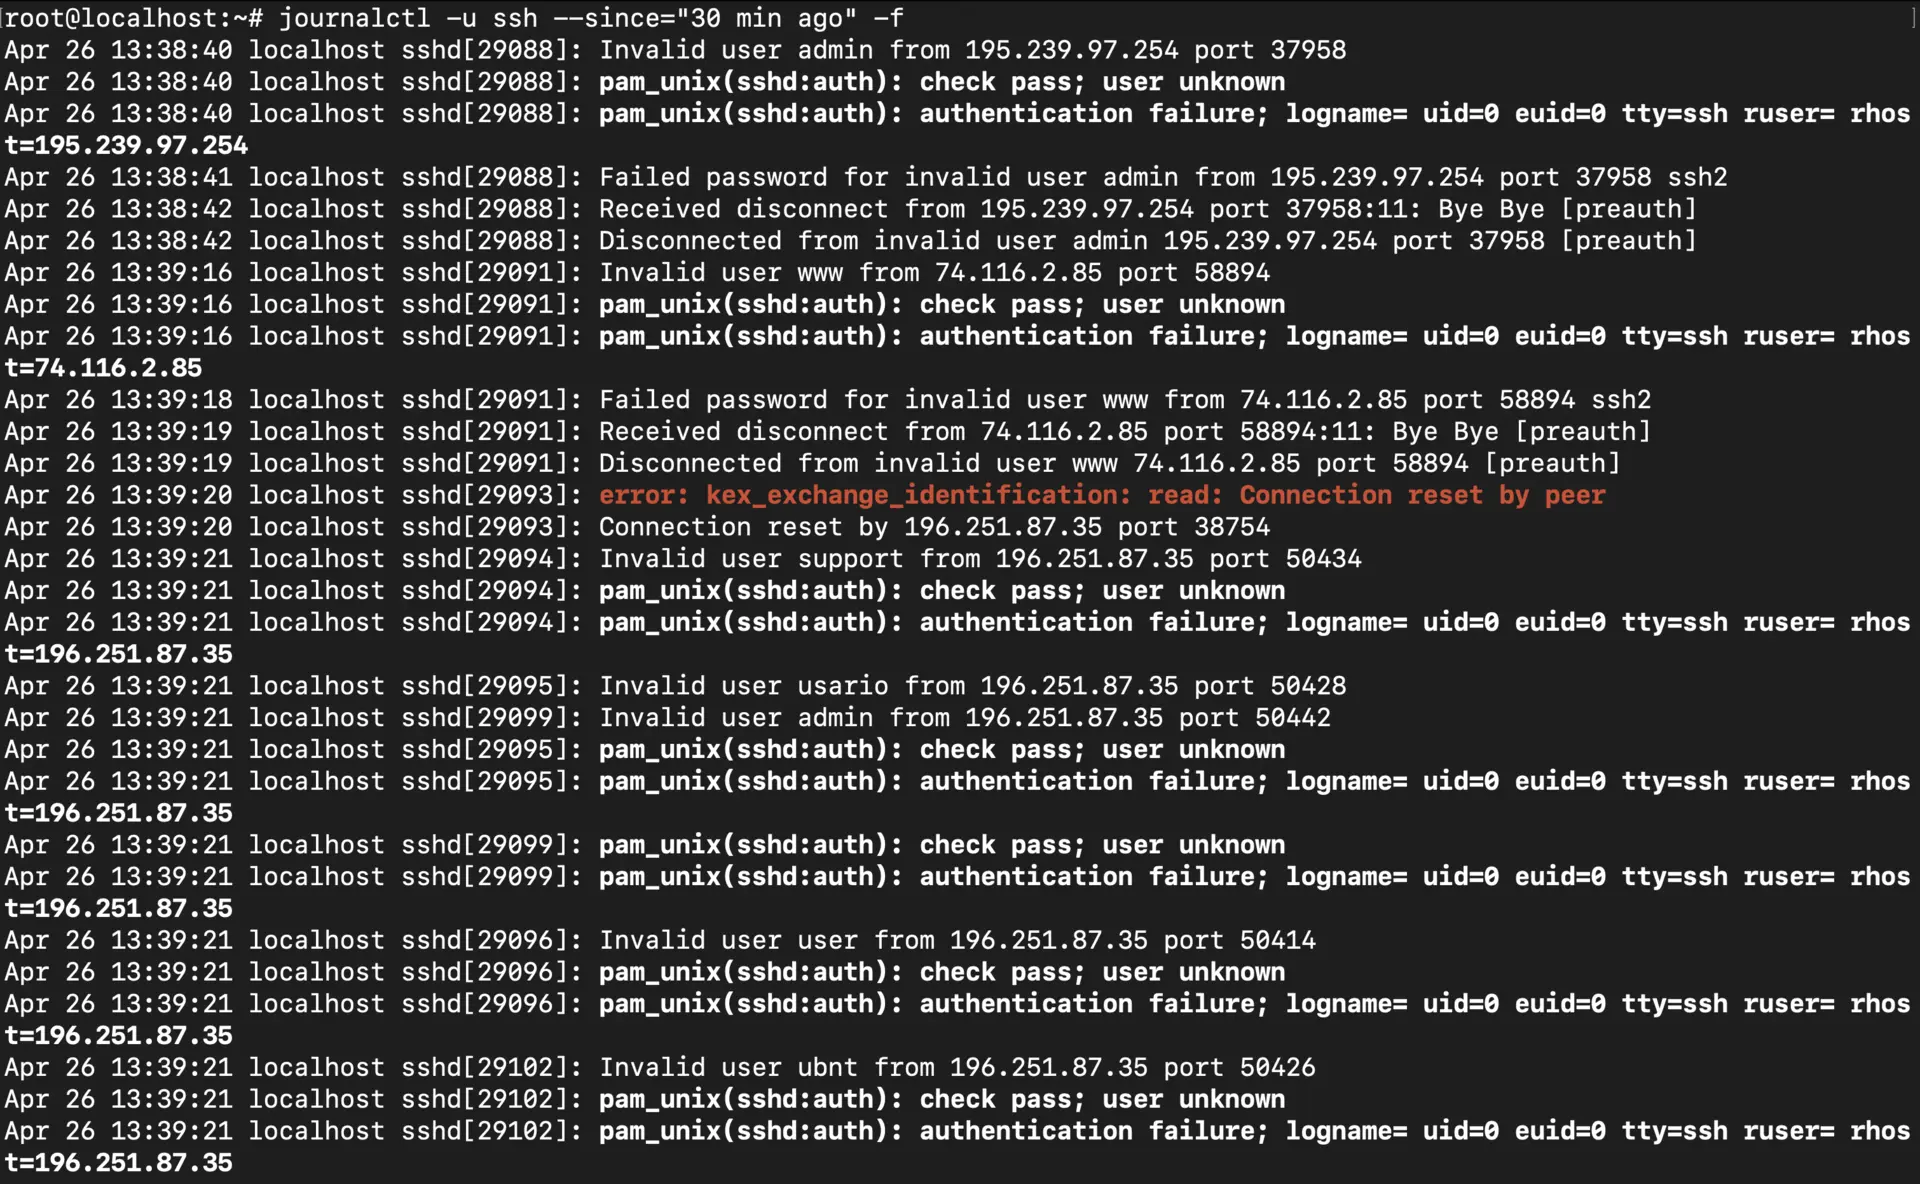
journalctl -u ssh --since="30 min ago" -f
Advanced Filtering and Text Highlighting
To spot critical messages quickly, pipe the output through grep:
journalctl -f | grep --color "error"
journalctl -f | grep --color -E "error|critical|warning"
journalctl -f | grep --color -A 2 -B 2 "failed"  # Show context
journalctl -f | grep --color -v "heartbeat"      # Exclude noisy logs
These techniques are great for spotting security issues, like:
journalctl -f | grep --color -E "Failed password|invalid user|authentication failure"
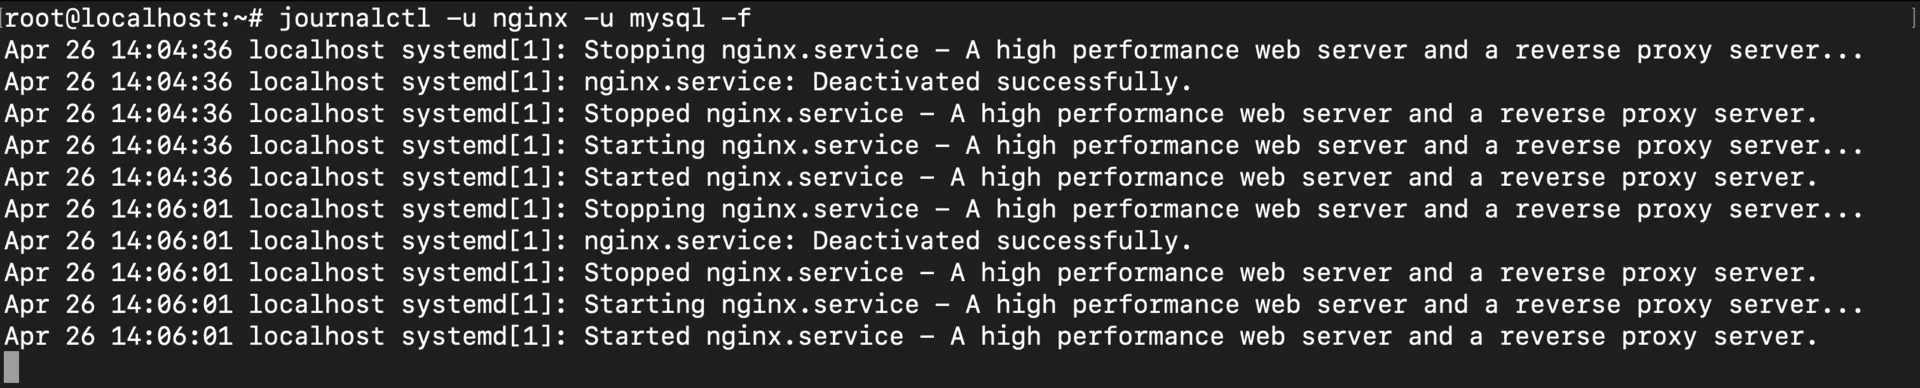
Monitoring Multiple Services
You can monitor multiple services at once:
journalctl -u nginx -u mysql -f
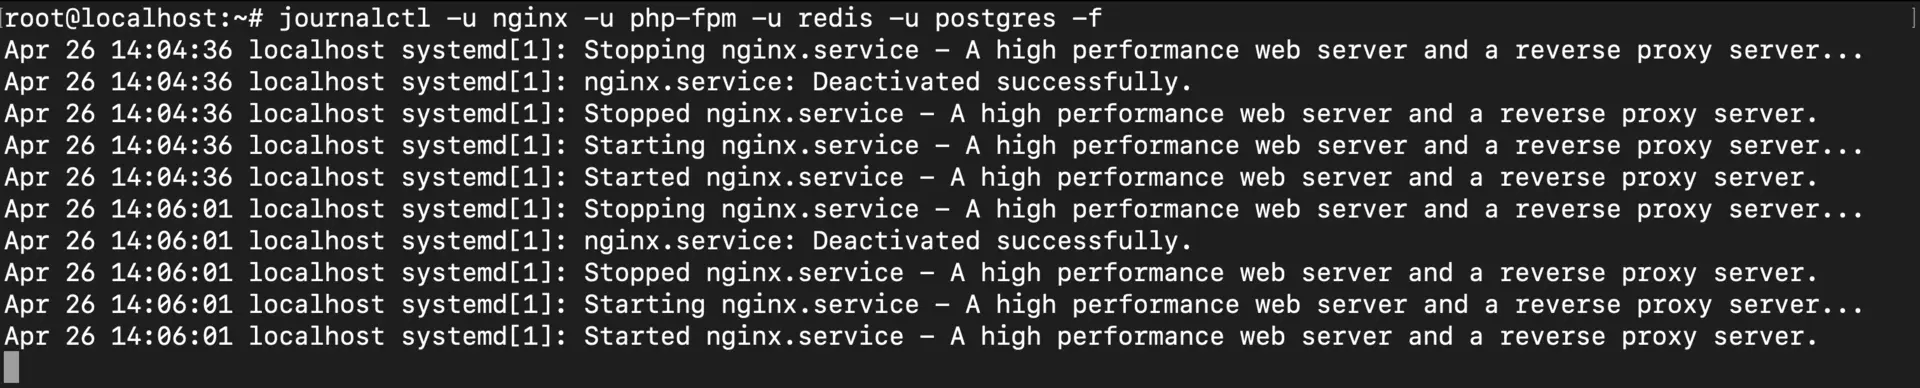
journalctl -u nginx -u php-fpm -u redis -u postgres -f
To match services by wildcard (e.g., all Apache units):
journalctl -f _SYSTEMD_UNIT=apache*
Output Formatting and JSON for Tool Integration
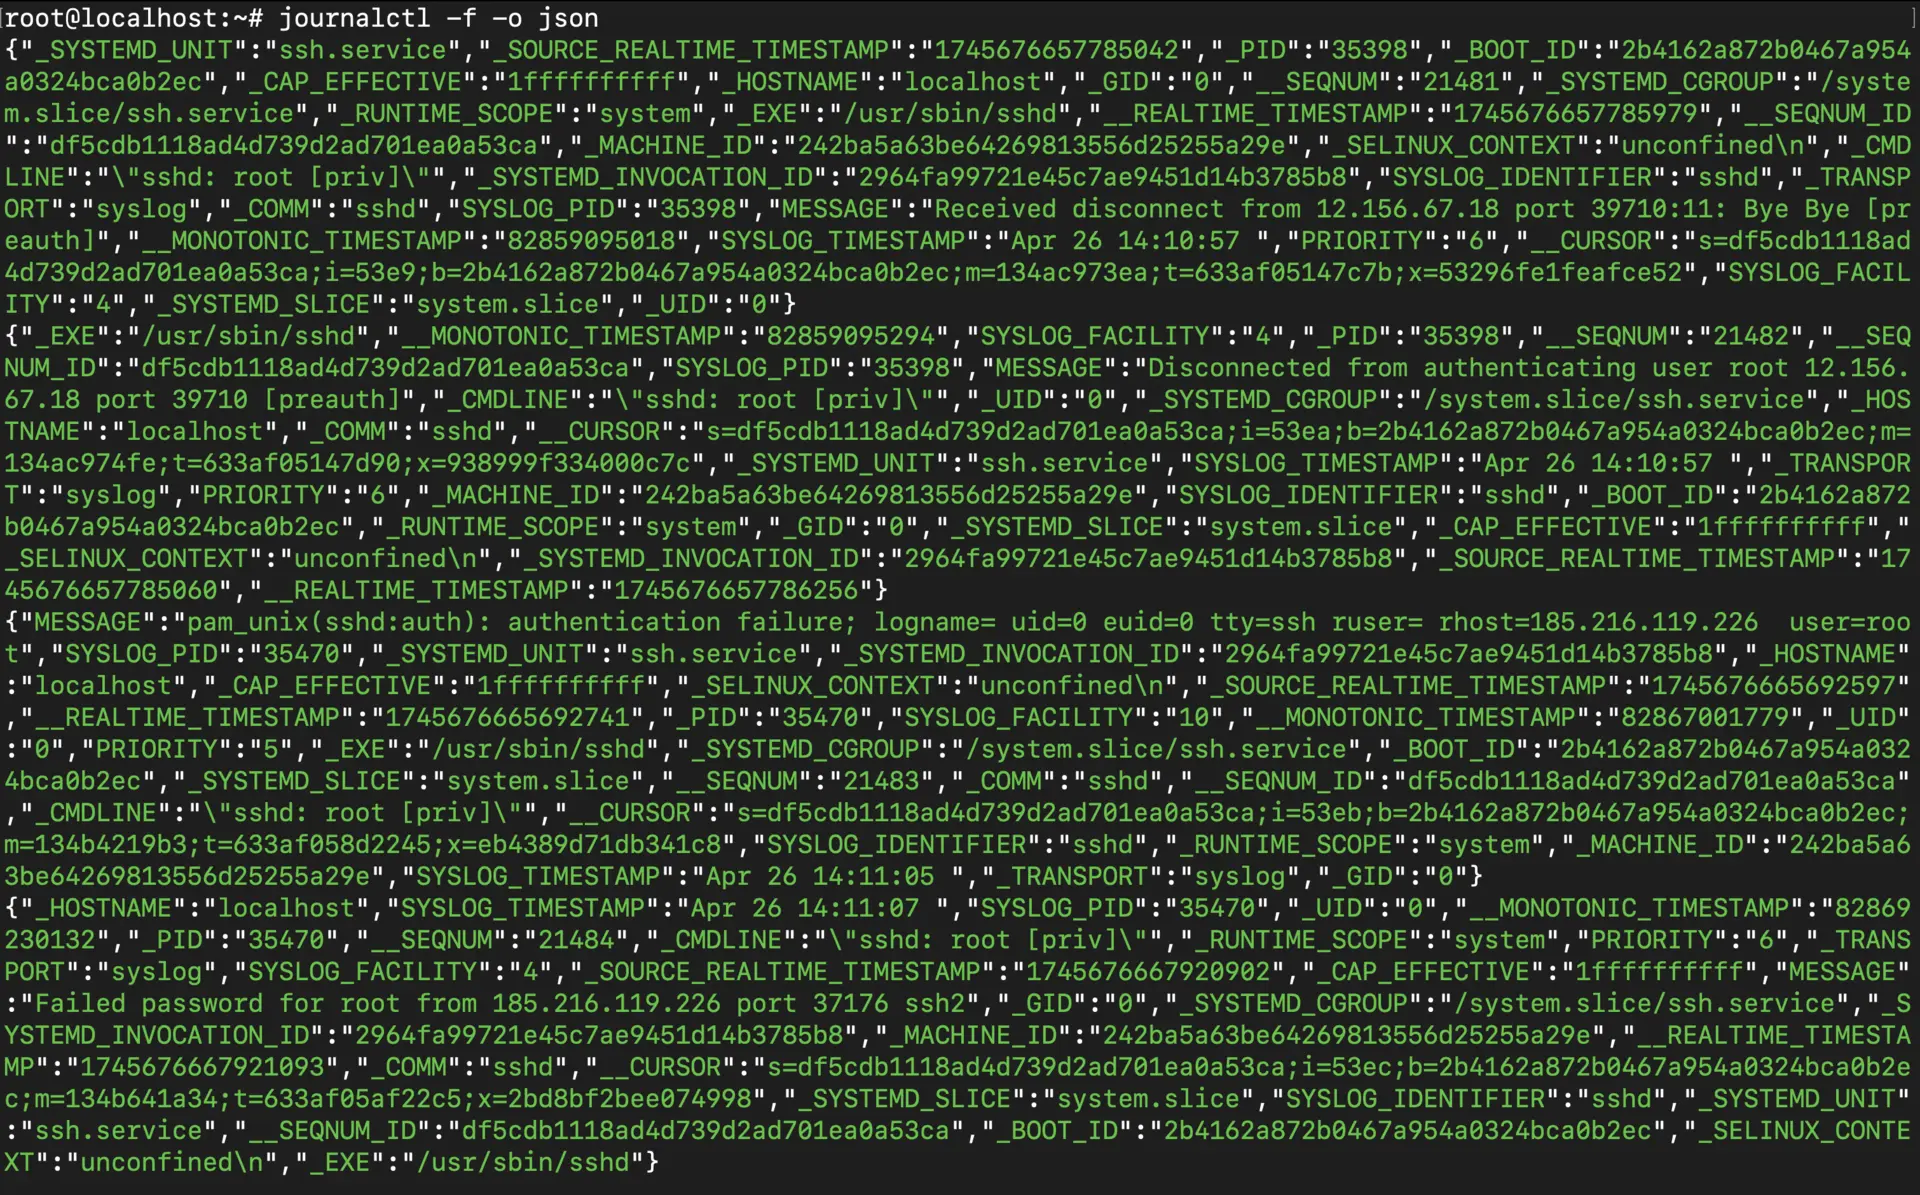
For automation or integration with log-processing tools, output logs in JSON:
journalctl -f -o json
Parse structured output with jq:
journalctl -f -o json | jq 'select(.PRIORITY=="3") | {time: ._SOURCE_REALTIME_TIMESTAMP, msg: .MESSAGE}'
Other formats include:
Verbose:
-o verboseISO time:
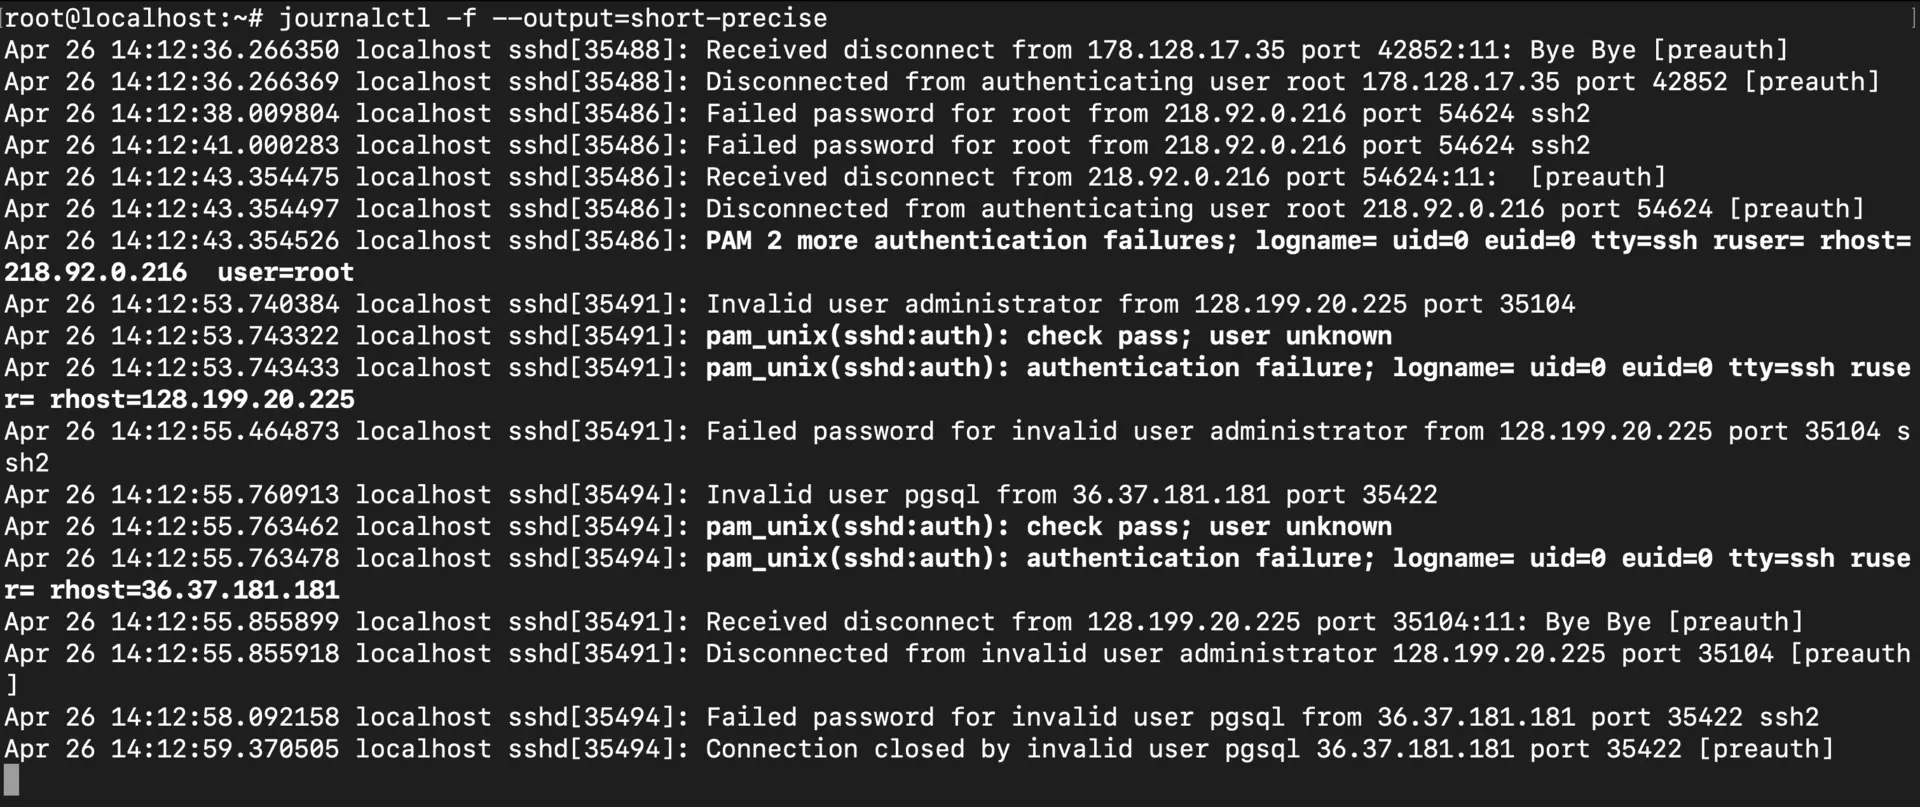
--output=short-isoMessage only:
-o cat
Visualizing Logs with Dashboards
Terminal-based monitoring is great for immediate debugging, but long-term analysis benefits from visualization tools. Here’s how to stream journalctl logs into popular dashboards:
Grafana Loki with Promtail
Configure Promtail to send logs:
server:
  http_listen_port: 9080
positions:
  filename: /var/lib/promtail/positions.yaml
clients:
  - url: http://loki:3100/loki/api/v1/push
scrape_configs:
  - job_name: journal
    journal:
      max_age: 12h
      labels:
        job: systemd-journal
    relabel_configs:
      - source_labels: ['__journal__systemd_unit']
        target_label: 'unit'
Datadog
Configure the Datadog agent:
logs:
  - type: journald
    service: "journald"
    source: "systemd"
New Relic
Enable journald log collection through New Relic’s infrastructure agent setup.
Color-Coding and Terminal Visualization
Improve readability with color coding:
journalctl -u nginx -u mysql -f | \
grep --color=always -E 'nginx|mysql|$' | \
sed 's/nginx/\x1b[36mnginx\x1b[0m/g; s/mysql/\x1b[33mmysql\x1b[0m/g'
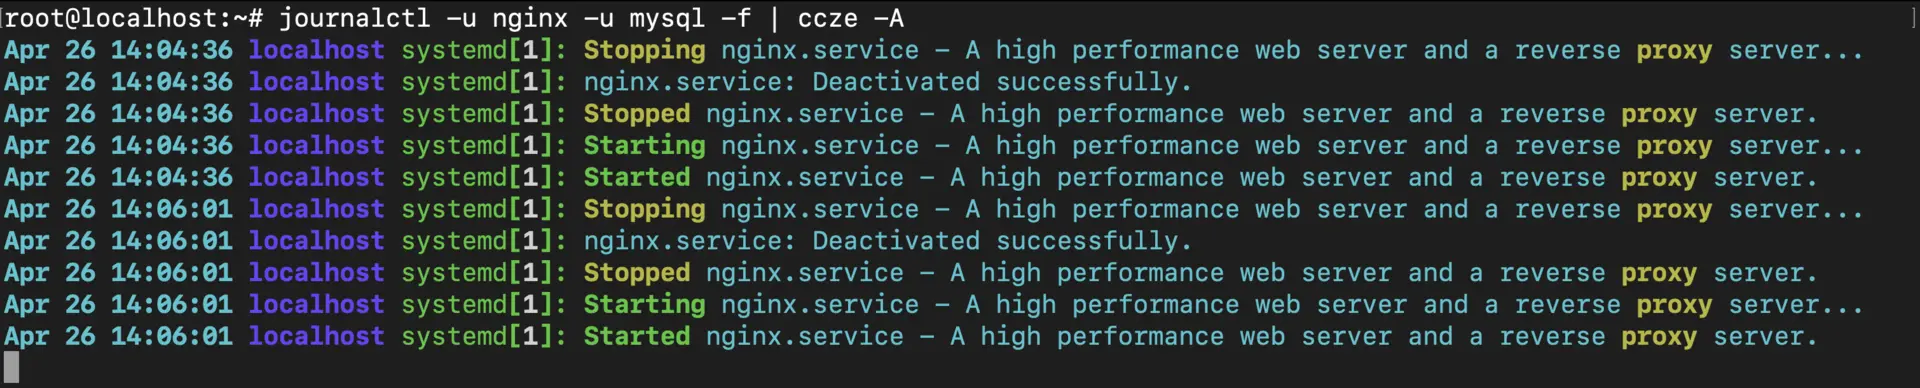
Or use ccze for ANSI-colored logs:
sudo apt install ccze
journalctl -f | ccze -A
Conclusion
Mastering journalctl -f empowers Linux users to maintain real-time visibility over critical system processes. With options for targeted monitoring, rich filtering, structured output, and third-party dashboard integration, journalctl is more than a log viewer—it's a full-fledged monitoring utility.
Whether you're responding to failures, tracking service restarts, or simply ensuring system health, journalctl -f is a must-have tool in your Linux toolbox.
References
Subscribe to my newsletter
Read articles from Lightning Developer directly inside your inbox. Subscribe to the newsletter, and don't miss out.
Written by