Mega Project Spotlight: Full-Stack DevSecOps Pipeline for EKS with GitHub Actions & Terraform
 Balraj Singh
Table of contents
- Executive Summary
- Tools & Technologies Used
- Project Architecture
- Prerequisites
- Key Points
- Step-by-Step Process
- Setting Up the Infrastructure
- Inspect the Cloud-Init logs:
- Verify the Installation on EC Terrabox-SVR
- Verify the EKS Cluster installation
- Verify GitHub Repo and GitHub Actions
- Adding a Virtual Machine as a Runner
- Setup SonarQube
- Configure Secrets and Variables in GitHub Repo.
- Attach Role to Runner EC2
- Writing the CI/CD Pipeline
- Verify the Docker Image
- Verify code coverage in SonarQube
- Verify pipeline Status
- Verify the pods status from runner VM
- Verify Application Status
- Setup ArgoCD
- Setup Monitoring using Prometheus/Grafana
- Setup Notification in Slack
- Final Status of Pipeline
- Environment Cleanup:
- Project Challenges
- Project Benefits
- Conclusion
Executive Summary
This project outlines a comprehensive end-to-end DevOps pipeline implementation reflecting real-world corporate workflows. The project demonstrates how to build a complete CI/CD pipeline using GitHub Actions, integrating code quality checks, container management, Kubernetes deployment, and monitoring solutions. The implementation follows industry best practices and provides a blueprint for modern application delivery workflows.
Tools & Technologies Used
Core Components:
- GitHub Actions: CI/CD pipeline orchestration
- Self-hosted Runner: Custom VM for pipeline execution
- Kubernetes: Self-managed cluster for application deployment
- Docker: Application containerization
- SonarQube: Code quality and security analysis
- Trivy: Container and filesystem vulnerability scanning
- GitLeaks: Detects hardcoded secrets in the source code.
- AWS CLI: Manages AWS resources.
- Terraform: Infrastructure as Code (IaC) for provisioning EKS clusters.
Monitoring Stack:
- Prometheus: Metrics collection and storage
- Grafana: Visualization and dashboarding
- Blackbox Exporter: External HTTP endpoint monitoring
- Node Exporter: System-level metrics collection
Infrastructure:
- AWS EC2: Virtual machine hosting
- Ubuntu 24.04: Base operating system
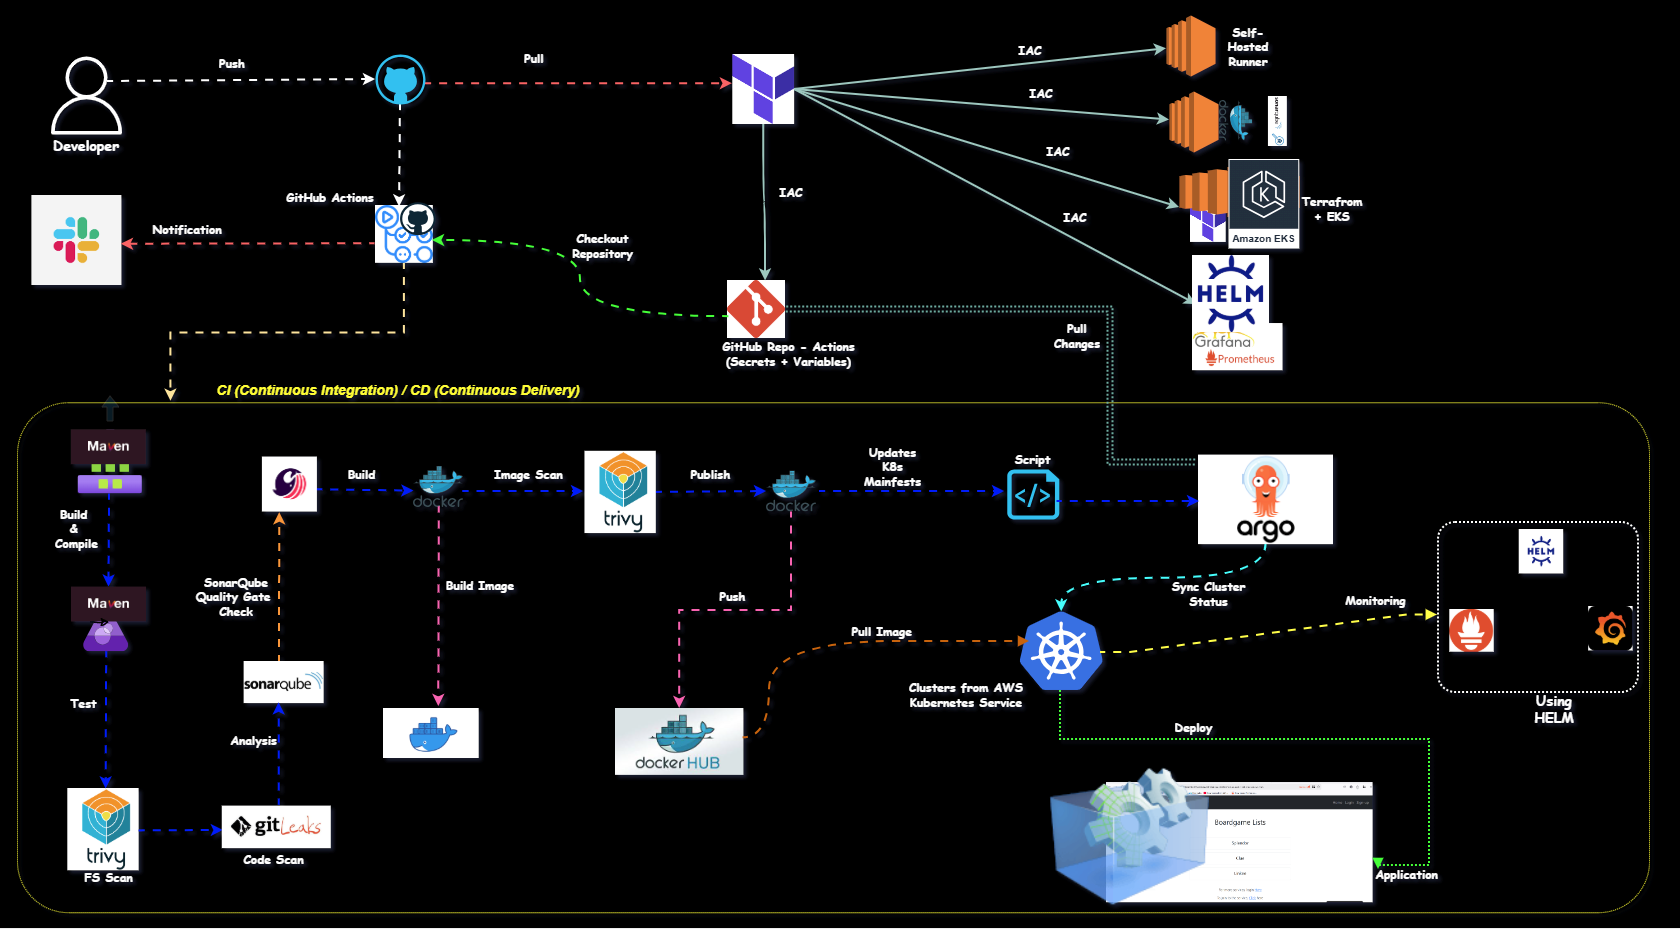
Project Architecture
Client Request → JIRA Ticket → Developer Implementation → GitHub Repository
     ↓
GitHub Actions Pipeline (Self-hosted Runner)
[Code Checkout → Build → Test → SonarQube Analysis → Artifact Creation →
 Docker Build → Trivy Scan → DockerHub Push → K8s Deployment]
     ↓
Kubernetes Cluster (Master/Worker) → Application Deployment
     ↓
Prometheus/Grafana Monitoring
Prerequisites
Before diving into this project, here are some skills and tools you should be familiar with:
- Terraform installed on your machine.
- A GitHub account.
- A GitHub personal access token with the necessary permissions to create repositories.
⚠️ Important:
- Make sure First you will create a
.pemkey manually from the AWS console. i.e "MYLABKEY.pem" because it will be used for creatingEC2VMs andEKS cluster.- Copy
MYLABKEY.pemin the terraform directory (01.Code_IAC_Selfhosted-Runner-and-Trivyand03.Code_IAC_Terraform_box) as below your terraform code- Generate the Github Token
ls
\Learning_GitHub_Action\02.Github_Action_DevOps-Project\Terraform_Code_Infra_setup


Mode                 LastWriteTime         Length Name
----                 -------------         ------ ----
dar--l          17/04/25  12:48 PM                .terraform
dar--l          21/04/25  12:34 PM                00.Code_IAC-github-repo
dar--l          21/04/25  12:34 PM                01.Code_IAC_Selfhosted-Runner-and-Trivy
dar--l          21/04/25   1:38 PM                02.Code_IAC_SonarQube
dar--l          21/04/25  12:34 PM                03.Code_IAC_Terraform_box
-a---l          20/08/24   1:45 PM            493 .gitignore
-a---l          21/04/25   1:59 PM          18225 AboutThis Project.md
-a---l          19/04/25   8:48 PM           1309 main.tf # <---(This one need to run)
Clone repository for terraform code
💡 Note: Replace GitHub Token, resource names and variables as per your requirement in terraform code
- For
github RepoToken value to be updated in file
00.Code_IAC-github-repo/variables.tf(i.e default-xxxxxx*)- For EC2 VM
01.Code_IAC_Selfhosted-Runner-and-Trivy/terraform.tfvars(i.e keyname-MYLABKEY*)03.Code_IAC_Terraform_box/terraform.tfvars(i.e keyname-MYLABKEY*)- For Cluster name
03.Code_IAC_Terraform_box/k8s_setup_file/main.tf(i.ebalraj*).- For Node Pod
03.Code_IAC_Terraform_box/k8s_setup_file/variable.tf(i.eMYLABKEY*)
Set up your GitHub token:
- Create a new GitHub personal access token with the
reposcope at https://github.com/settings/tokens. Then set it as an environment variable (DO NOT commit your token to version control):
# For Linux/macOS
export GITHUB_TOKEN=your_github_token

# For Windows Command Prompt
set GITHUB_TOKEN=your_github_token

# For Windows PowerShell (I used this one)
# $env:GITHUB_TOKEN="your_github_token"
$env:TF_VAR_github_token = "your-github-personal-access-token"
Test and verify with curl again in powershell terminal:
$headers = @{ Authorization = "token $env:TF_VAR_github_token" } Invoke-WebRequest -Uri "https://api.github.com/user" -Headers $headers- You should see your GitHub user info in JSON, not "Bad credentials".
<!--
Key Points
- GitHub Actions Overview:
- GitHub Actions is used as the CI/CD tool for this project.
- It eliminates the need for setting up and maintaining Jenkins servers by providing managed runners.
- Pipeline Stages:
- Compile: Builds the application.
- Security Checks: Scans for vulnerabilities using Trivy and GitLeaks.
- Unit Testing: Executes test cases to ensure code quality.
- Build and Publish Docker Image: Builds a Docker image and uploads it as an artifact.
- Deploy to Kubernetes: Deploys the application to an EKS cluster using Terraform.
Why Use This Project:
- Automates the software delivery process.
- Ensures code quality and security through automated checks.
- Simplifies deployment to Kubernetes clusters.
- Demonstrates best practices for CI/CD pipelines.
Takeaways:
- Understanding of GitHub Actions and its capabilities.
- Hands-on experience with integrating security tools like Trivy and GitLeaks.
- Knowledge of deploying applications to Kubernetes using Terraform.
- Insights into managing AWS resources with AWS CLI. -->
Step-by-Step Process
Setting Up the Infrastructure
I have created a Terraform code to set up the entire infrastructure, including the installation of required Repo, SonarQube Scanner, monitoring tools like grafana and prometheus, argocd and EKS cluster automatically created.
- ⇒ Docker Install
- ⇒ SonarQube Install
- ⇒ Trivy Install
- ⇒ Terraform Install
- ⇒ EKS Cluster Setup
💡 Note: ⇒
**EKS cluster**creation will take approx. 15 to 20 minutes.To Create EC2 Instances
First, we'll create the necessary virtual machines using terraform code.
Below is a terraform Code:
Once you clone repo then go to folder "02.Github_Action_DevOps-Project/Terraform_Code_Infra_setup" and run the terraform command.
cd 01.Github_Action_DevOps-Project/Terraform_Code_Infra_setup

$ ls

 00.Code_IAC-github-repo/   01.Code_IAC_Selfhosted-Runner-and-Trivy/   02.Code_IAC_SonarQube/   03.Code_IAC_Terraform_box/  'AboutThis Project.md'   main.tf
💡 Note: ⇒ Make sure to run
main.tfwhich is located outside of the folder. I have created the code in such a way that a single file will call all of the folders.
 ls -la
total 72
-rw-r--r-- 1 bsingh 1049089   493 Aug 20  2024  .gitignore
drwxr-xr-x 1 bsingh 1049089     0 Apr 21 12:34  00.Code_IAC-github-repo/
drwxr-xr-x 1 bsingh 1049089     0 Apr 21 12:34  01.Code_IAC_Selfhosted-Runner-and-Trivy/
drwxr-xr-x 1 bsingh 1049089     0 Apr 21 13:38  02.Code_IAC_SonarQube/
drwxr-xr-x 1 bsingh 1049089     0 Apr 21 12:34  03.Code_IAC_Terraform_box/
-rw-r--r-- 1 bsingh 1049089 21284 Apr 21 14:44 'AboutThis Project.md'
-rw-r--r-- 1 bsingh 1049089  1309 Apr 19 20:48  main.tf # <---This need to be run>
You need to run main.tf file using following terraform command.
Now, run the following command.
terraform init
terraform fmt
terraform validate
terraform plan
terraform apply
# Optional <terraform apply --auto-approve>
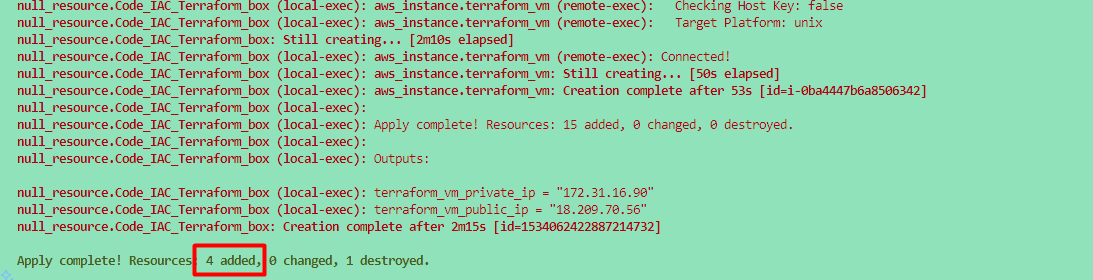
Once you run the terraform command, then we will verify the following things to make sure everything is setup properly via a terraform.
Inspect the Cloud-Init logs:
Once connected to EC2 instance then you can check the status of the user_data script by inspecting the log files.
# Primary log file for cloud-init
sudo tail -f /var/log/cloud-init-output.log
                    or
sudo cat /var/log/cloud-init-output.log | more
🔍- If the user_data script runs successfully, you will see output logs and any errors encountered during execution.
🔍- If there’s an error, this log will provide clues about what failed.
- Verify the Outcome of "
cloud-init-output.log"
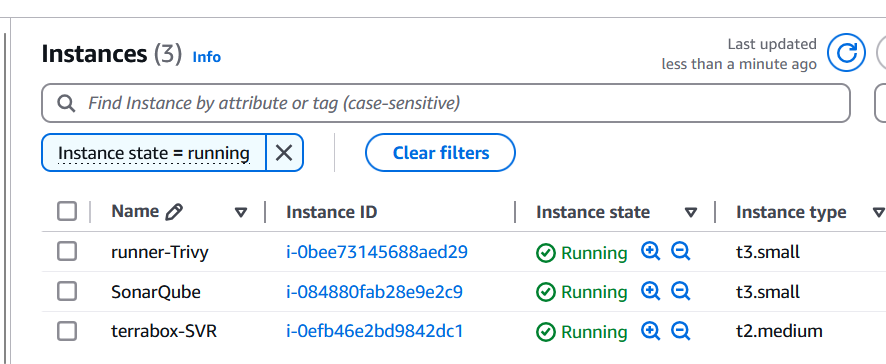
Verify the Installation on EC Terrabox-SVR
- [x] Docker version ```bash ubuntu@ip-172-31-95-197:~$ docker --version Docker version 24.0.7, build 24.0.7-0ubuntu4.1
docker ps -a ubuntu@ip-172-31-94-25:~$ docker ps
- [x] <span style="color: brown;"> trivy version
```bash
ubuntu@ip-172-31-89-97:~$ trivy version
Version: 0.55.2
- [x] Terraform version
ubuntu@ip-172-31-89-97:~$ terraform version Terraform v1.9.6 on linux_amd64 - [x] eksctl version
ubuntu@ip-172-31-89-97:~$ eksctl version 0.191.0 - [x] kubectl version
ubuntu@ip-172-31-89-97:~$ kubectl version Client Version: v1.31.1 Kustomize Version: v5.4.2 - [x] aws cli version
ubuntu@ip-172-31-89-97:~$ aws version
usage: aws [options] <command> <subcommand> [<subcommand> ...] [parameters]
To see help text, you can run:
aws help
aws <command> help
aws <command> <subcommand> help
Verify the EKS Cluster installation
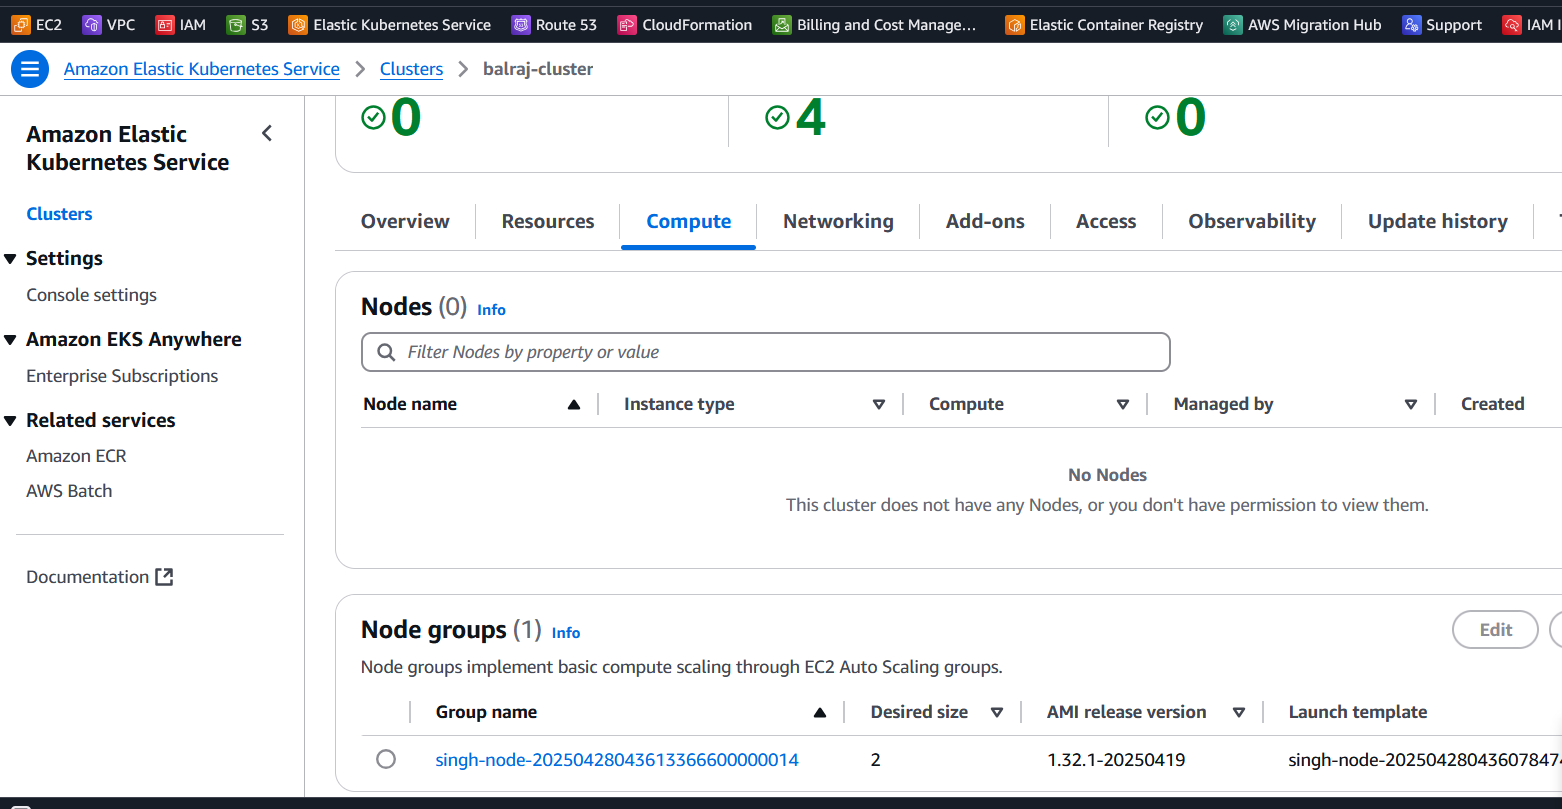
- Will take a putty session of from
Terraform EC2 - On the
terraformvirtual machine, Go to directoryk8s_setup_fileand open the filecat apply.logto verify the cluster is created or not. Will verify the cluster status from
sudo cat /var/log/cloud-init-output.log | moreorcat /home/ubuntu/k8s_setup_file/apply.log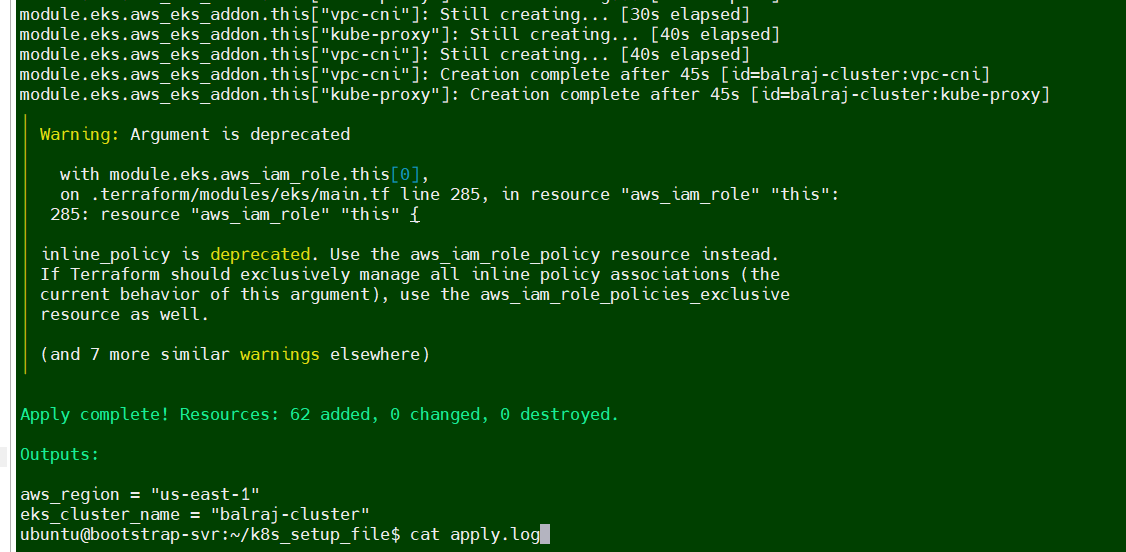
ubuntu@ip-172-31-90-126:~/k8s_setup_file$ pwd
/home/ubuntu/k8s_setup_file
ubuntu@ip-172-31-90-126:~/k8s_setup_file$ cd ..
kubectl get nodes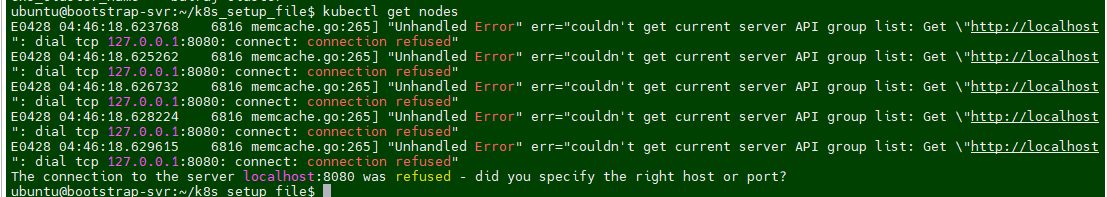
After Terraform deploys on the instance, now it's time to setup the cluster. If you logout the ssh session then reconnect the SSH and run to following command:
eksctl utils write-kubeconfig --cluster="$CLUSTER_NAME" --region="$REGION"Once EKS cluster is setup then need to run the following command to make it intract with EKS.
eksctl utils write-kubeconfig --cluster="balraj-cluster" --region="us-east-1"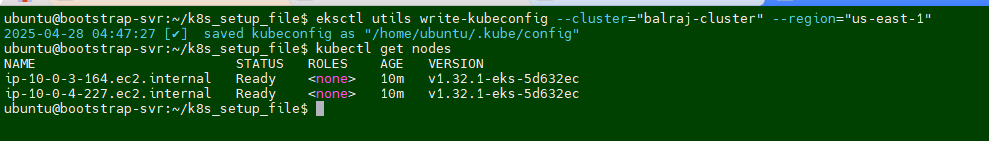
⚠️ Important:
Theaws eks update-kubeconfigcommand is used to configure your local kubectl tool to interact with an Amazon EKS (Elastic Kubernetes Service) cluster. It updates or creates a kubeconfig file that contains the necessary authentication information to allow kubectl to communicate with your specified EKS cluster.What happens when you run this command:
The AWS CLI retrieves the required connection information for the EKS cluster (such as the API server endpoint and certificate) and updates the kubeconfig file located at~/.kube/config (by default). It configures the authentication details needed to connect kubectl to your EKS cluster using IAM roles. After running this command, you will be able to interact with your EKS cluster using kubectl commands, such askubectl get nodesorkubectl get pods.
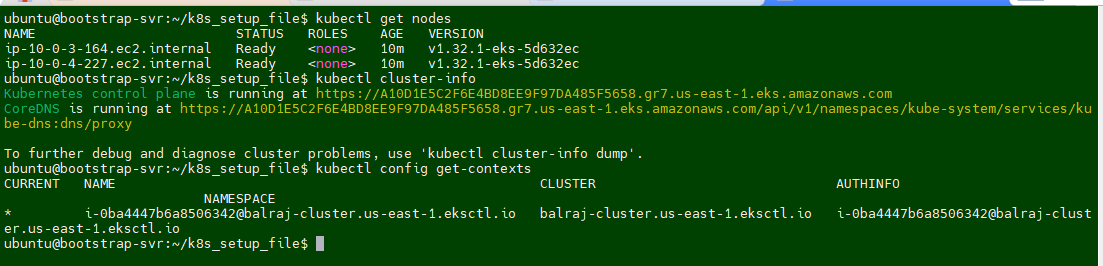
   kubectl get nodes
   kubectl cluster-info
   kubectl config get-contexts
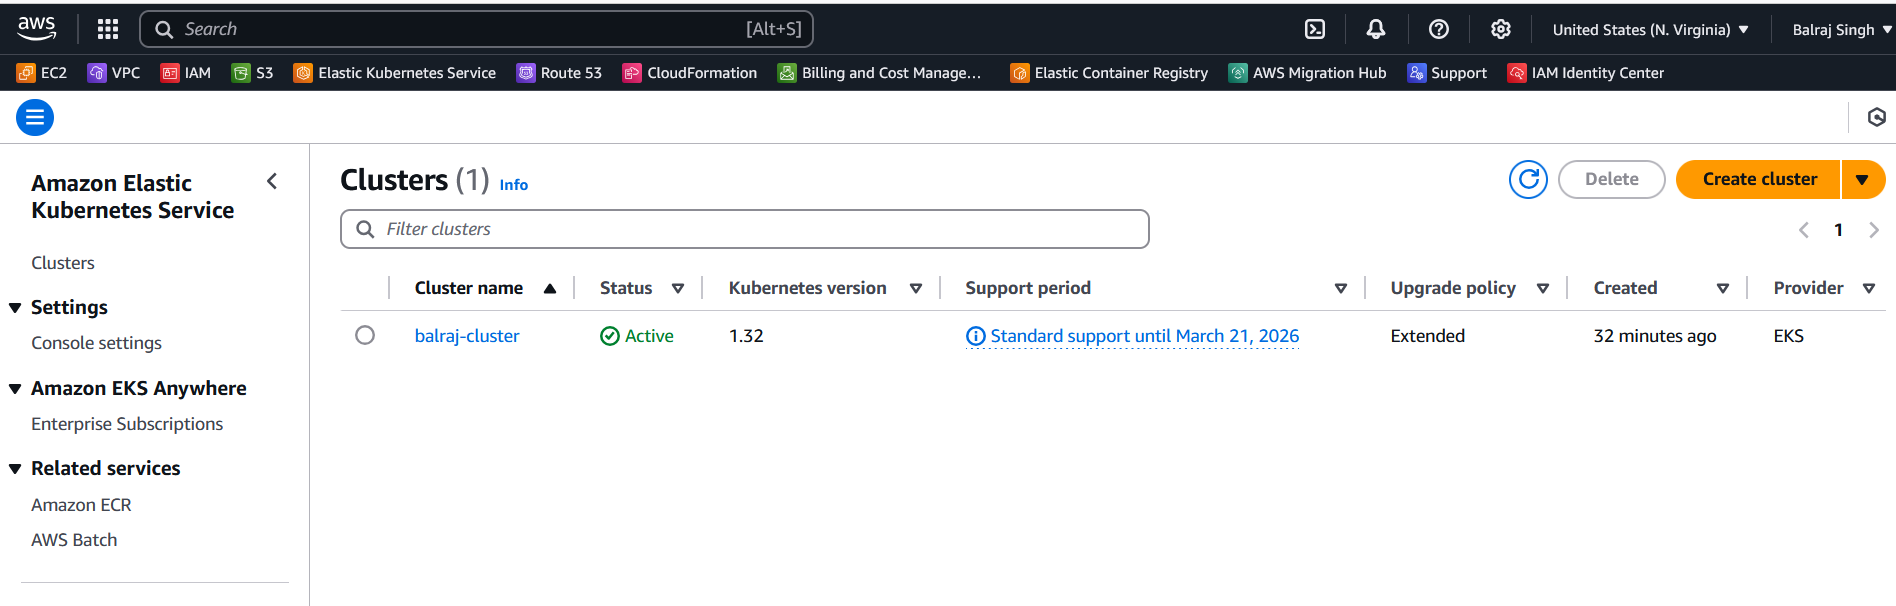
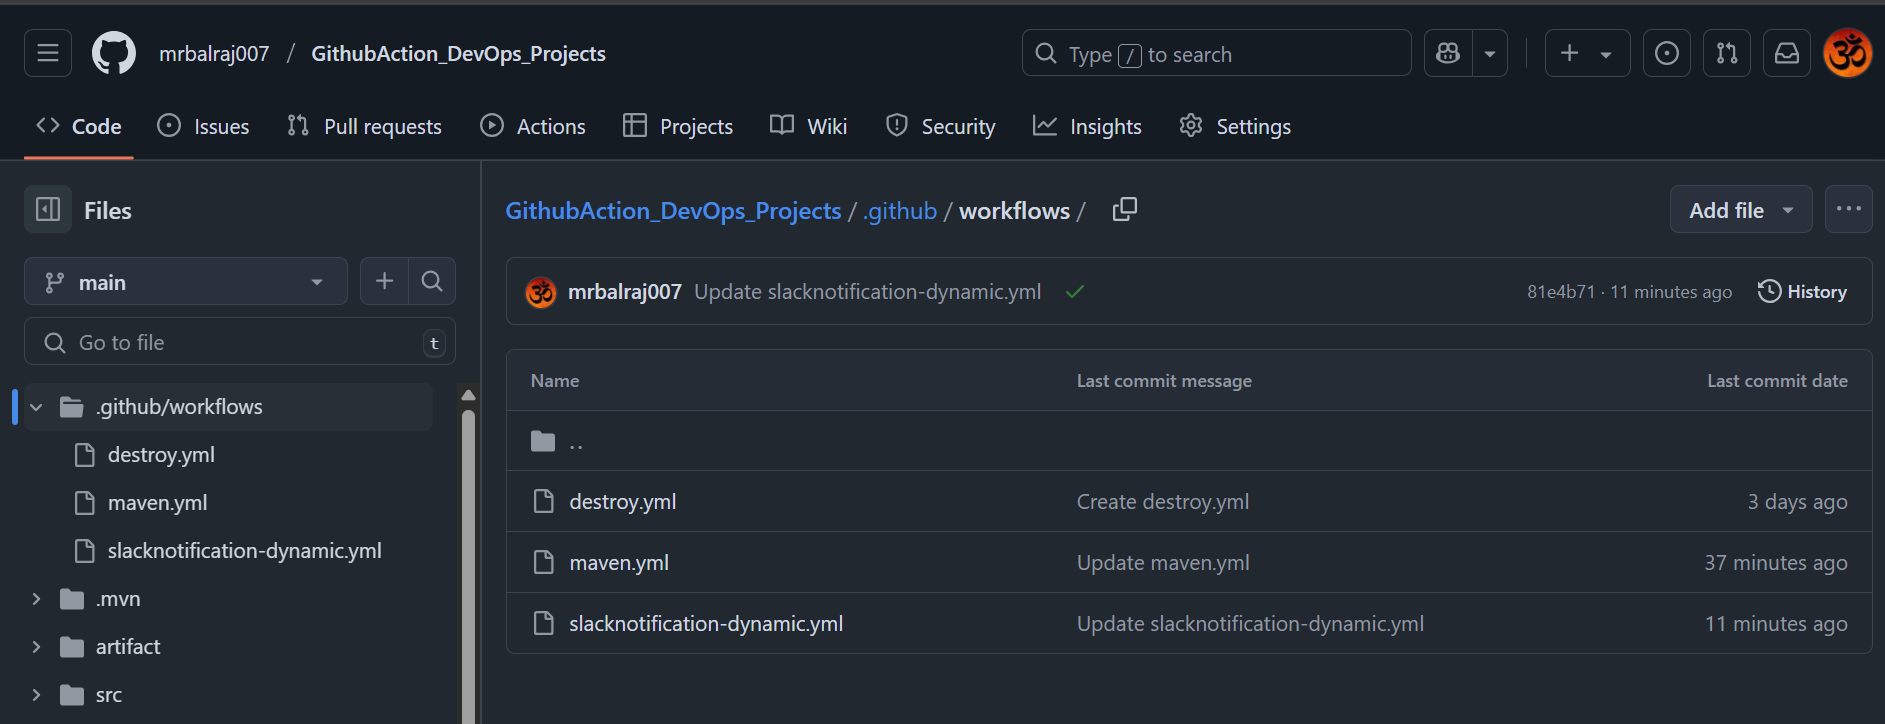
Verify GitHub Repo and GitHub Actions
- Verify GitHub repository created and initialize it because we are using terraform.
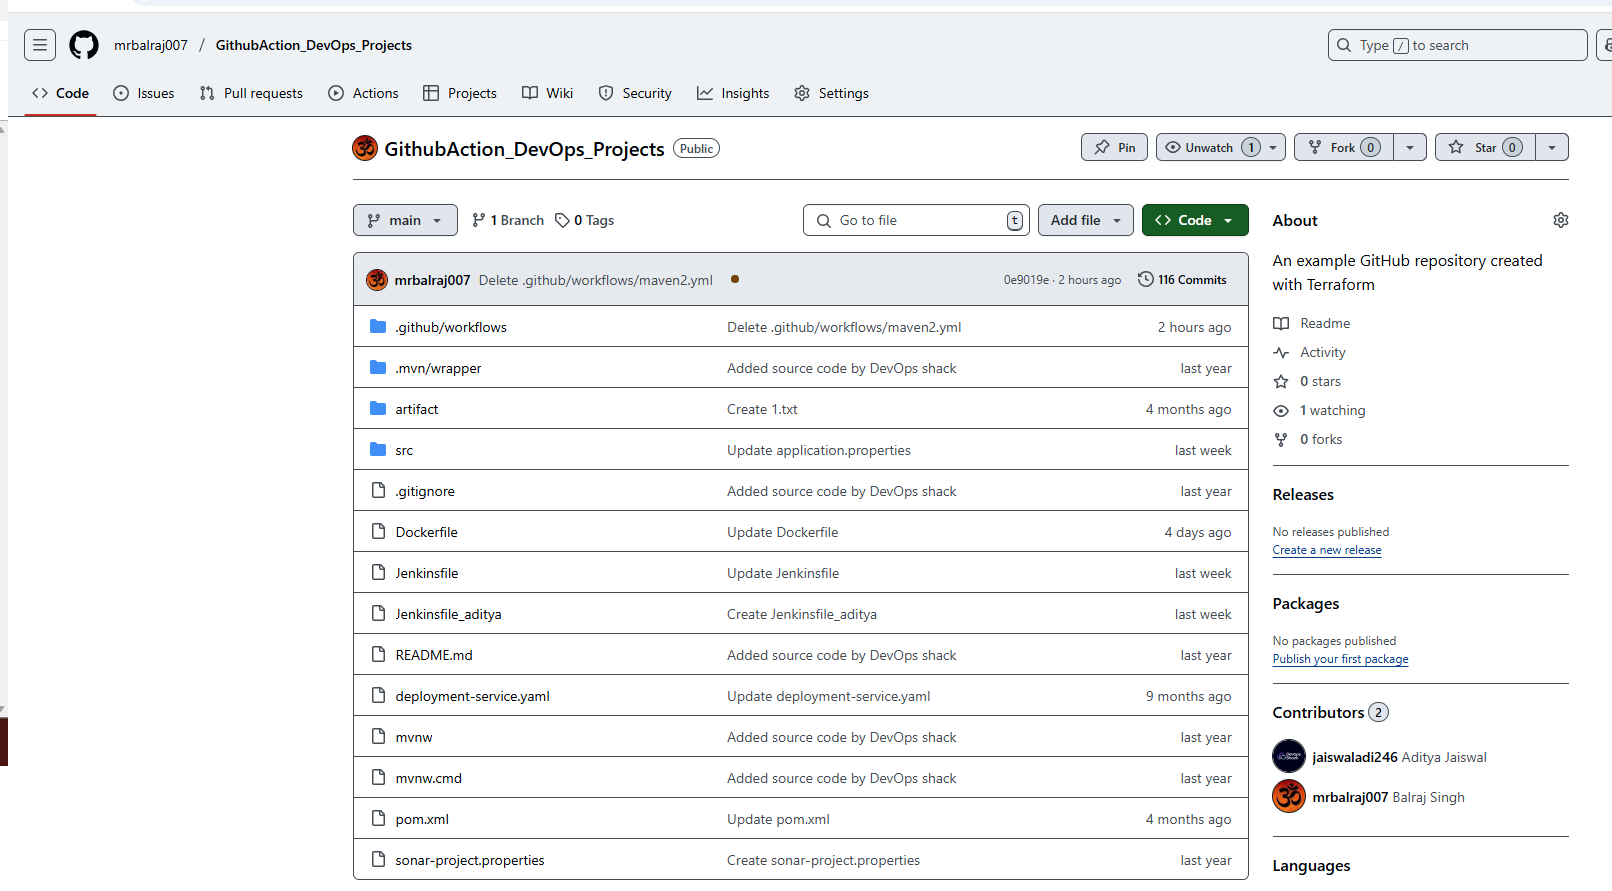
- Verify a
.github/workflowsdirectory created along with two YAML file for the pipeline.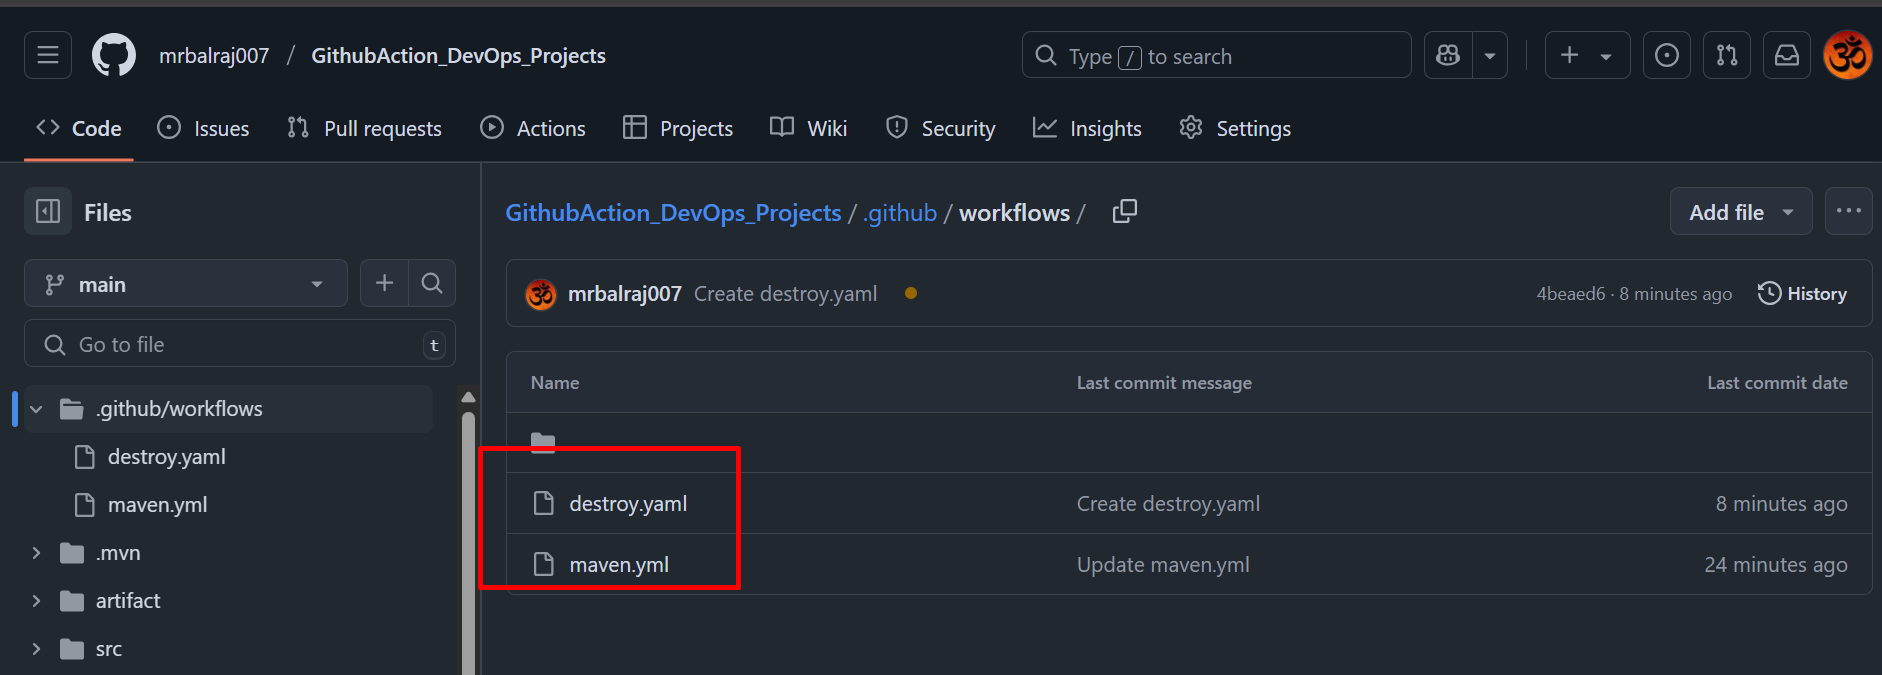
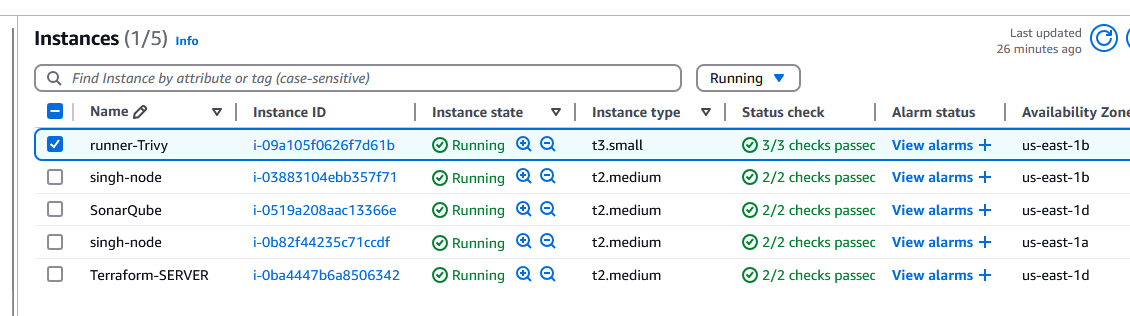
Adding a Virtual Machine as a Runner
- I'll be using self-hosted runner to execute all the pipeline.
- Configure the runner by following the commands provided in GitHub's settings.
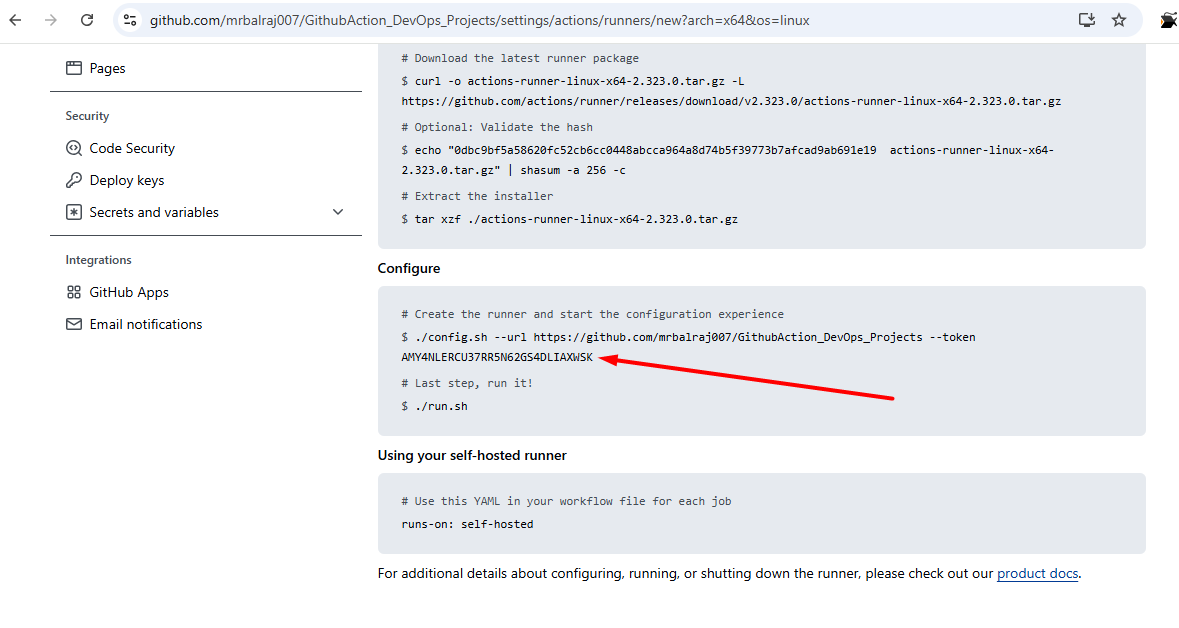
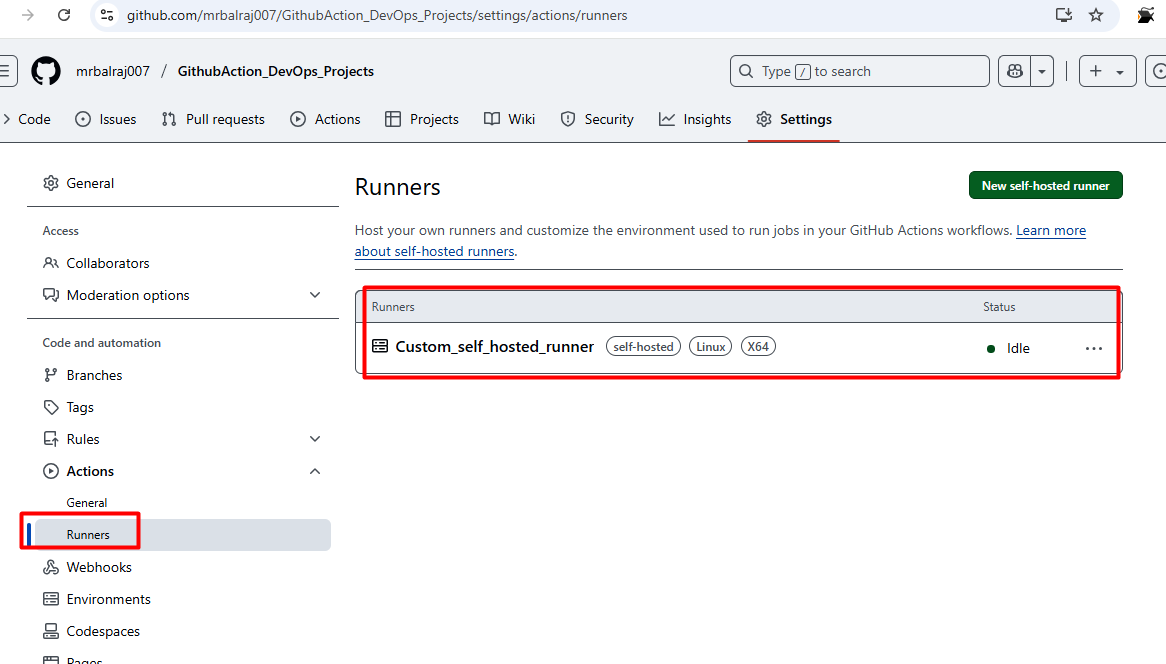
    Go to "GithubAction_DevOps_Projects"
    Click on settings
    then select the actions and choose "runners"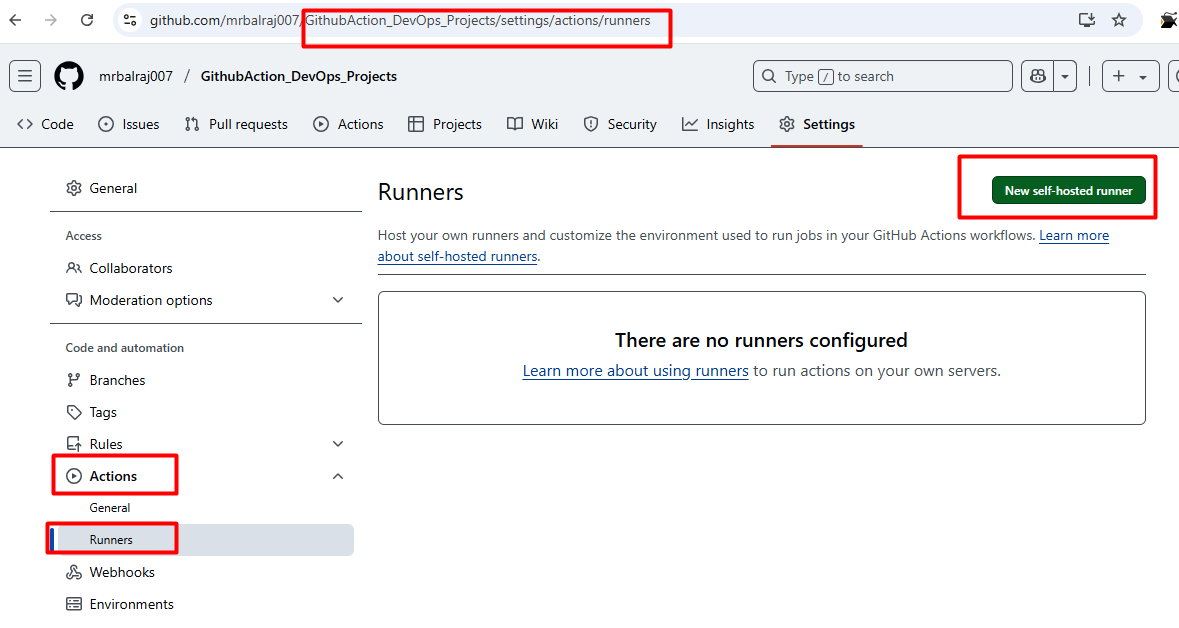
- Click on new
self-hosted runnerand selectLinux - Notedown the token value somewhere as we need to in runner VM.
- Take putty session of
runnerEC2 - Go to
actions-runnerfolder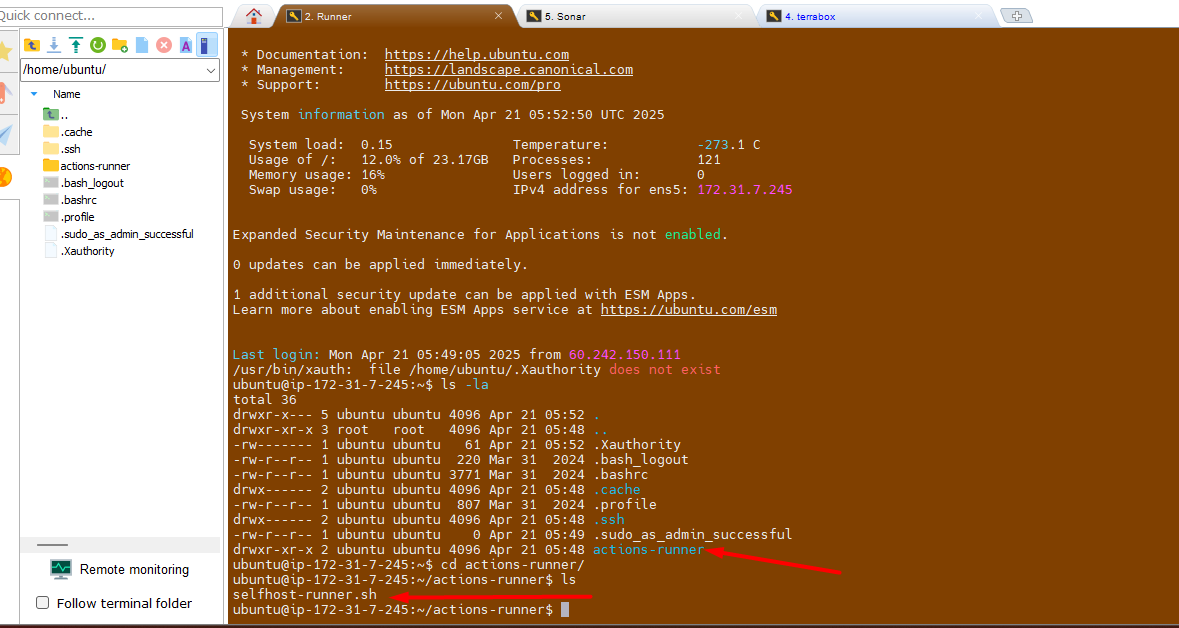
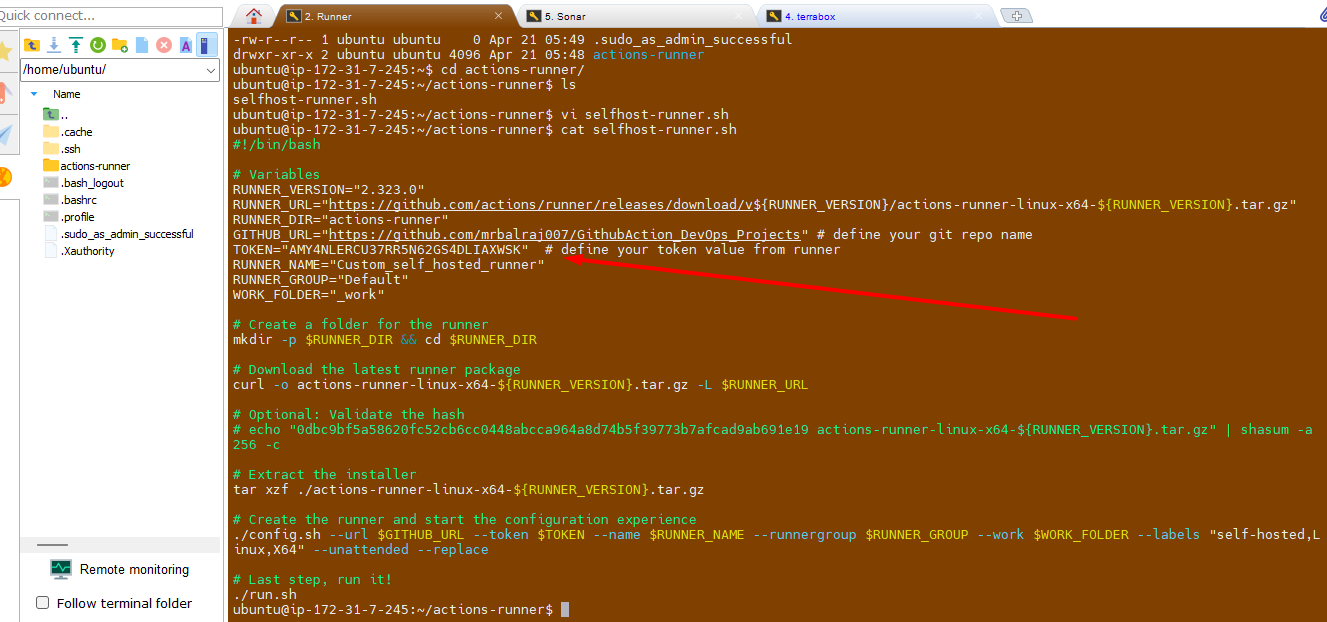
- Update/Paste the token value here as mentioned in screenshot.
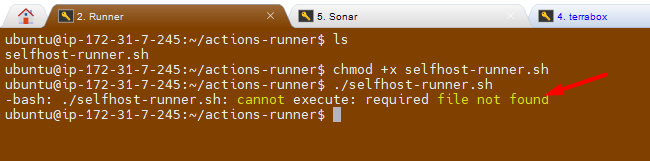
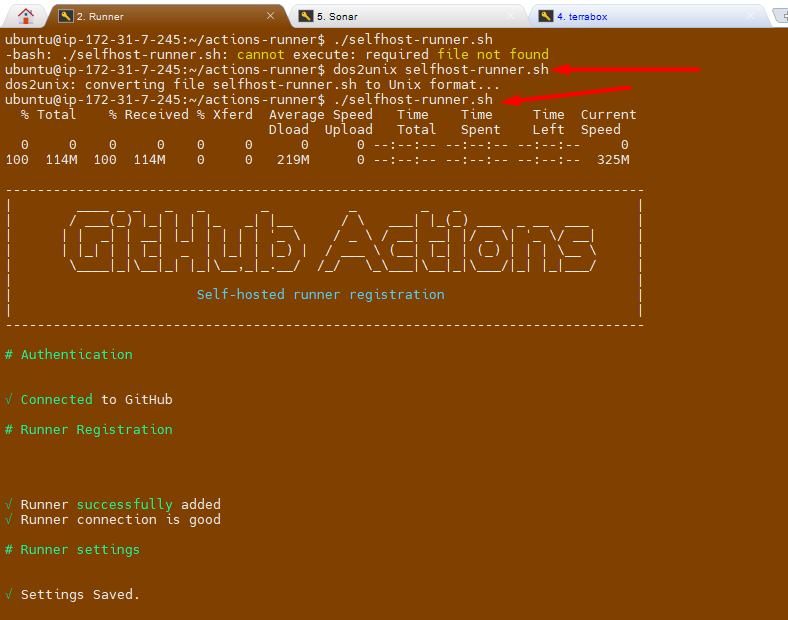
- Change the execution mode for script and run it.
chmod +x selfhost-runner.sh
💡 Note:
Take note of the token value from here and paste it into the script in runner at the following spot. This ensures that the script executes successfully with the necessary permissions. Once you've finished, save your modifications and run the script to test whether it works as planned.
Troubleshooting:
- I am getting below error message while execute the file.
Fix/Solution:
- I try explicitly invoking the bash interpreter:
bash ./selfhost-runner.sh- The solution is to remove these carriage return characters using the dos2unix command:
- Install dos2unix if you haven't already:
sudo apt-get update sudo apt-get install dos2unix - Run
dos2unixonselfhost-runner.shscript:dos2unix selfhost-runner.sh - Try running the script again:
./selfhost-runner.sh💡 Idea: This should now execute correctly because the problematic carriage return characters will have been removed
It works :-) and I am able to execute the file.
Setup SonarQube
- Go to SonarQube EC2 and notedown the Public IPAddress and open a new browser.
- Access SonarQube via
http://<your-server-ip>:9000.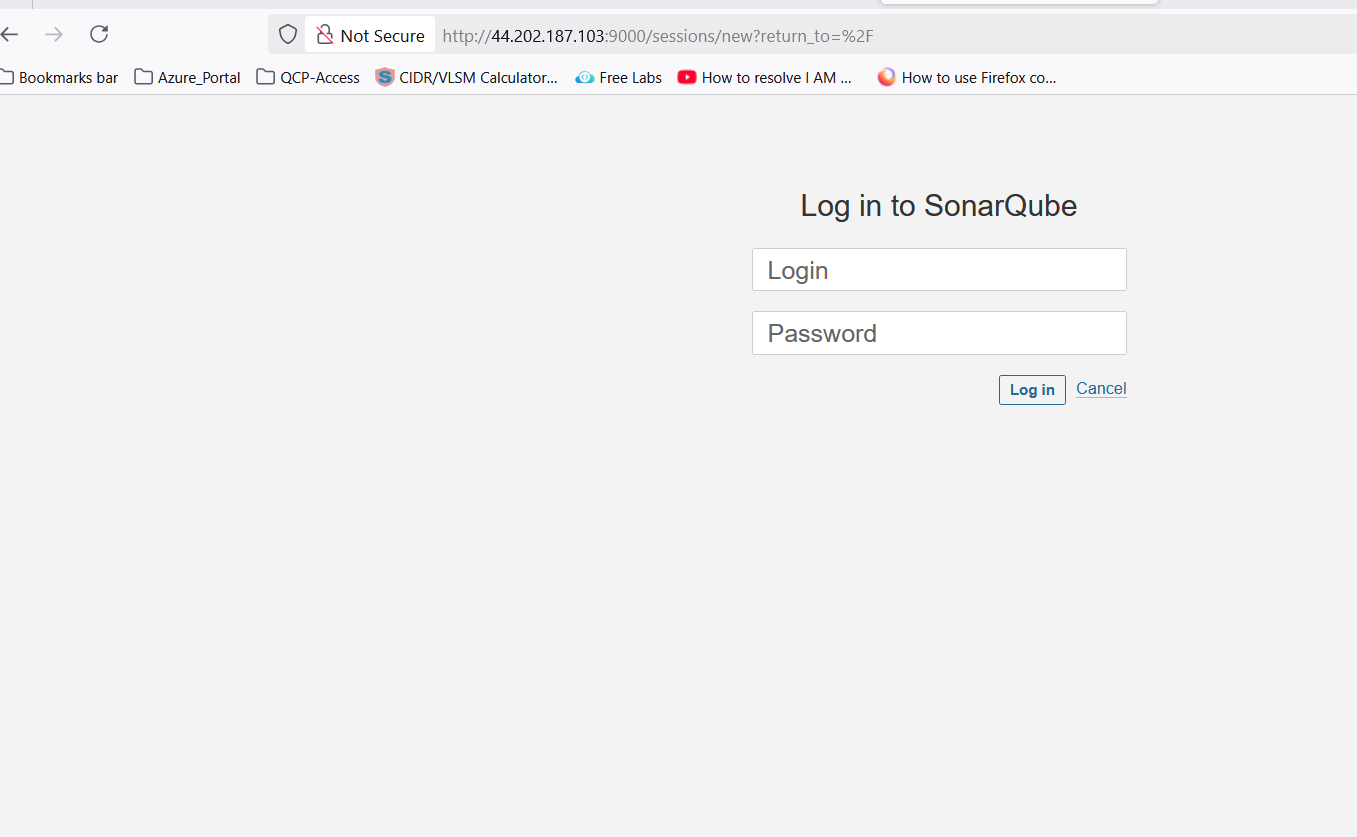
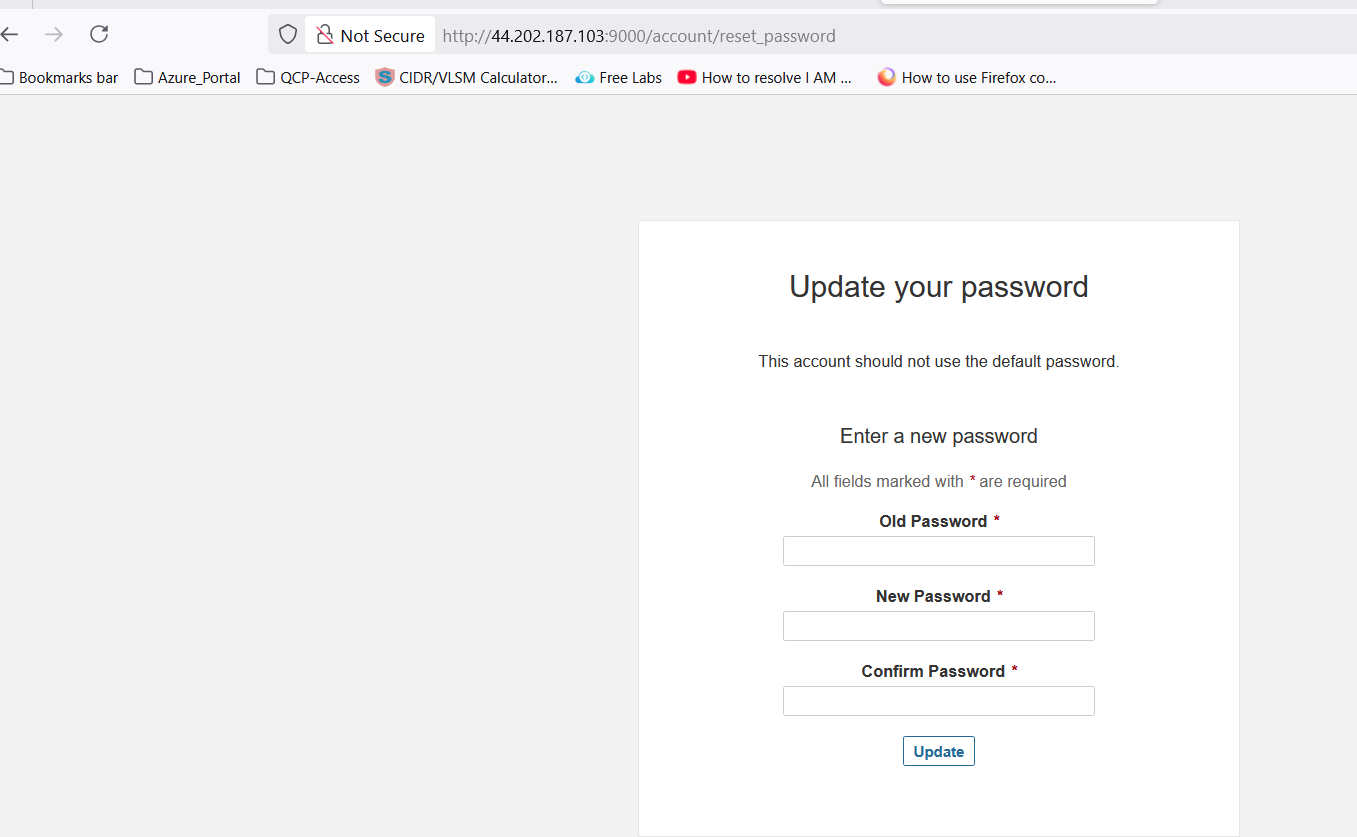
💡 Note: When you access the above URl then it will be promot for login. Use the "
admin/admin" for first time login and will prompt for change the password Once you change the password, make sure to create a strong and secure one that you can remember. Afterward, you will have full access to the system's features and settings.
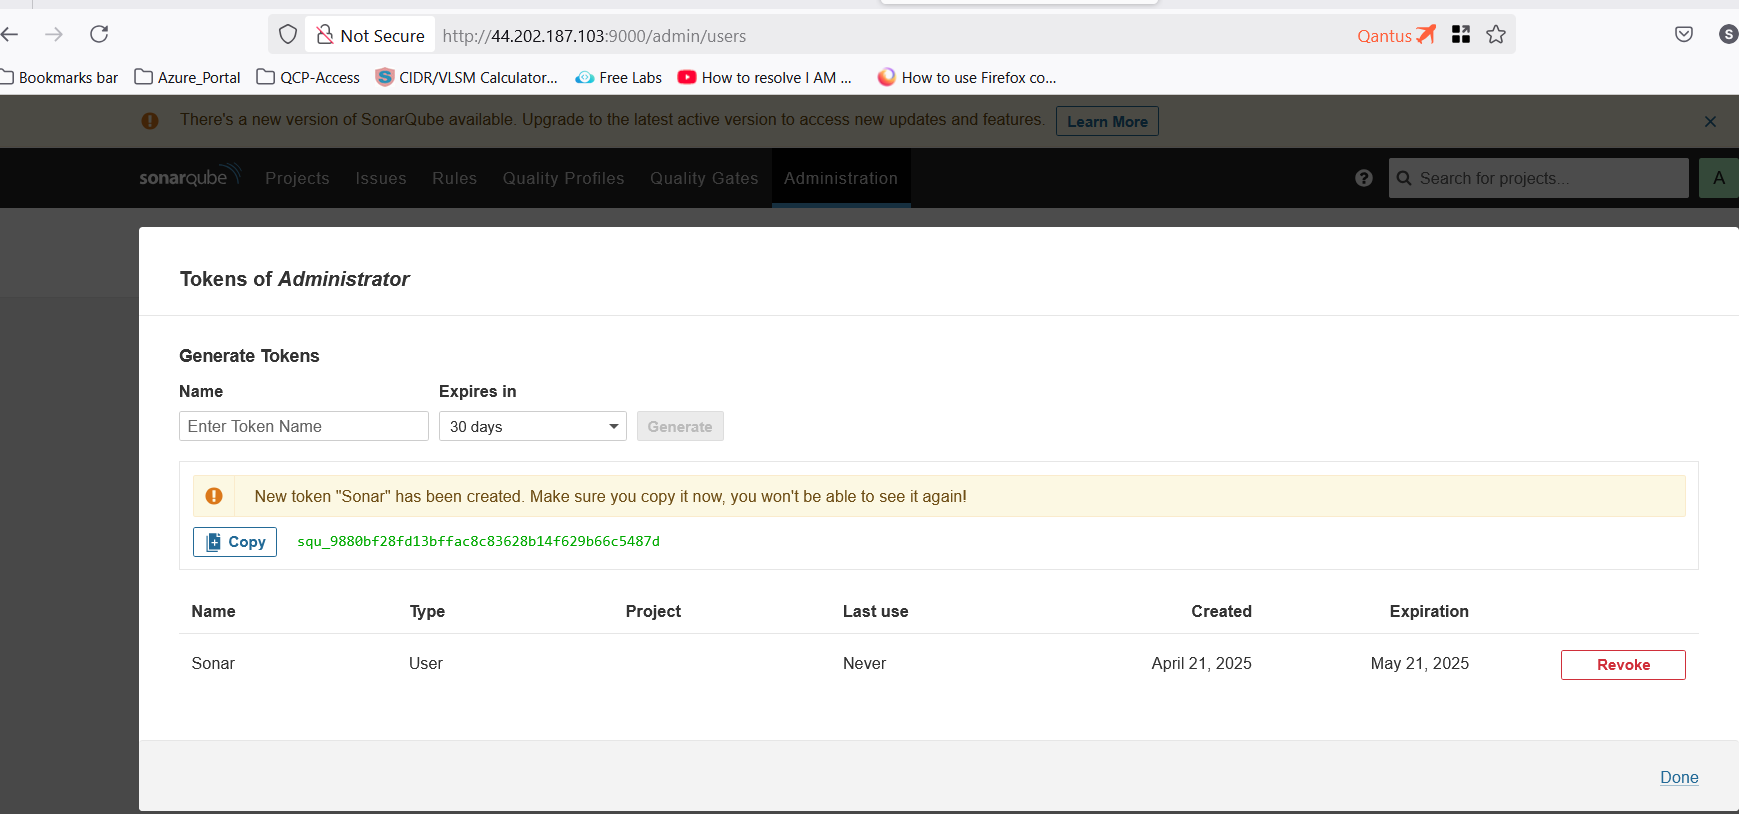
Create a token in SonarQube
- Go to
Administration>Security>Users>Create a new token
Configure Secrets and Variables in GitHub Repo.
Go to Repo `GithubAction_DevOps_Projects`
            Click on `settings` > `Secrets and Variables` > Select `Actions`.
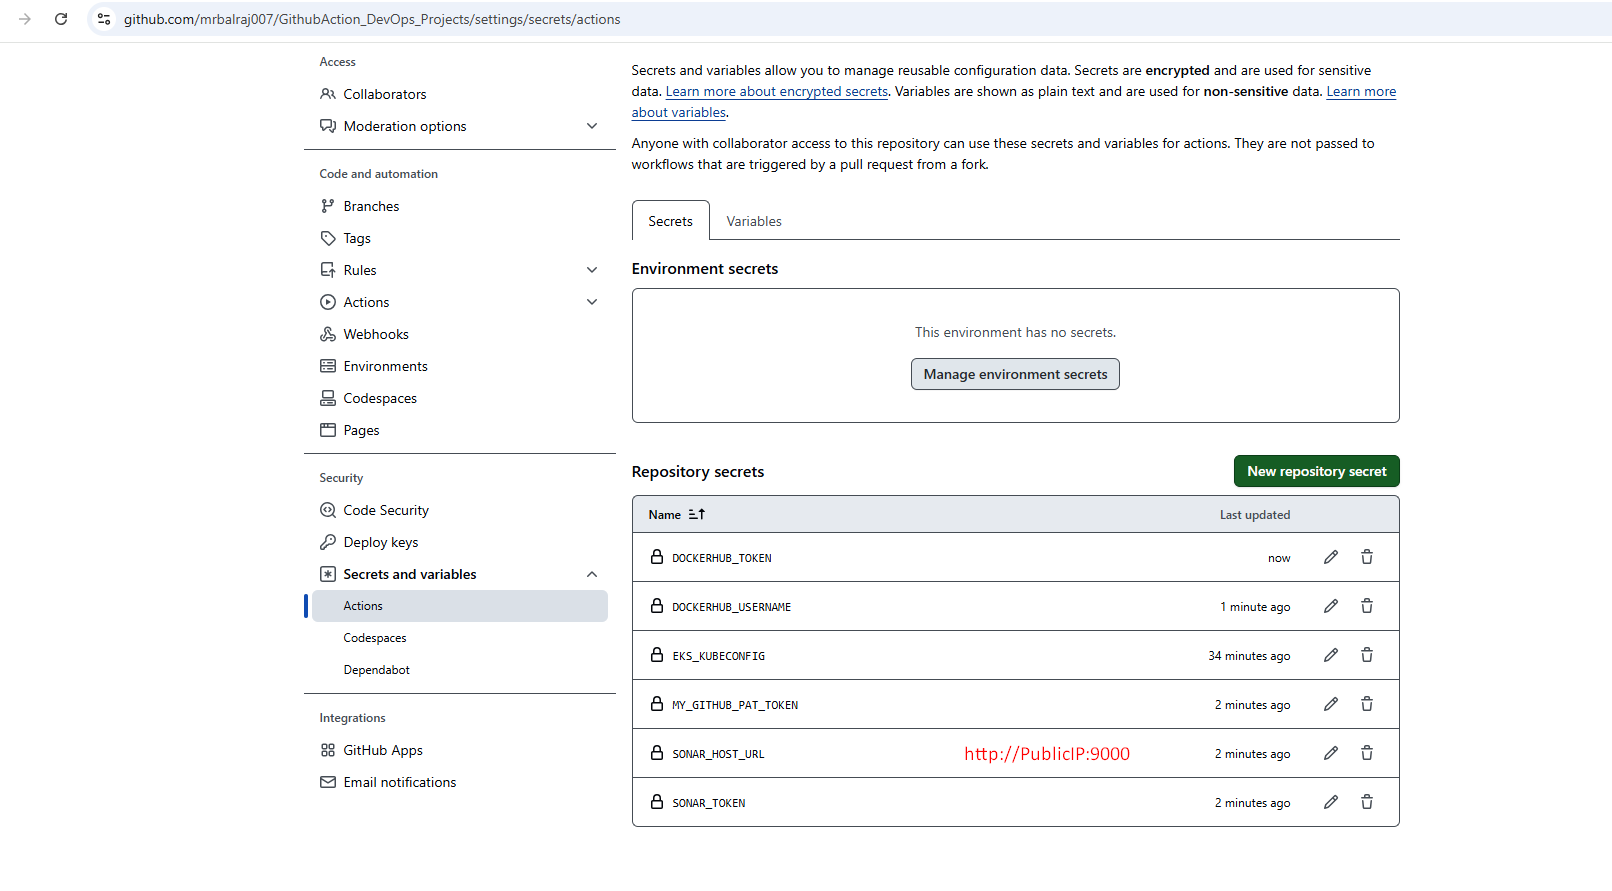
💡 Note:
You have to update all the required tokens and secrets value here. Part of Terraform code, I have already created a dummy values, which needs to be replaced. Once you have replaced the dummy values with the actual tokens and secrets, ensure that you test the configuration thoroughly to confirm that everything functions as expected. This will help prevent any issues during deployment and maintain the integrity of your infrastructure.
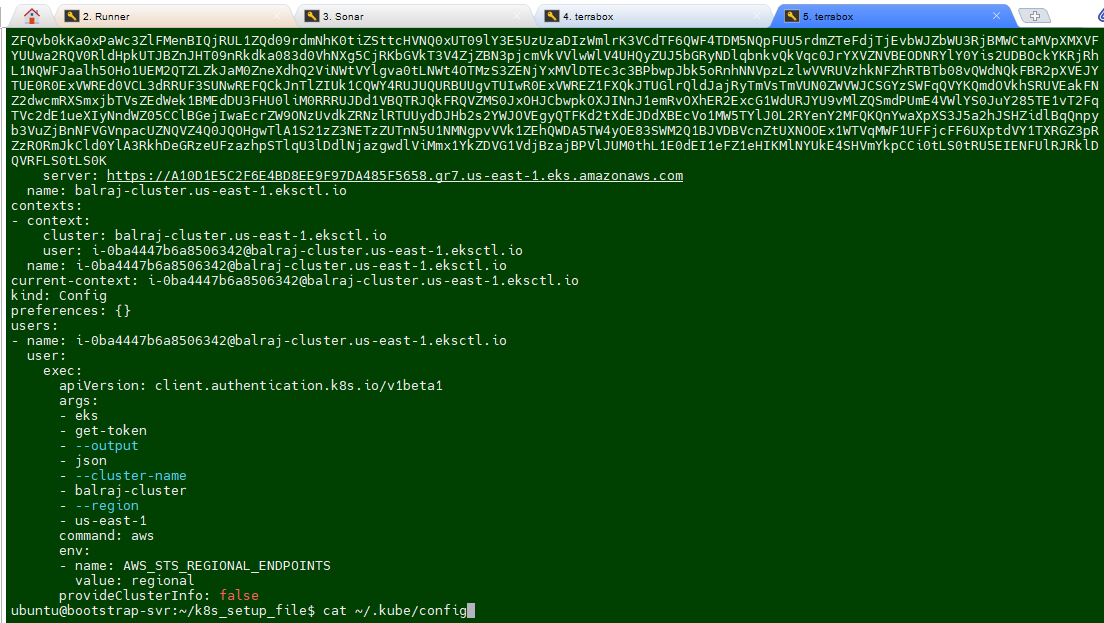
- To update the
EKS_KUBECONFIGsecret- Take putty session of
Terraform EC2instnace - run the command
cat ~/.kube/config - copy the whole content and paste into the secret.
- Take putty session of
Attach Role to Runner EC2
- Select the EC2 VM and click on the
actions>security>Mofify IAM Roles on the runner.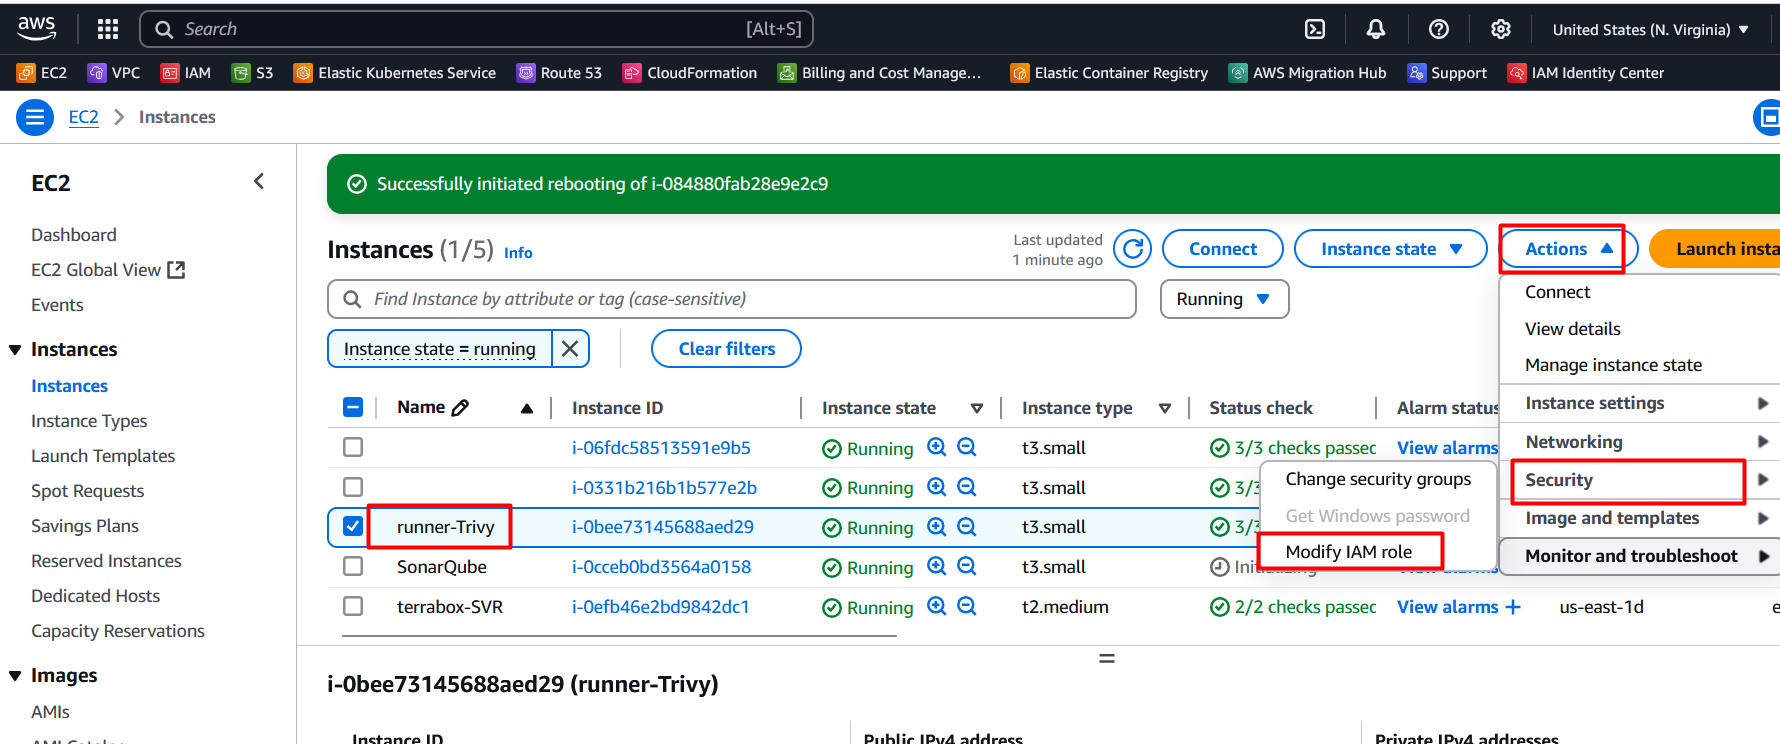
- Select the role
Role_k8_Cluster_profile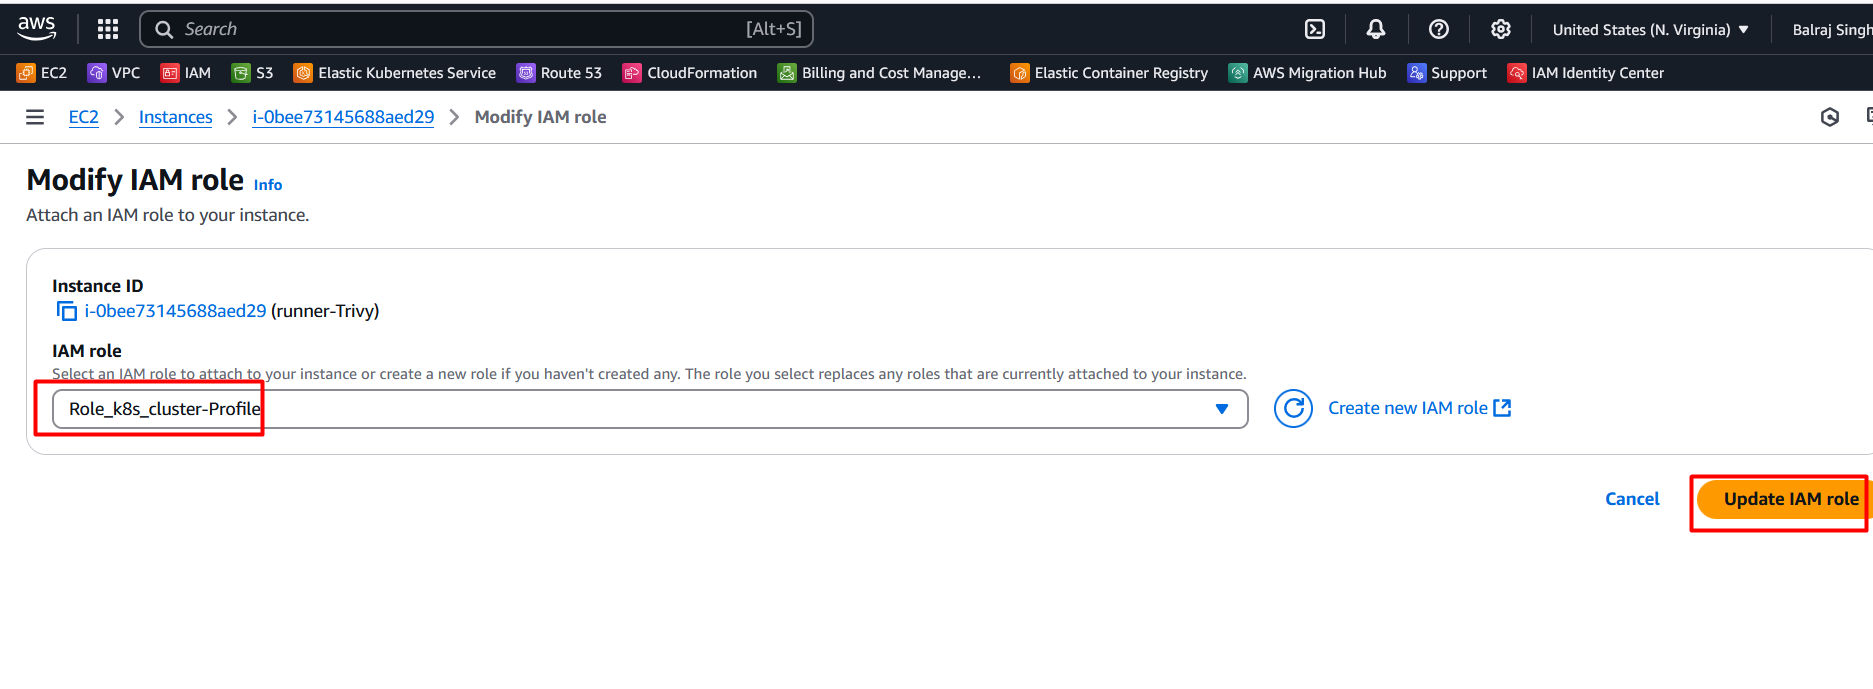
- Click on update IAM Role.
Writing the CI/CD Pipeline
- Compile Stage:
- Use
actions/checkoutto clone the repository. - Set up the required environment (e.g., JDK 17 for Java projects).
- Compile the application using build tools like Maven.
- Use
- Security Checks:
- Install and run Trivy to scan for vulnerabilities in Docker images.
- Use GitLeaks to detect hardcoded secrets in the source code.
- Unit Testing:
- Execute test cases to validate the application.
- Build and Publish Docker Image:
- Build a Docker image using
docker build. - Push the image to a container registry or upload it as an artifact.
- Build a Docker image using
- Deploy to Kubernetes:
- Use Terraform to provision an EKS cluster.
- Deploy the application using Kubernetes manifests.
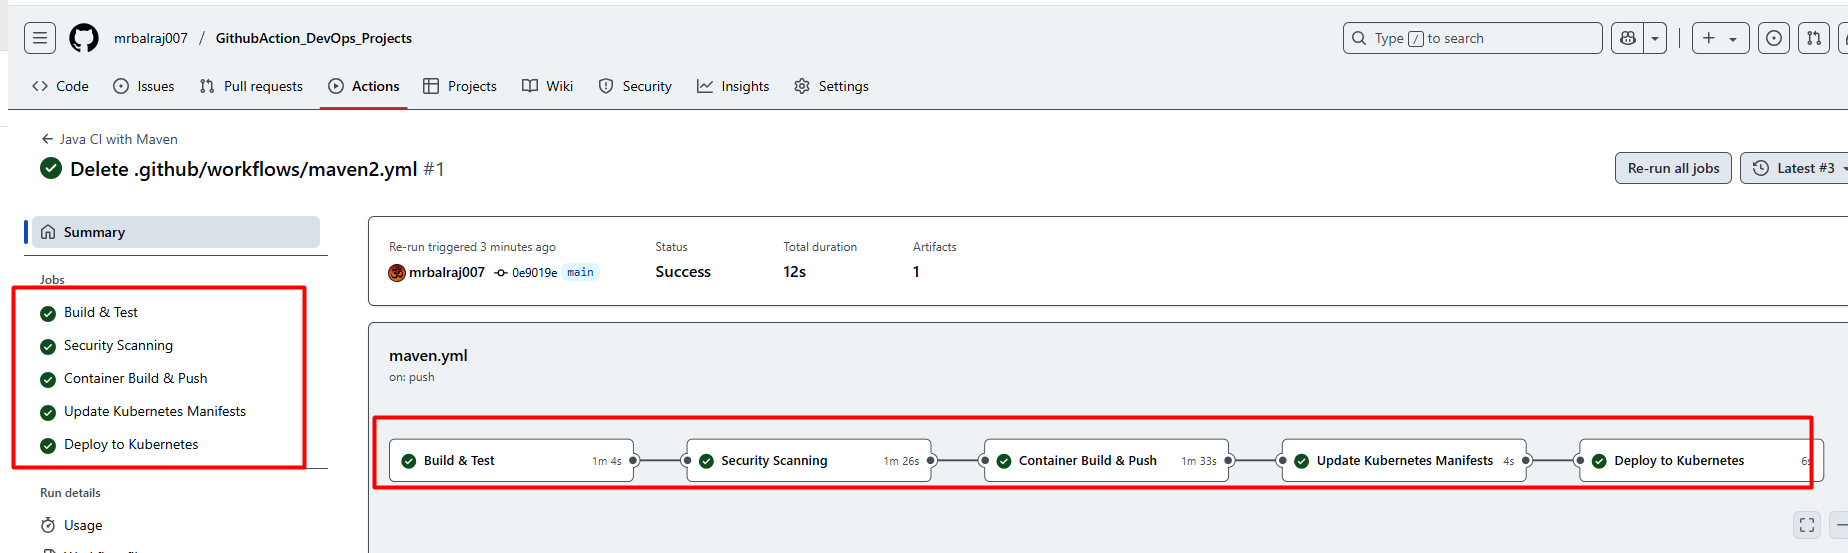
- Here is the complete CICD- Pipeline details
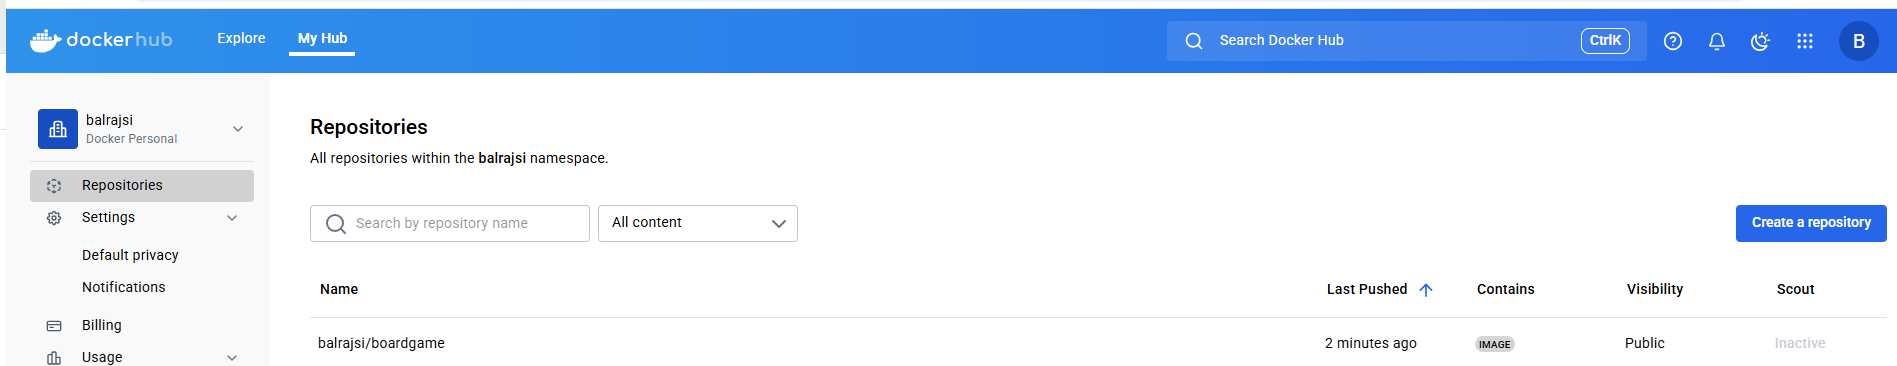
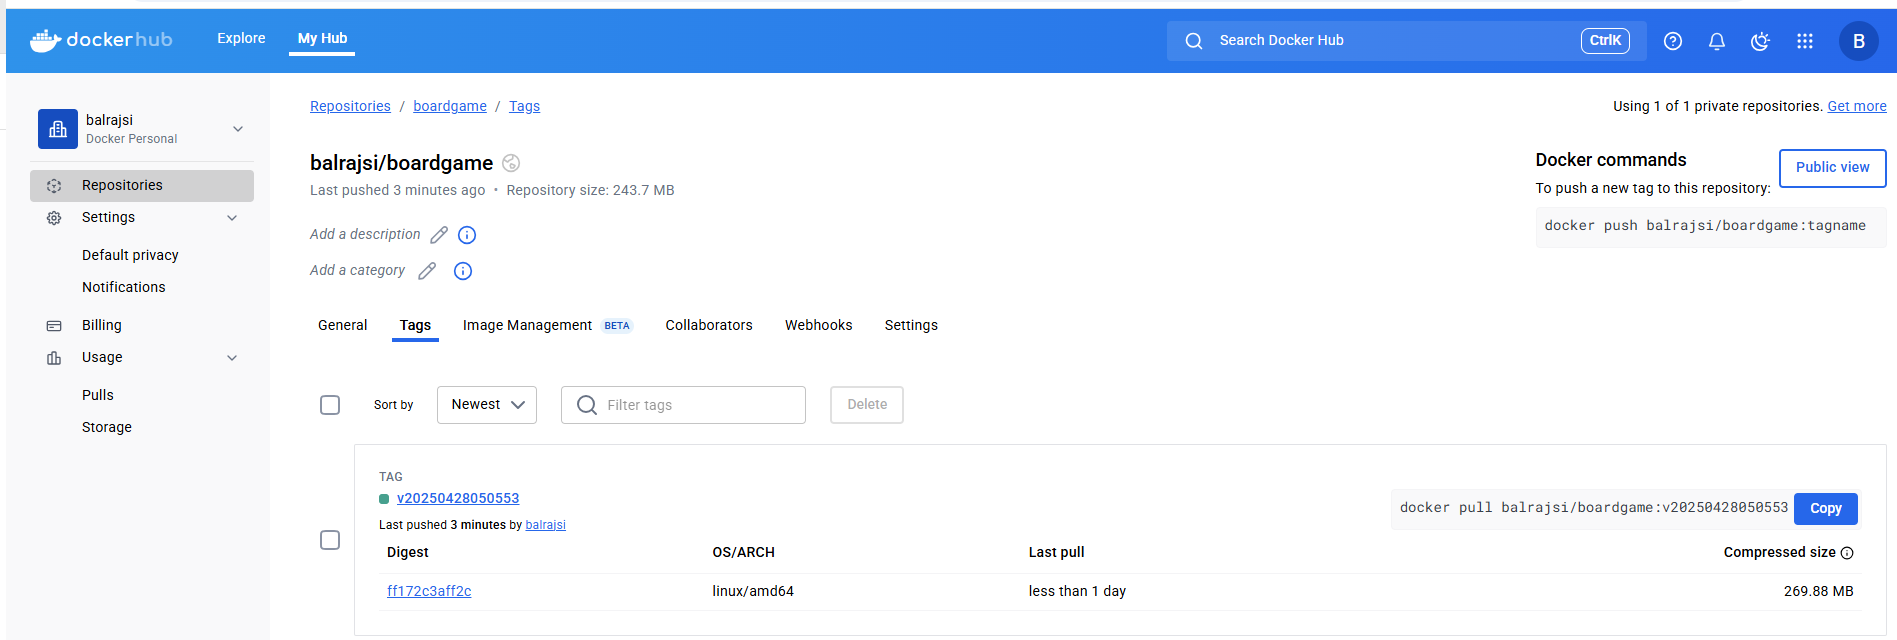
Verify the Docker Image
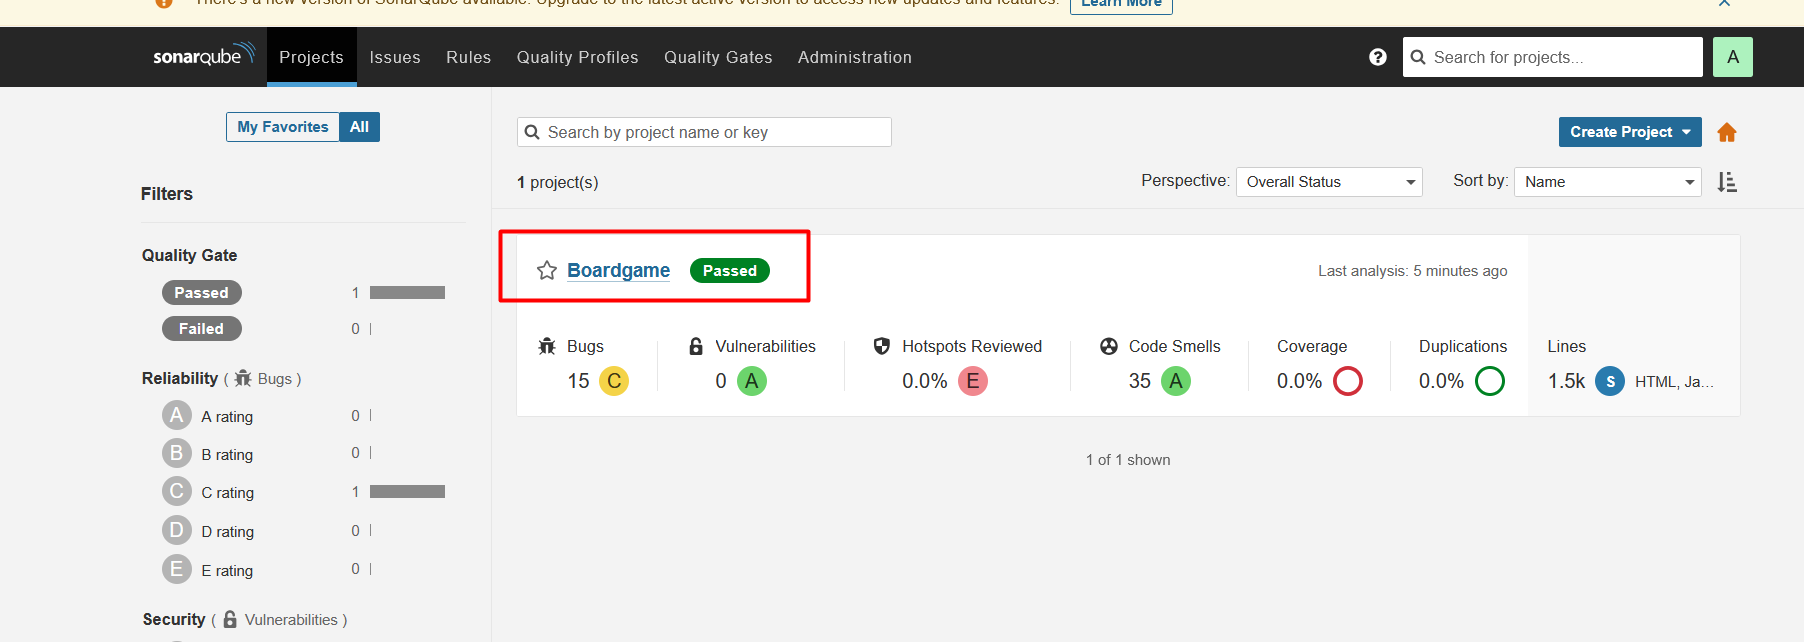
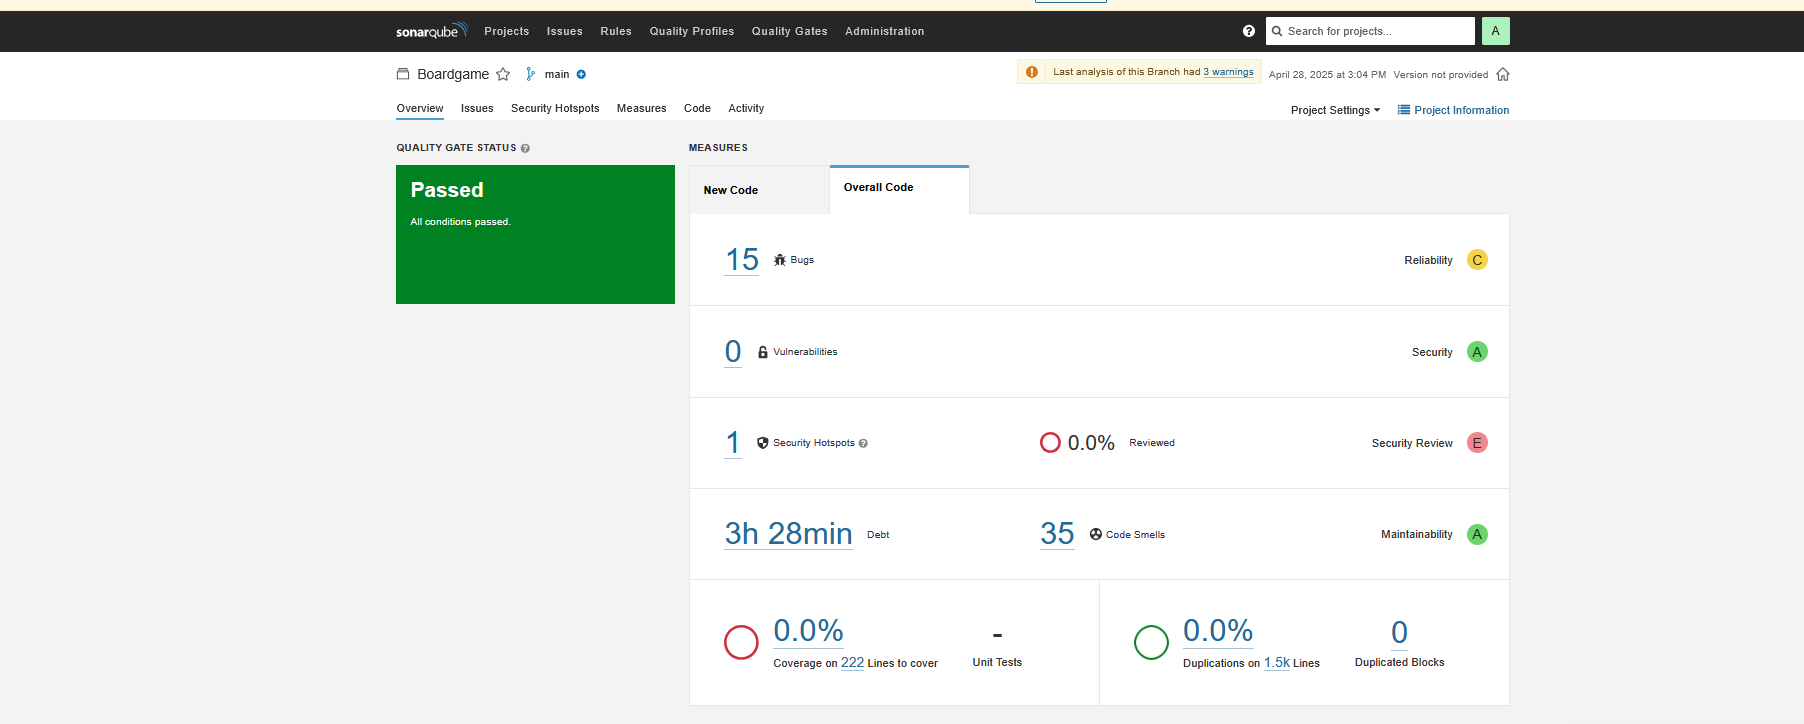
Verify code coverage in SonarQube
Verify pipeline Status
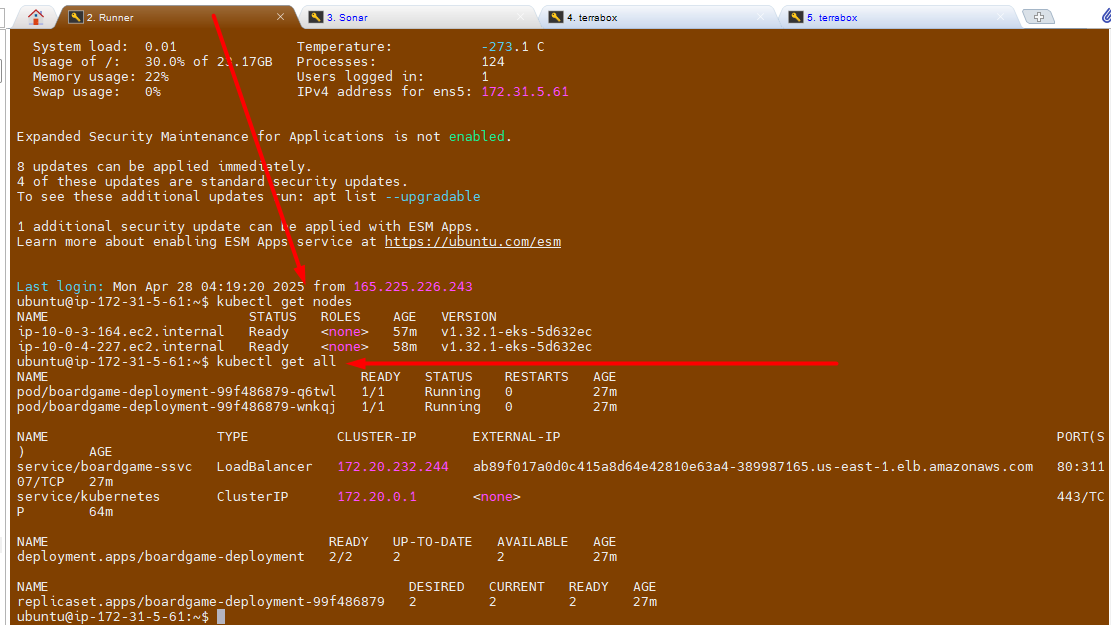
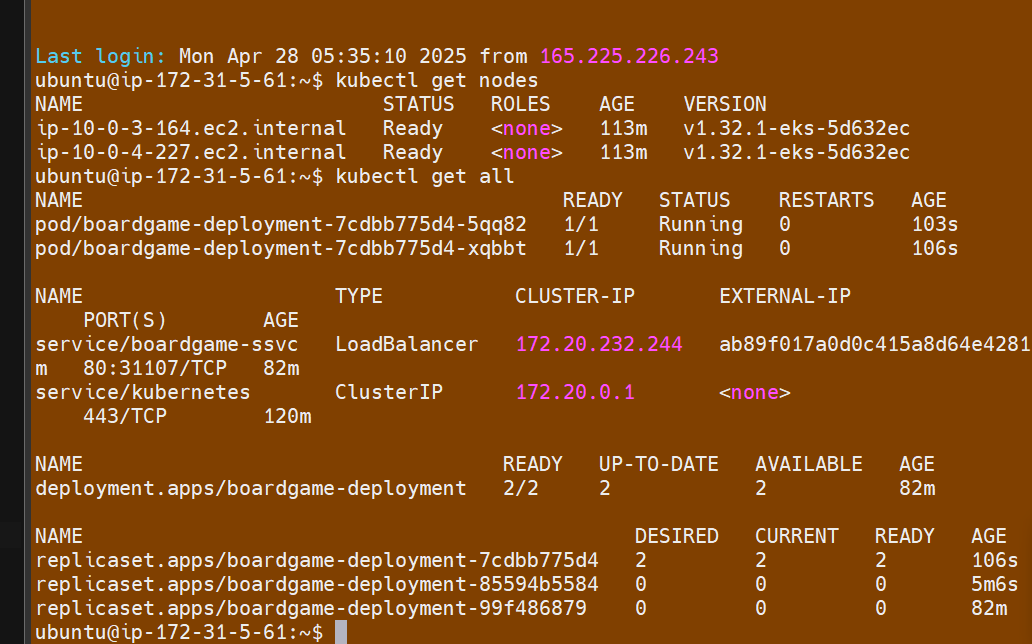
Verify the pods status from runner VM
ubuntu@ip-172-31-5-61:~$ kubectl get nodes
NAME                         STATUS   ROLES    AGE   VERSION
ip-10-0-3-164.ec2.internal   Ready    <none>   57m   v1.32.1-eks-5d632ec
ip-10-0-4-227.ec2.internal   Ready    <none>   58m   v1.32.1-eks-5d632ec
ubuntu@ip-172-31-5-61:~$ kubectl get all
NAME                                       READY   STATUS    RESTARTS   AGE
pod/boardgame-deployment-99f486879-q6twl   1/1     Running   0          27m
pod/boardgame-deployment-99f486879-wnkqj   1/1     Running   0          27m

NAME                     TYPE           CLUSTER-IP       EXTERNAL-IP                                                              PORT(S)        AGE
service/boardgame-ssvc   LoadBalancer   172.20.232.244   ab89f017a0d0c415a8d64e42810e63a4-389987165.us-east-1.elb.amazonaws.com   80:31107/TCP   27m
service/kubernetes       ClusterIP      172.20.0.1       <none>                                                                   443/TCP        64m

NAME                                   READY   UP-TO-DATE   AVAILABLE   AGE
deployment.apps/boardgame-deployment   2/2     2            2           27m

NAME                                             DESIRED   CURRENT   READY   AGE
replicaset.apps/boardgame-deployment-99f486879   2         2         2       27m
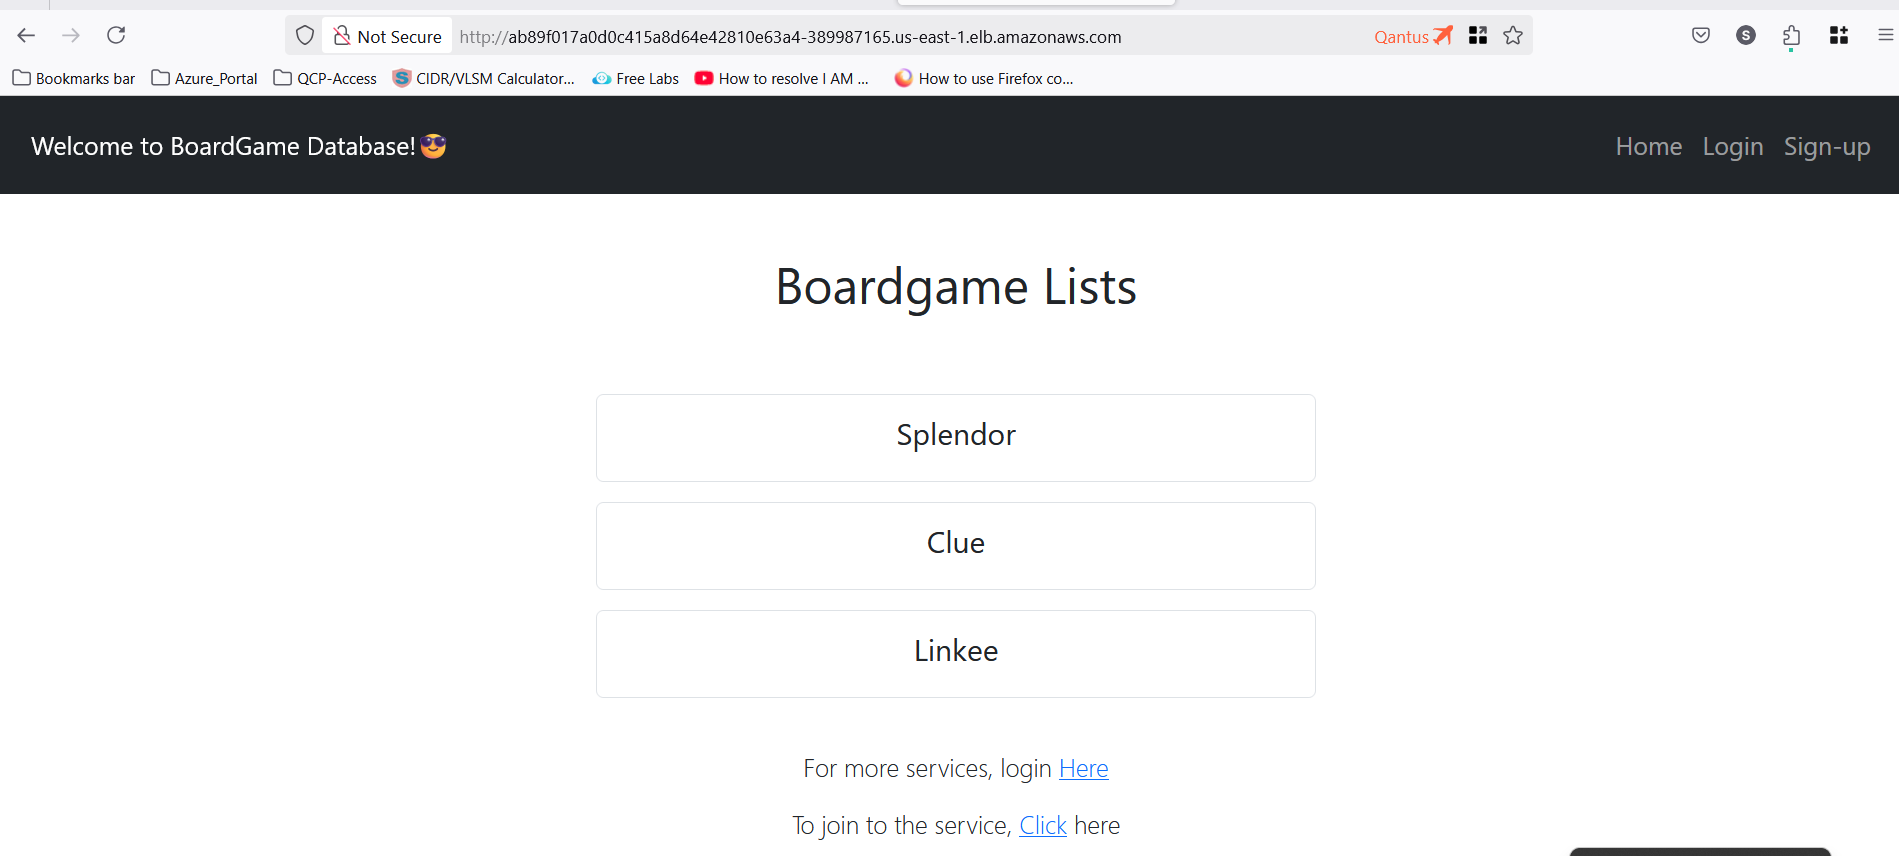
Verify Application Status
- Notedown the cluster IP address from above command and run it in browser.
Setup ArgoCD
- Run the following commands to verify the
Podsandservices typeinterraform EC2
kubectl get pods -n argocd
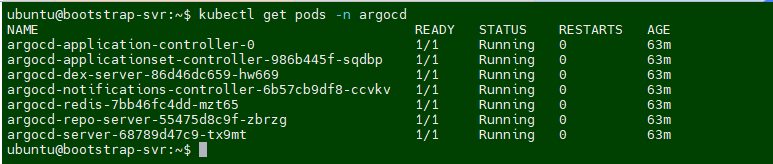
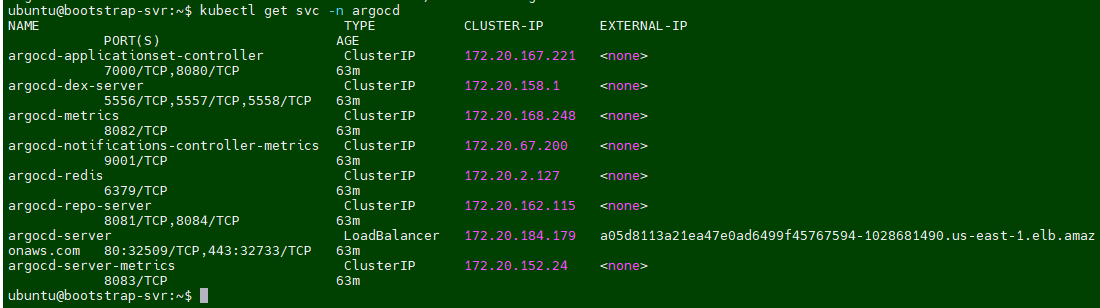
kubectl get svc -n argocd
kubectl get pods -n prometheus
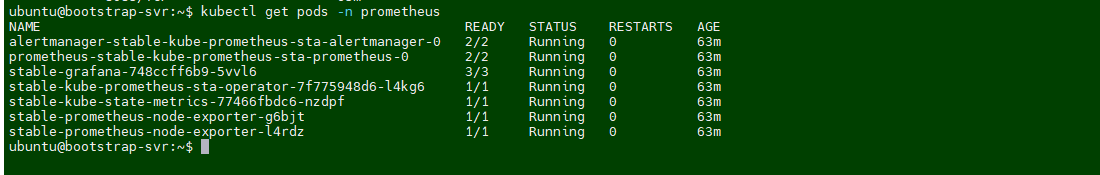
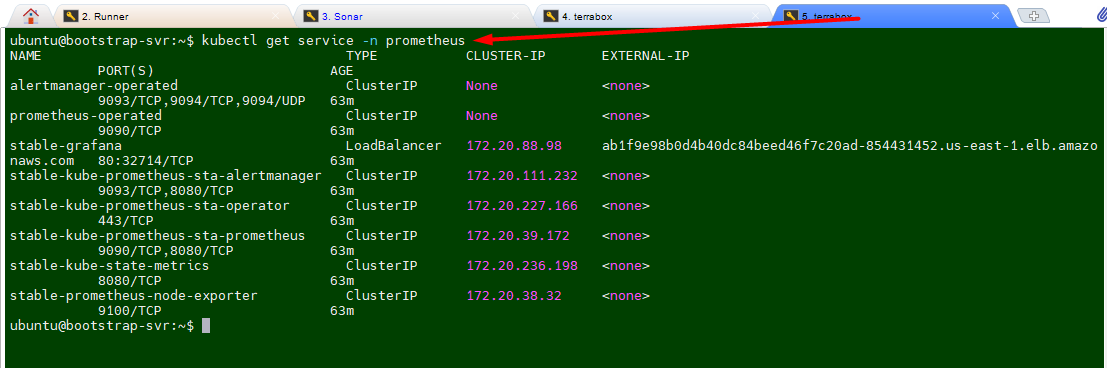
kubectl get service -n prometheus
- validate
ArgoCDandGrafanaaccess on browser.
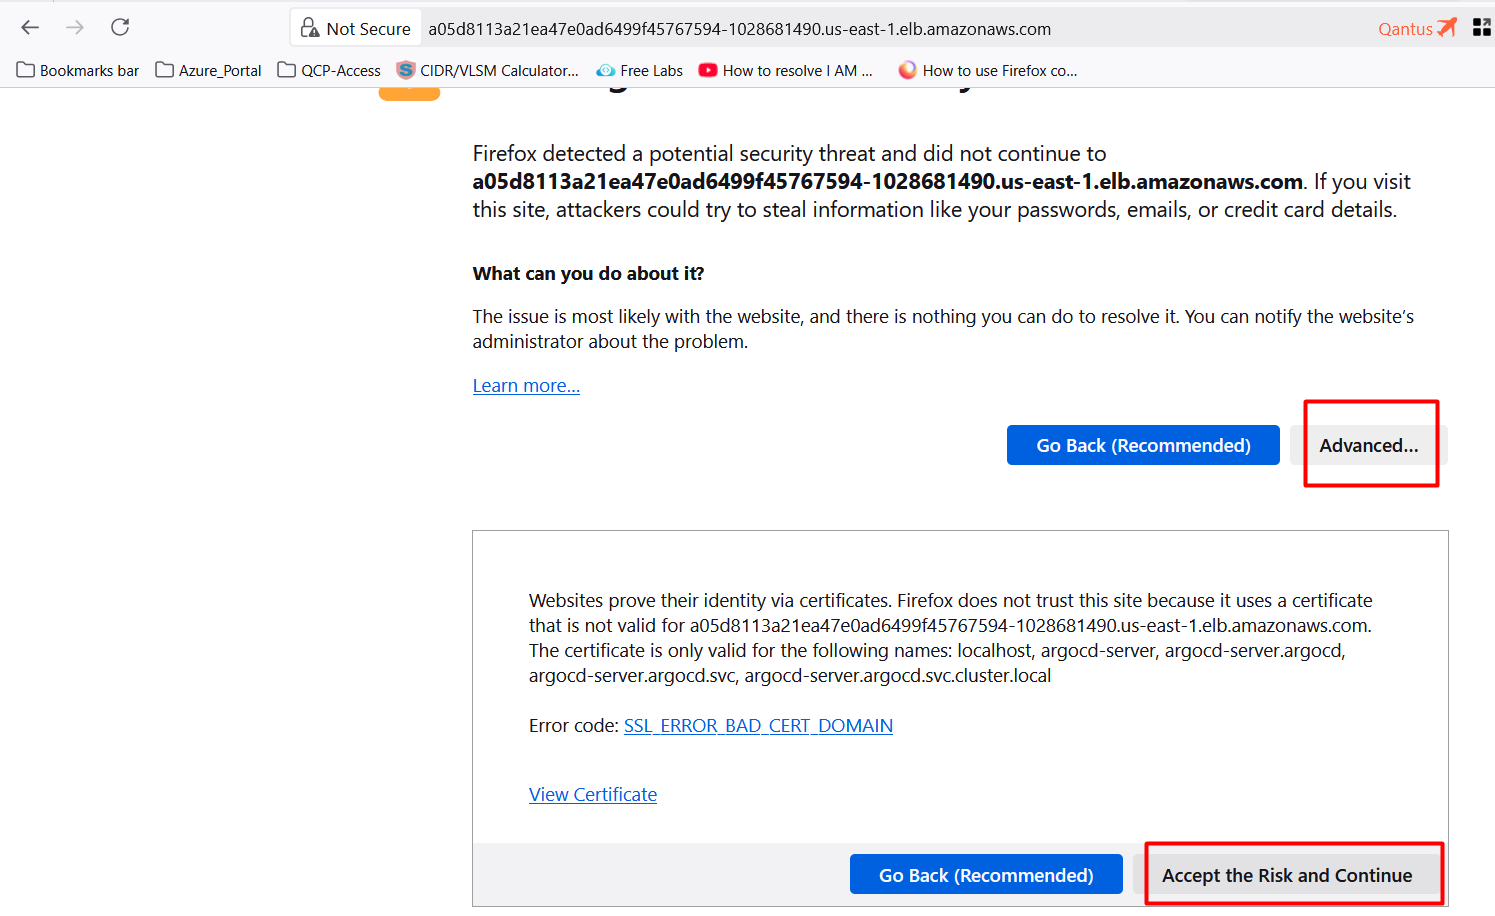
Access ArgoCD
run the following command to get URL of ArgoCD
ubuntu@bootstrap-svr:~$ kubectl get svc -n argocd
NAME                                      TYPE           CLUSTER-IP       EXTERNAL-IP                                                               PORT(S)                      AGE
argocd-applicationset-controller          ClusterIP      172.20.167.221   <none>                                                                    7000/TCP,8080/TCP            66m
argocd-dex-server                         ClusterIP      172.20.158.1     <none>                                                                    5556/TCP,5557/TCP,5558/TCP   66m
argocd-metrics                            ClusterIP      172.20.168.248   <none>                                                                    8082/TCP                     66m
argocd-notifications-controller-metrics   ClusterIP      172.20.67.200    <none>                                                                    9001/TCP                     66m
argocd-redis                              ClusterIP      172.20.2.127     <none>                                                                    6379/TCP                     66m
argocd-repo-server                        ClusterIP      172.20.162.115   <none>                                                                    8081/TCP,8084/TCP            66m
argocd-server                             LoadBalancer   172.20.184.179   a05d8113a21ea47e0ad6499f45767594-1028681490.us-east-1.elb.amazonaws.com   80:32509/TCP,443:32733/TCP   66m
argocd-server-metrics                     ClusterIP      172.20.152.24    <none>                                                                    8083/TCP                     66m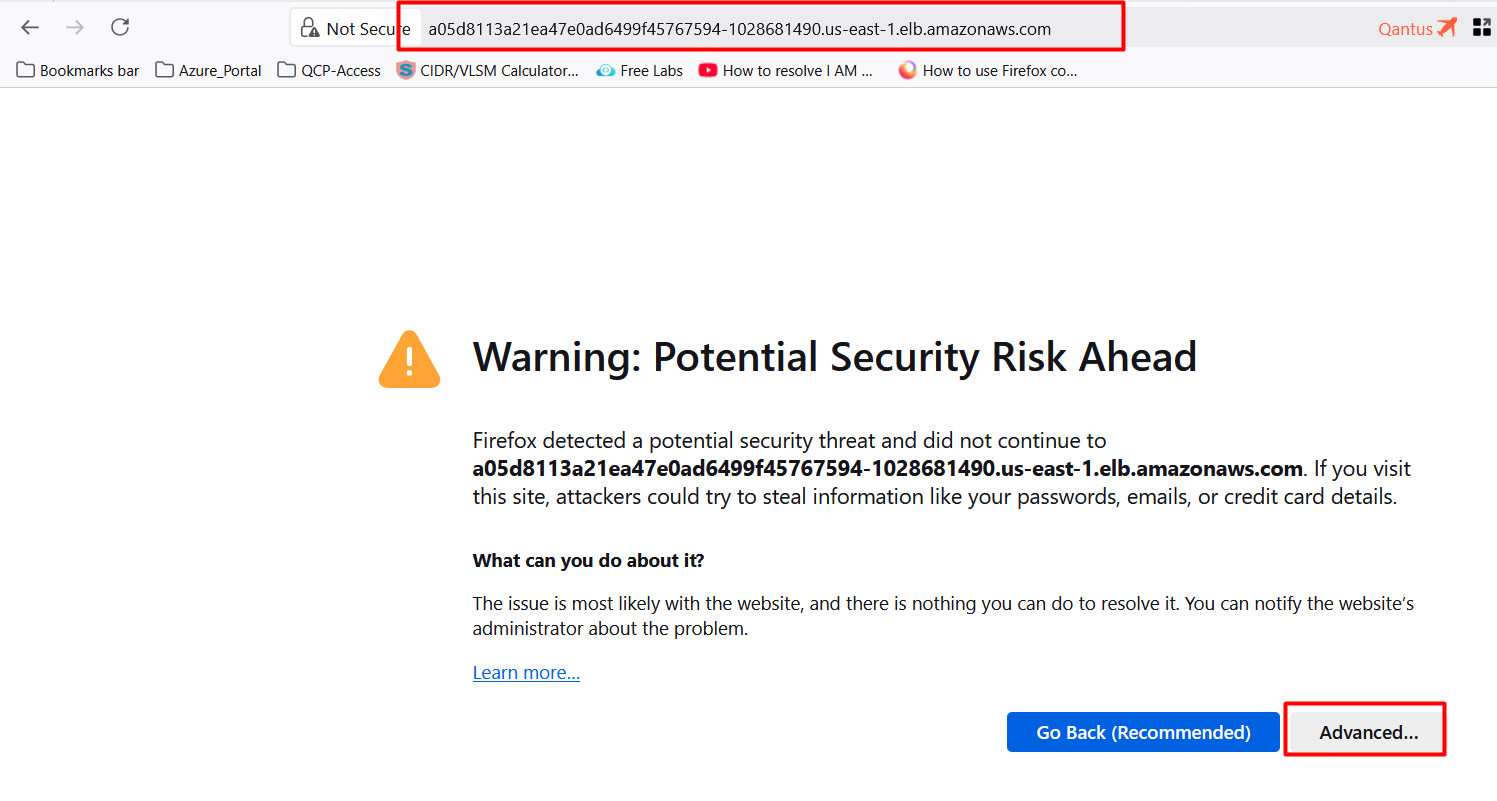
To get the login credential for argocd.
tail -n 200 /var/log/cloud-init-output.log | grep "ArgoCD Initial Password"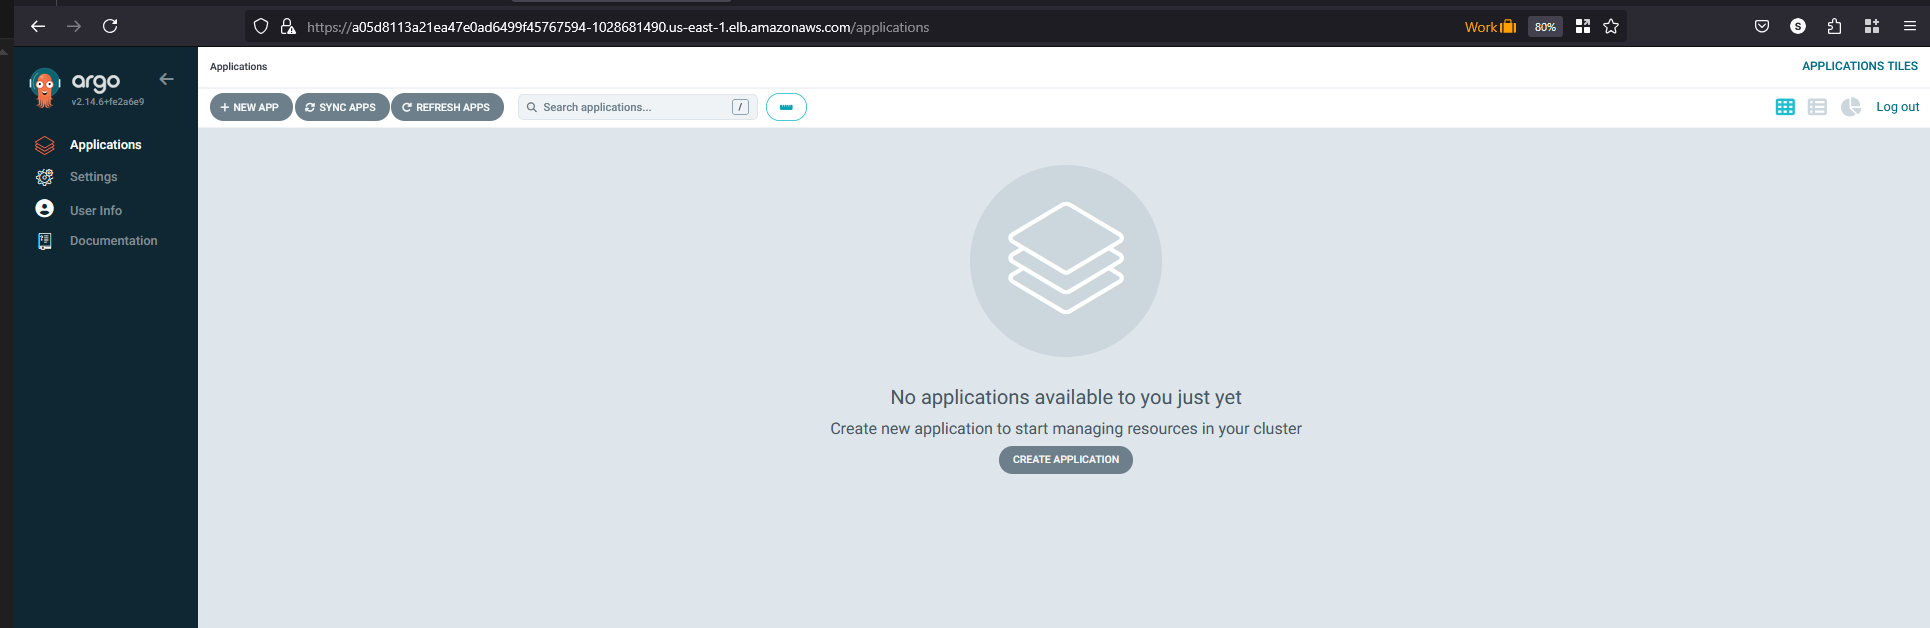
Configure Application in ArgoCD
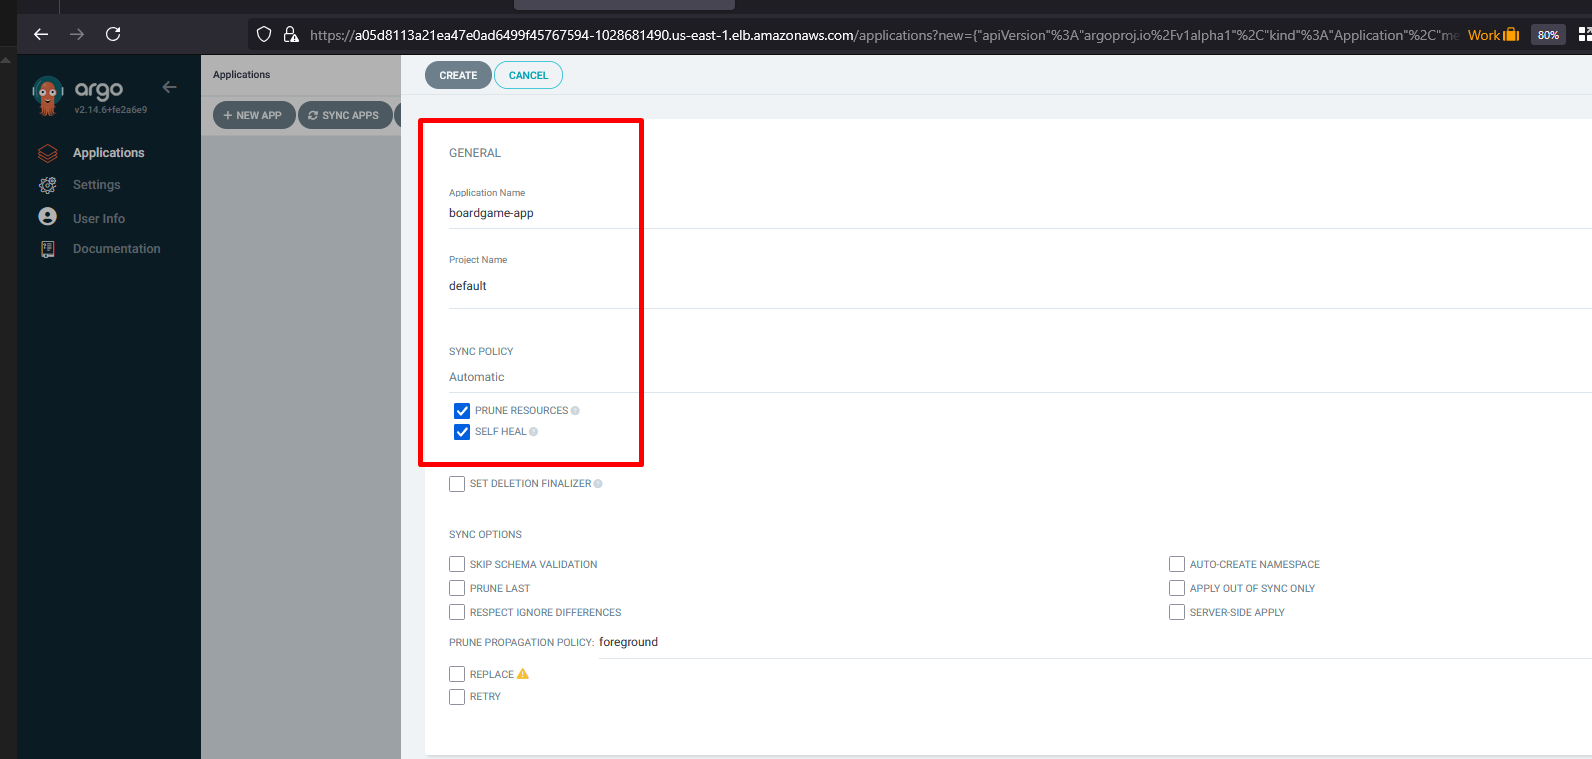
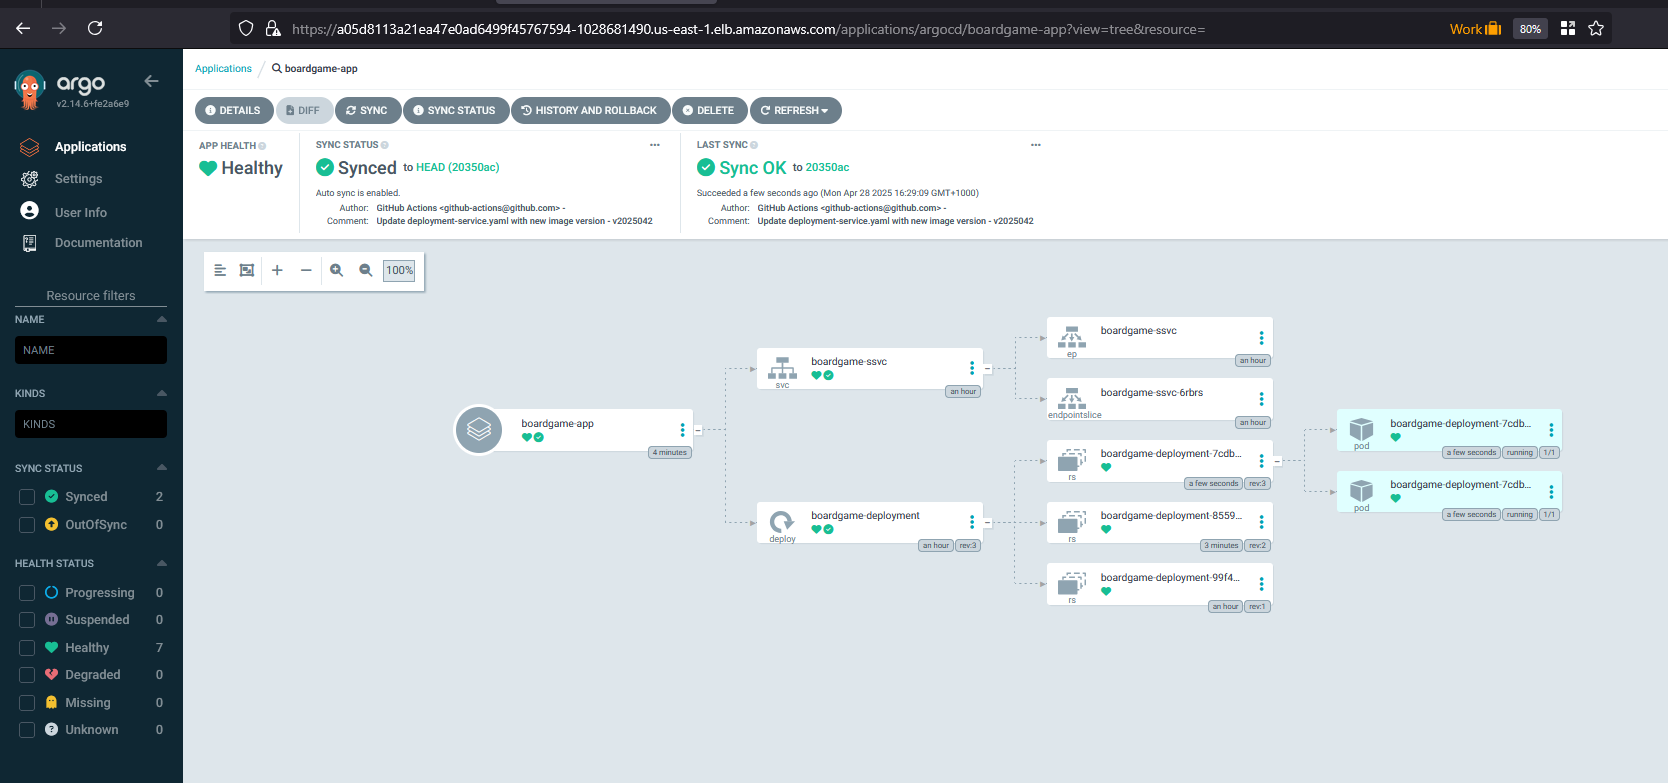
Once you access the ArgoCD URL and create an application
- Application Name: boardgame-app
- Project Name: default
- Sync Policy: Automatic (Select Prune Resources and SelfHeal)
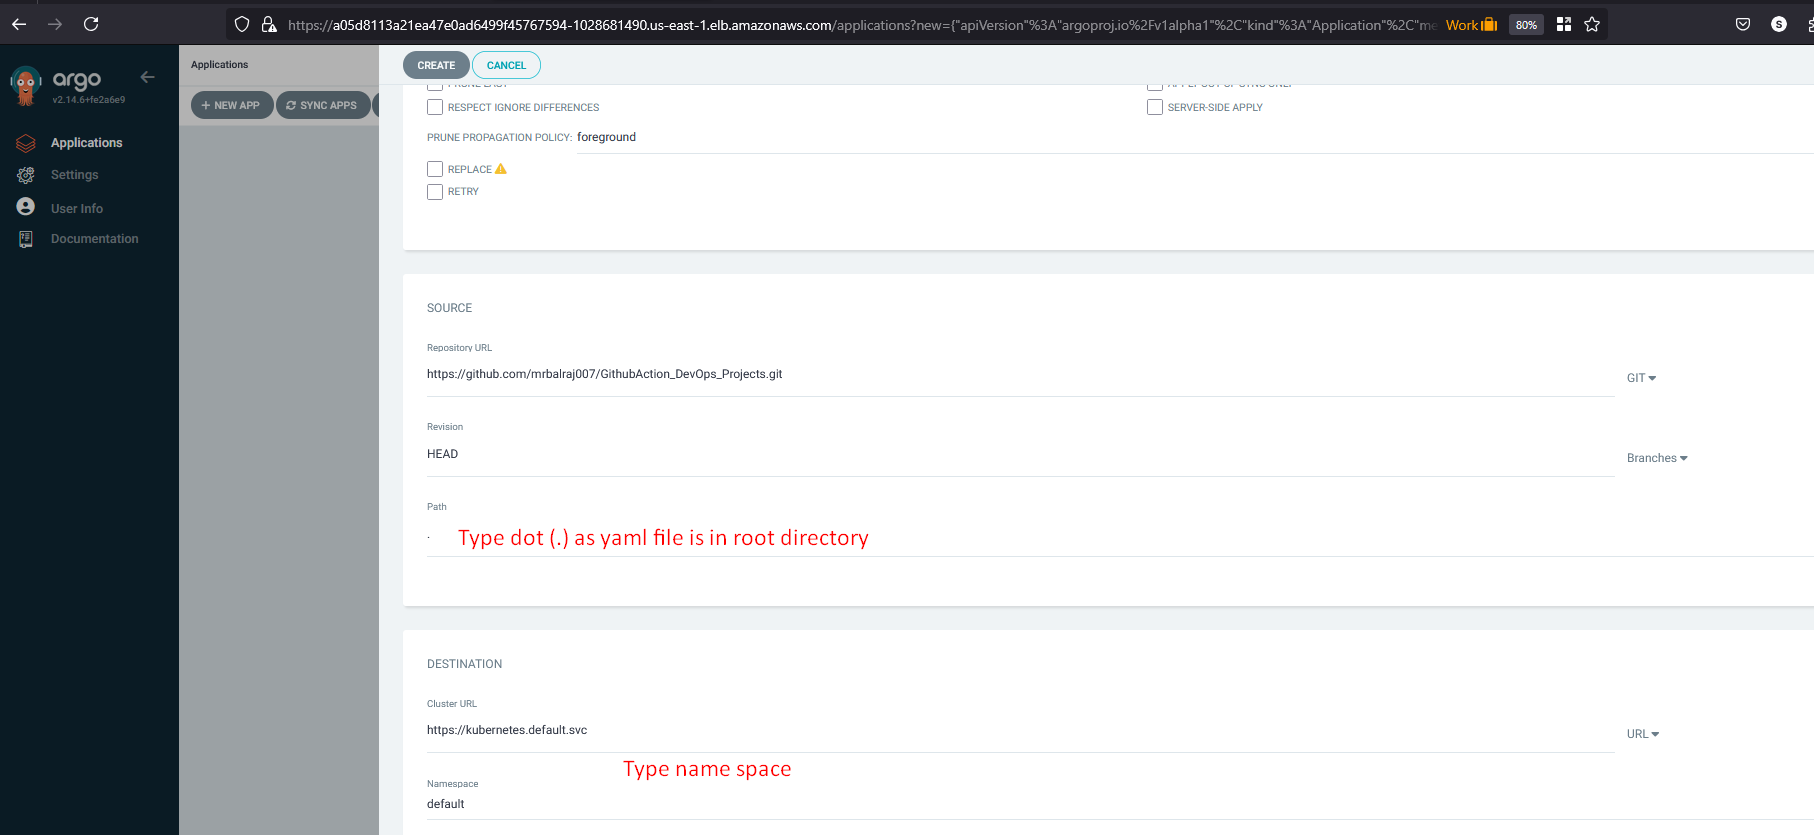
- Repository URL: https://github.com/mrbalraj007/GithubAction_DevOps_Projects.git
- Revison: main
- Path: . (where Kubernetes files reside)
- cluster URL: Select default cluster
- Namespace: default
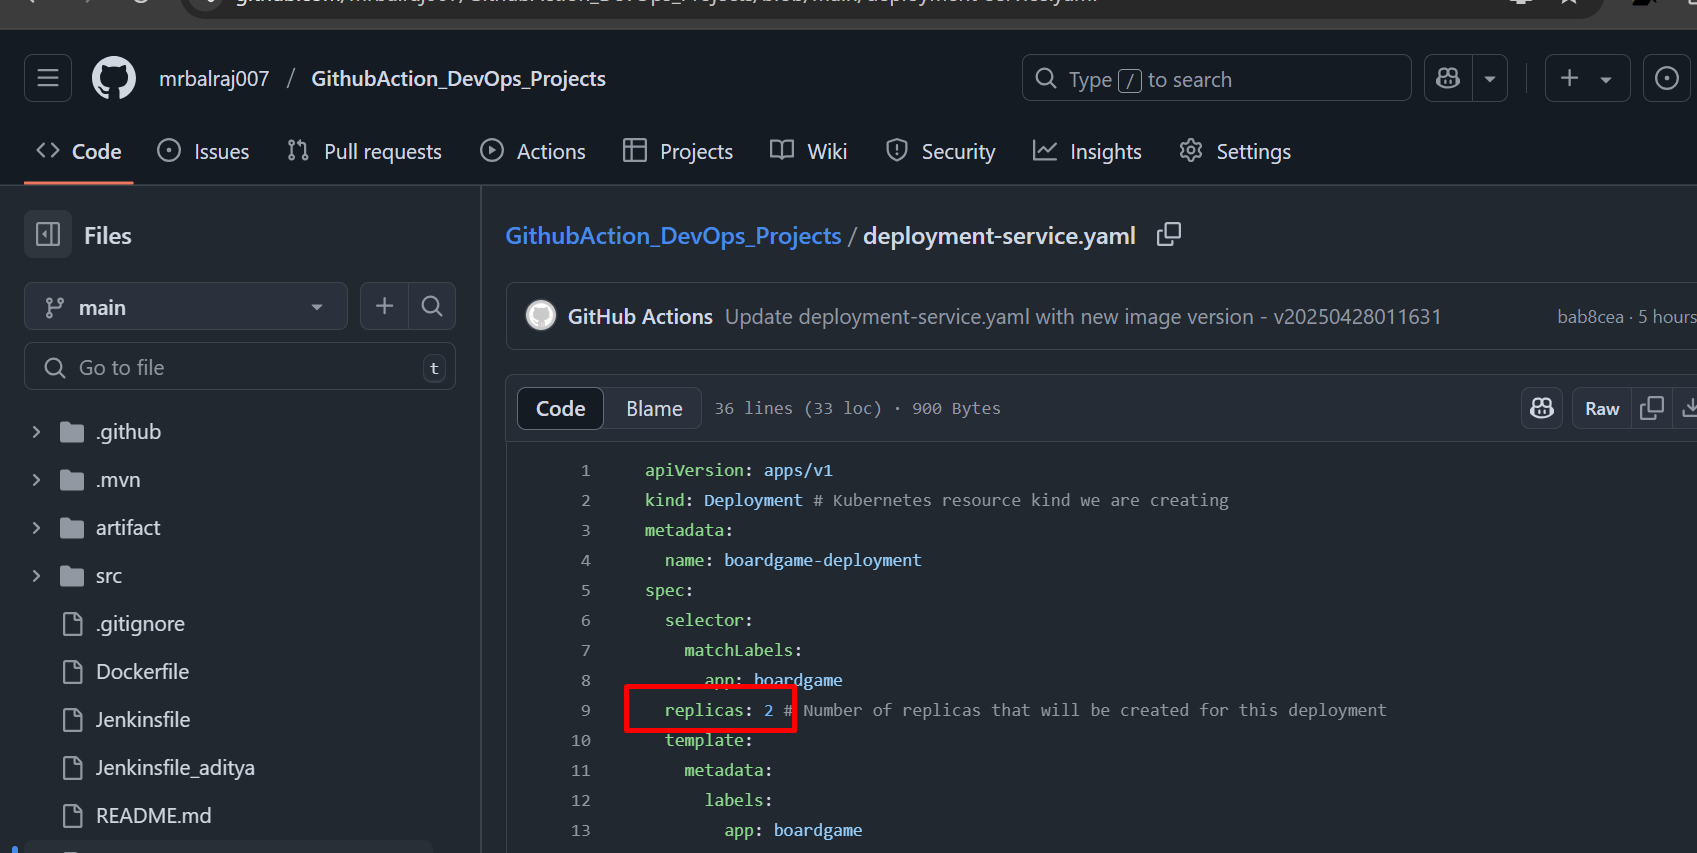
- Try to change something in
deployment.yml(i.e Replica to2from 5))
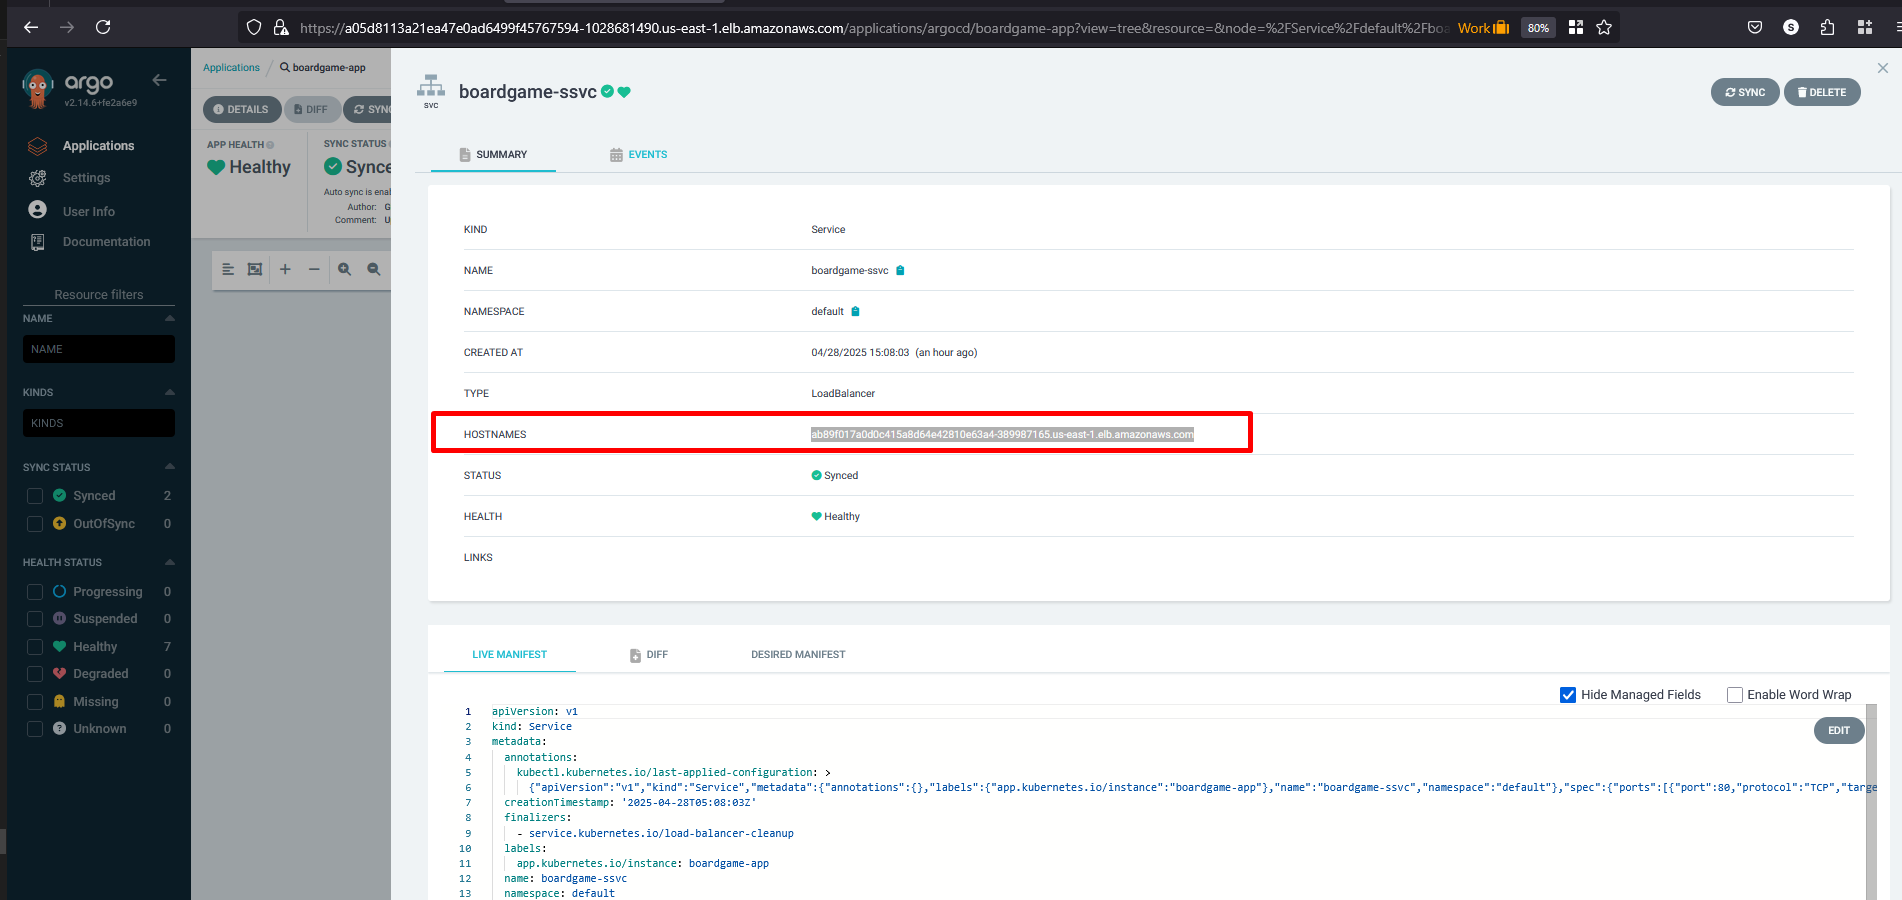
Verify the apps Status
Verify Pods & service status
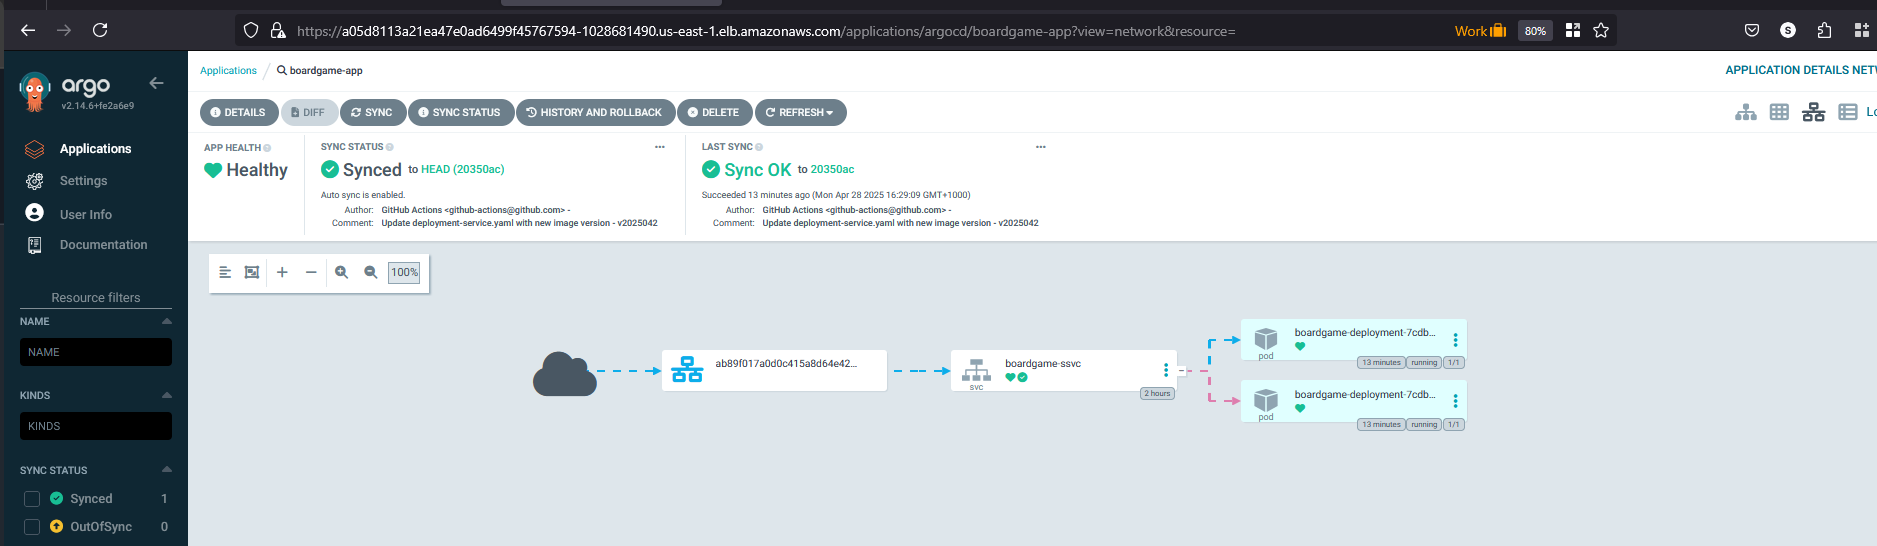
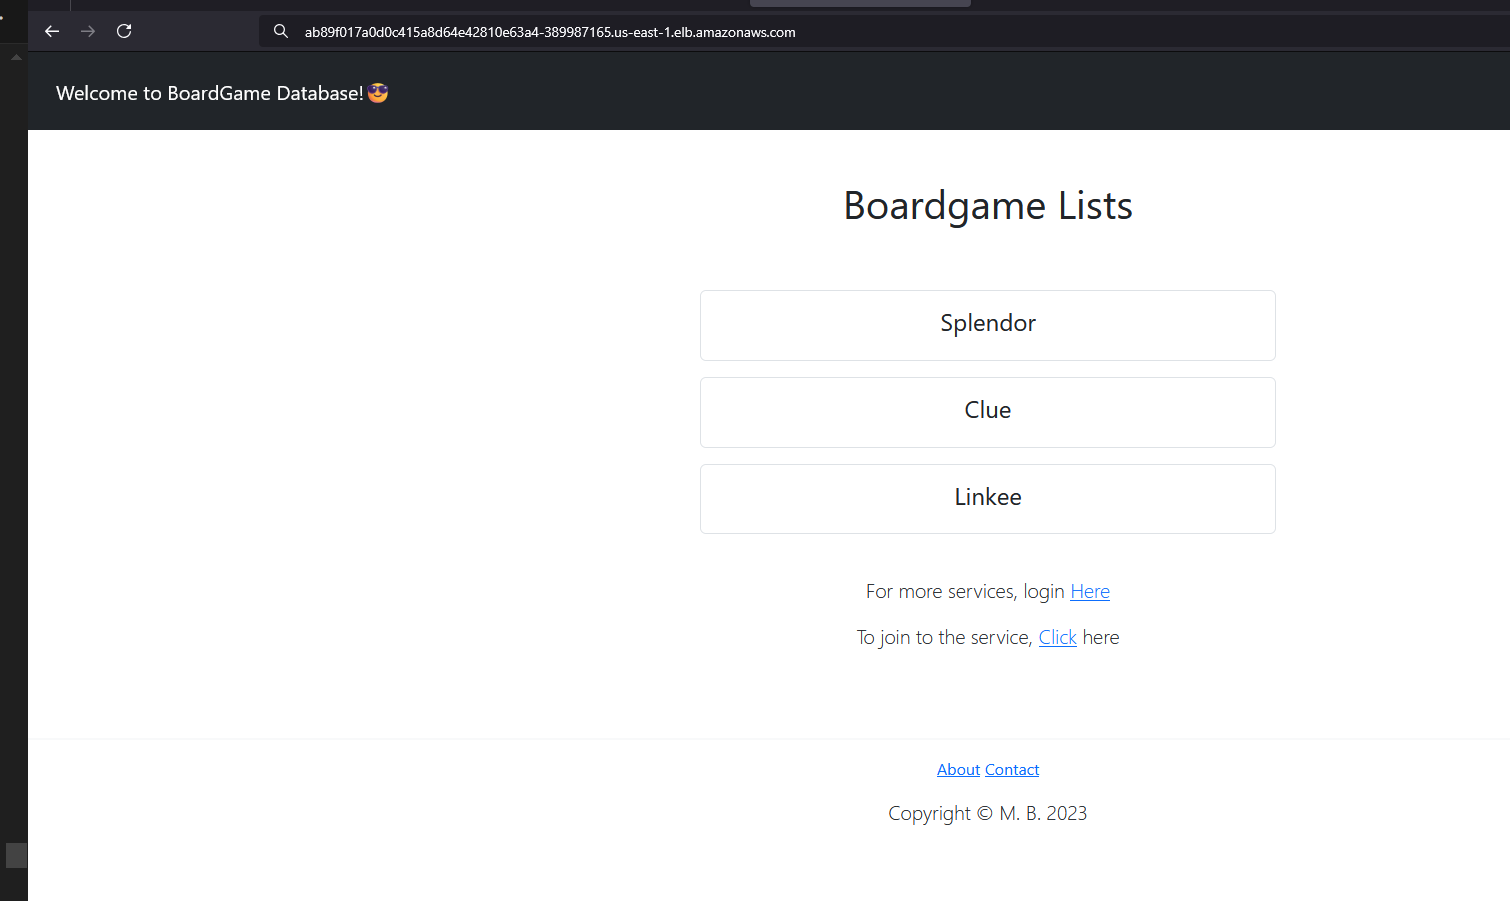
Click on the hostnames (URL details) from the service and access it in the browser.
ab89f017a0d0c415a8d64e42810e63a4-389987165.us-east-1.elb.amazonaws.com
Congratulations :-) the application is working and accessible.
Setup Monitoring using Prometheus/Grafana
Will run the following command to get a URL of Grafana
ubuntu@bootstrap-svr:~$ tail -n 200 /var/log/cloud-init-output.log | grep "You can access Grafana at: "
You can access Grafana at: http://ab1f9e98b0d4b40dc84beed46f7c20ad-854431452.us-east-1.elb.amazonaws.com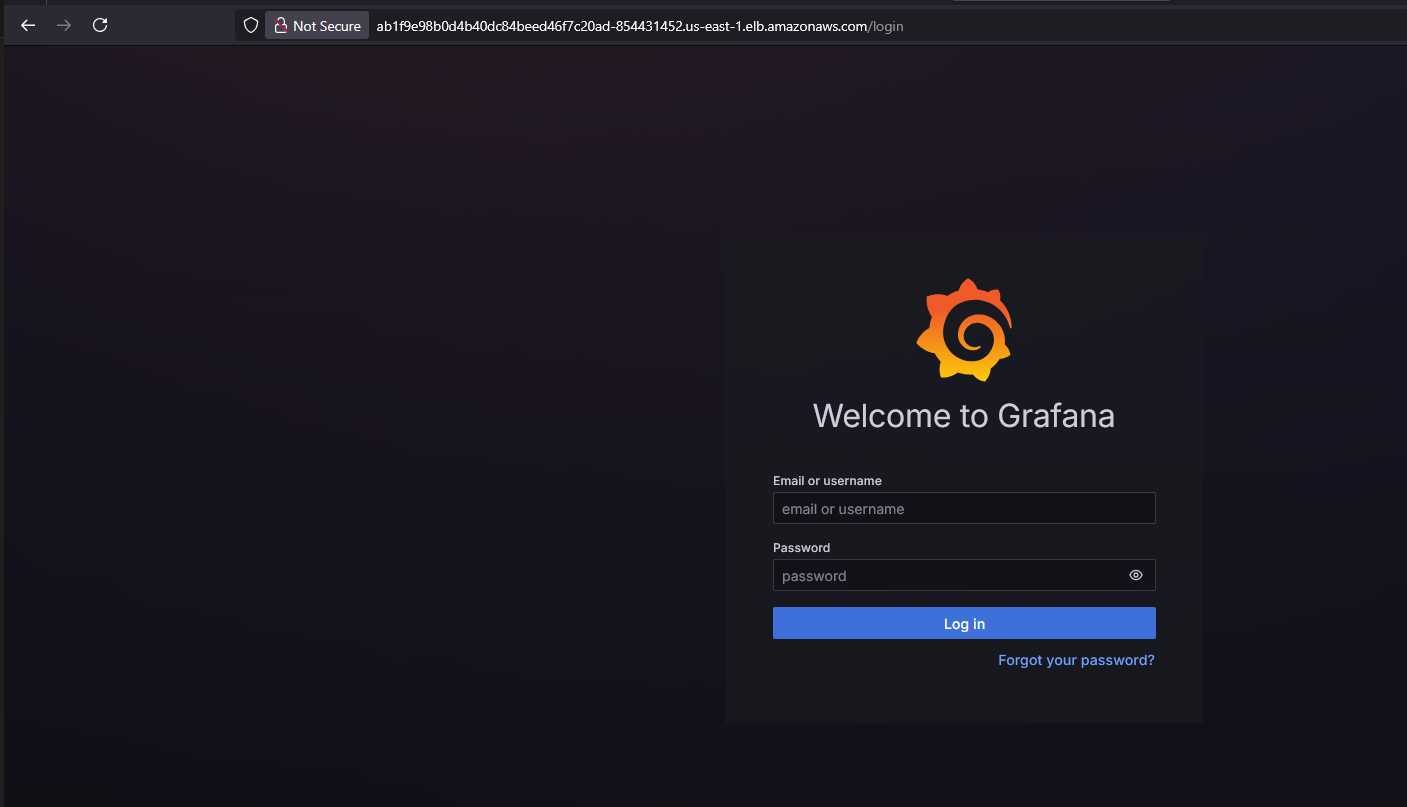
Get Grafana 'admin' user password by running:
kubectl --namespace prometheus get secrets stable-grafana -o jsonpath="{.data.admin-password}" | base64 -d ; echo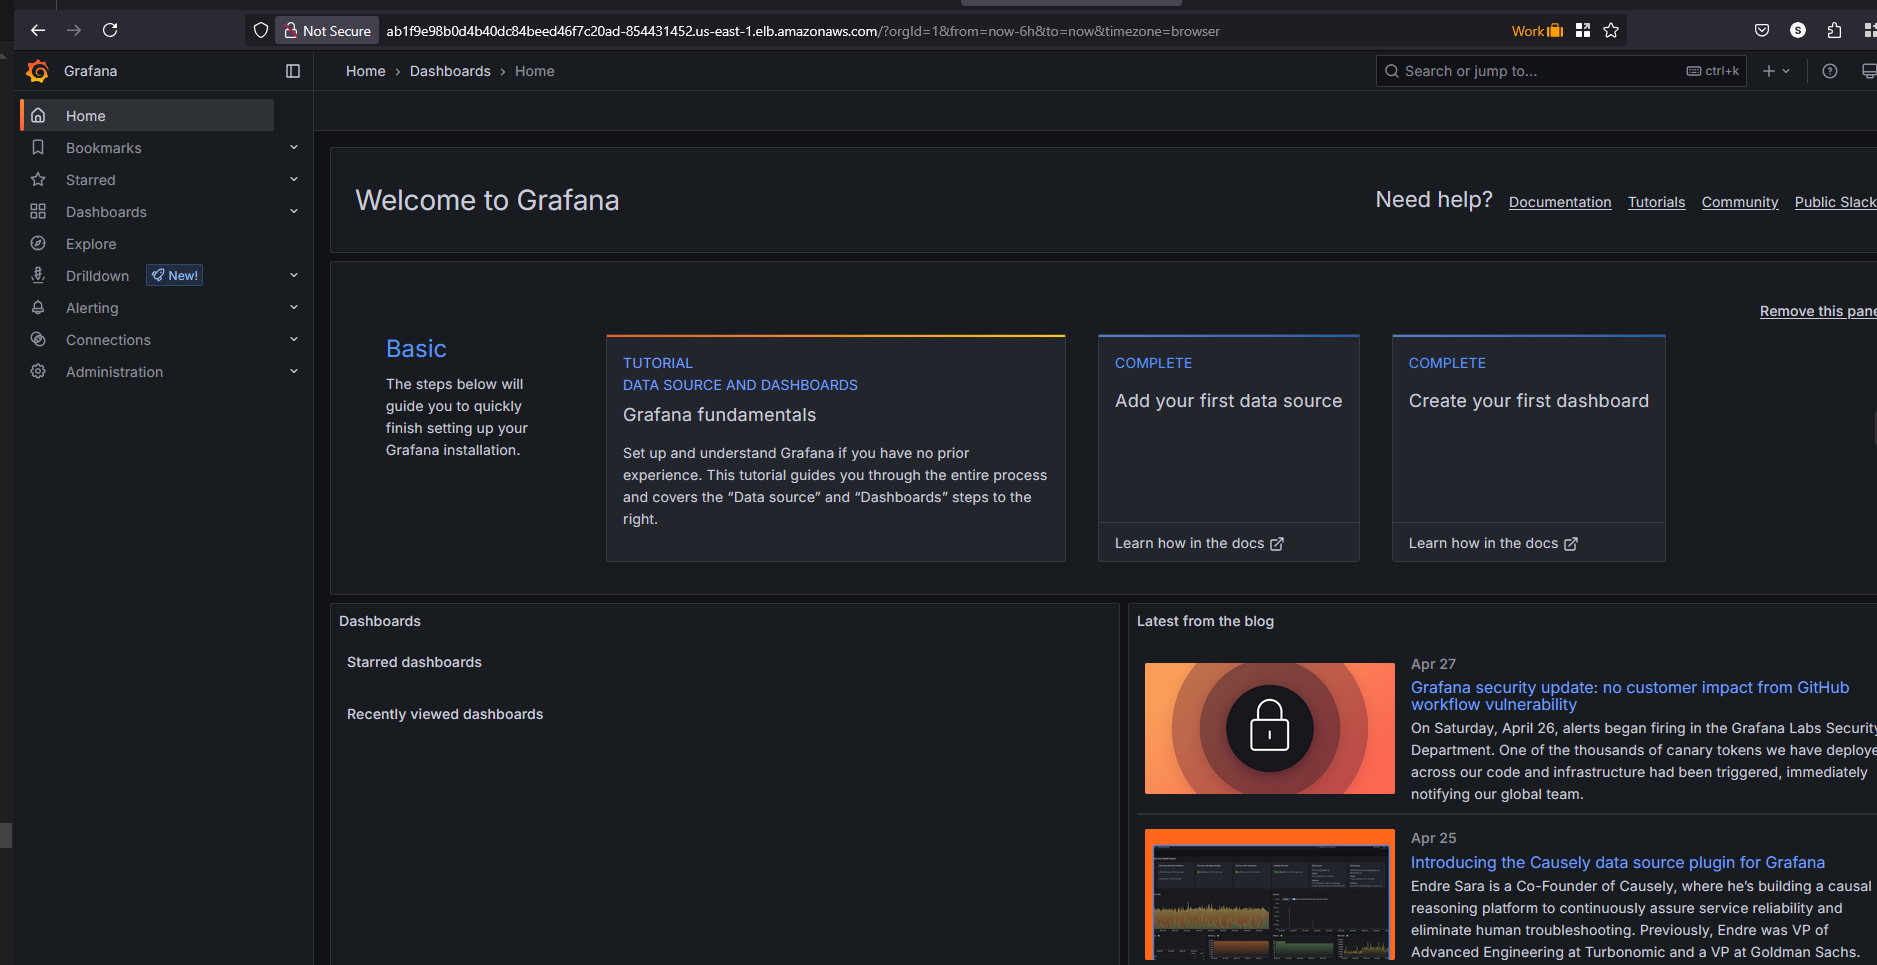
Access Prometheus/Grafana and create a custom dashboard in Prometheus/Grafana.
Dashboard in Grafana
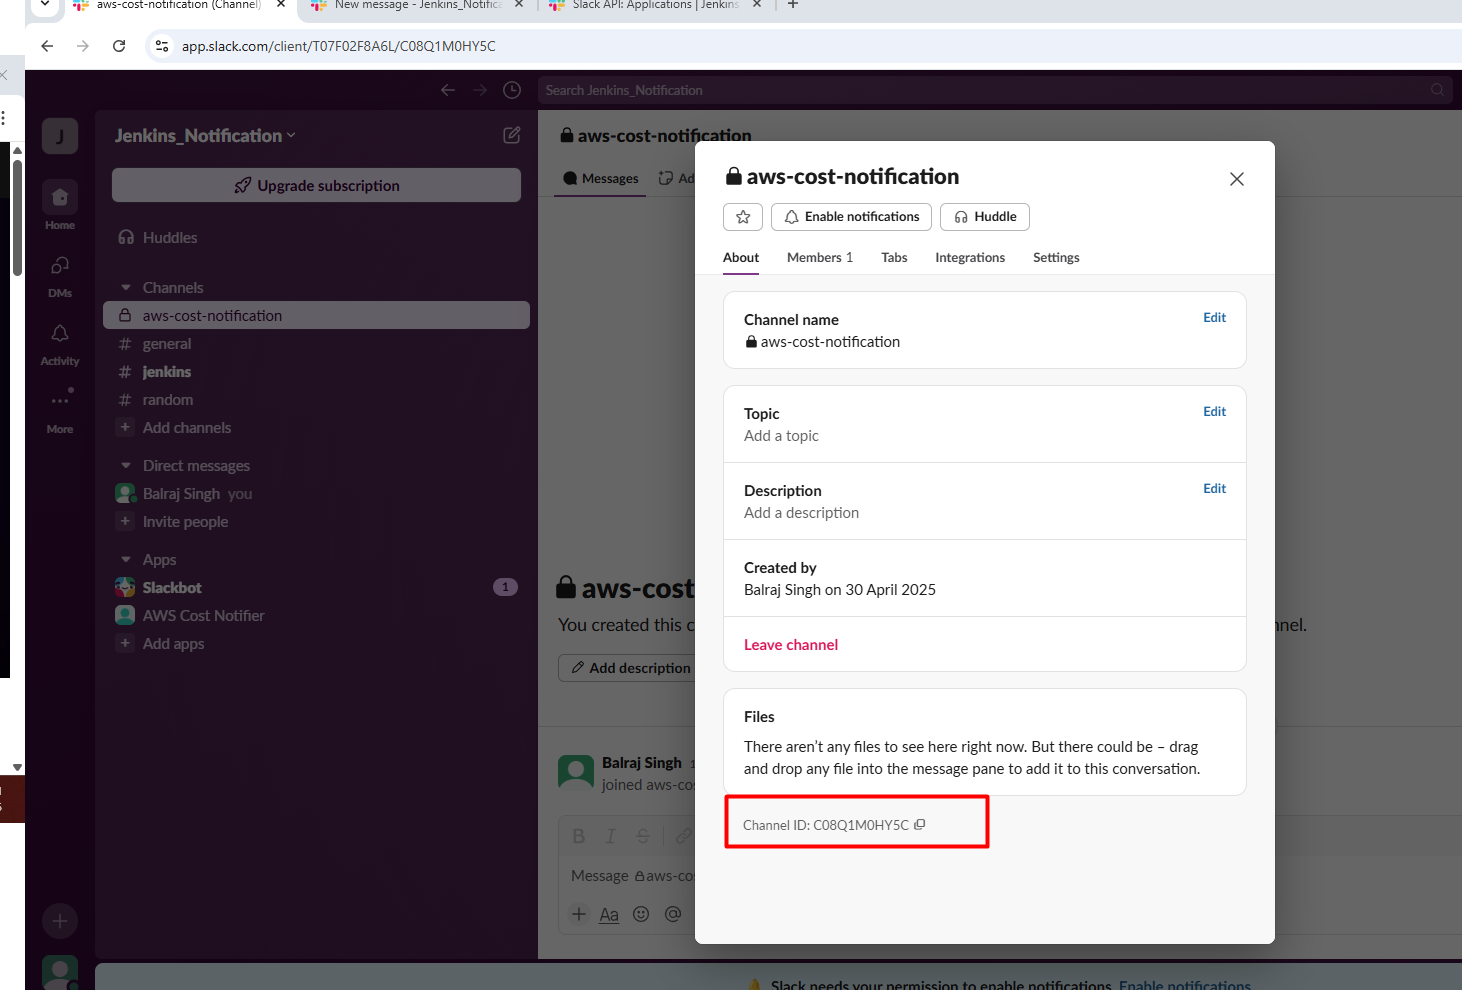
Setup Notification in Slack
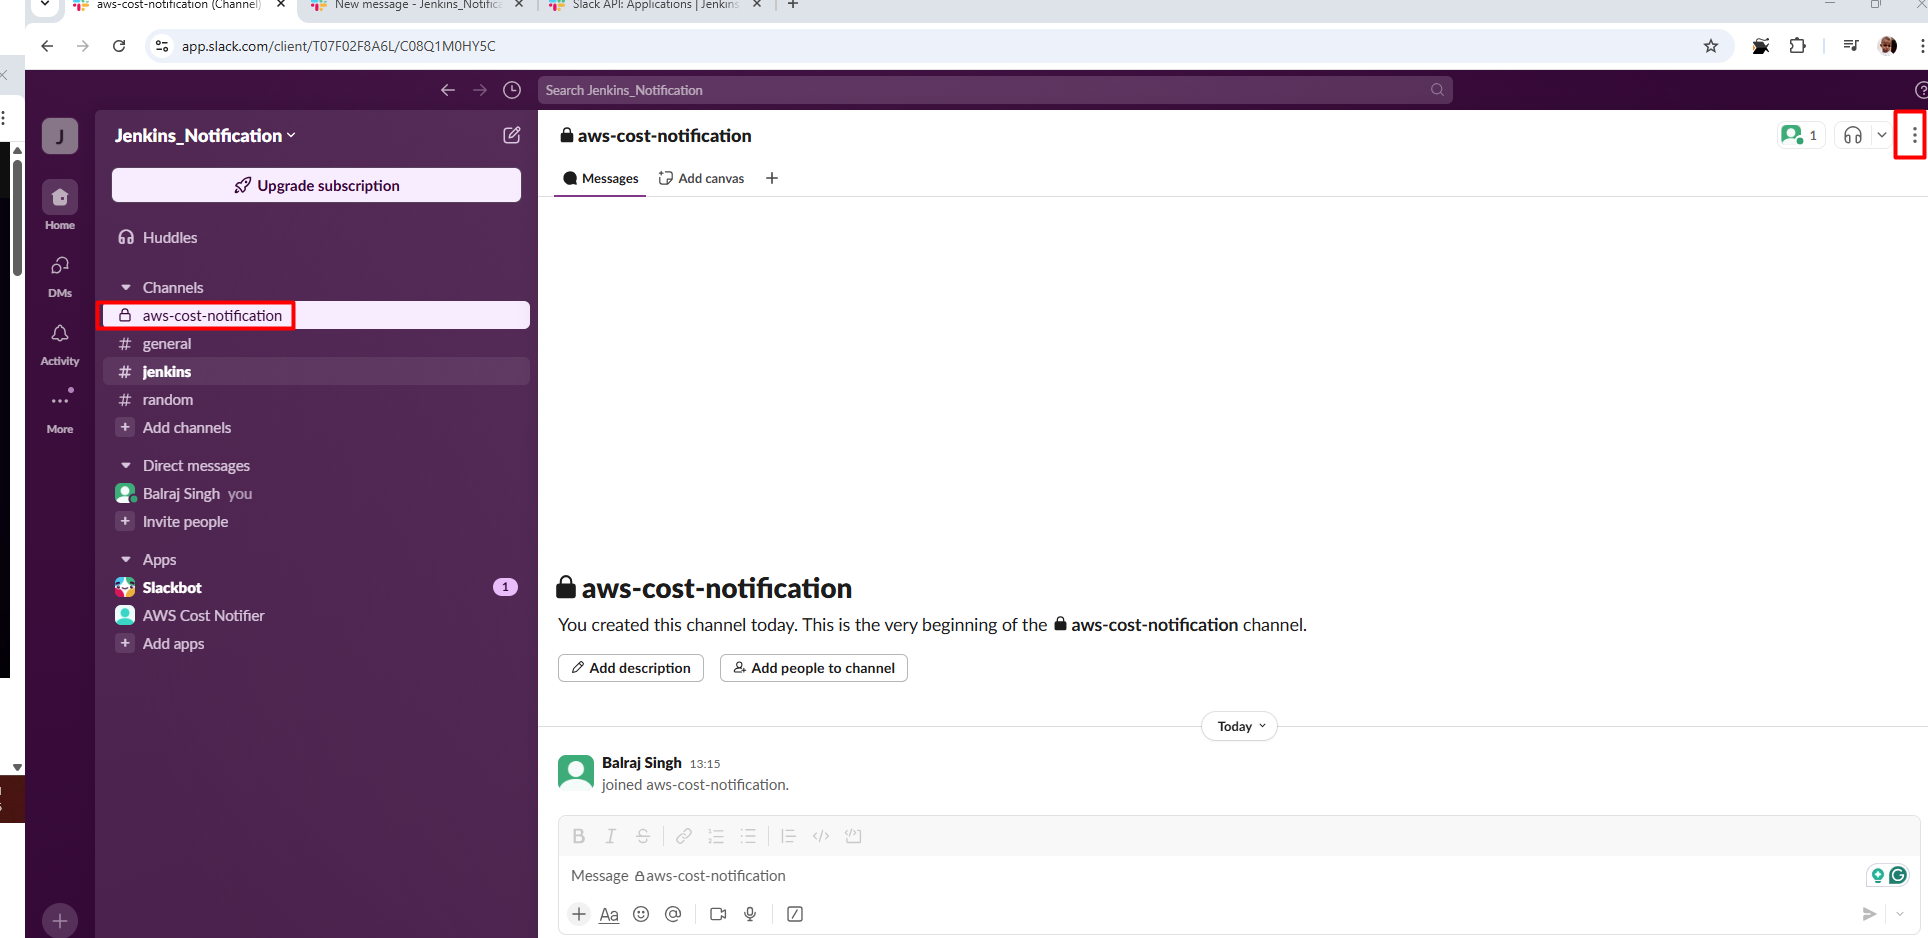
1. Create a channel for Slack
- Go to your Slack workspace and create a new channel
- Visit: https://api.slack.com/apps
- Click "Create New channel" > "From scratch"
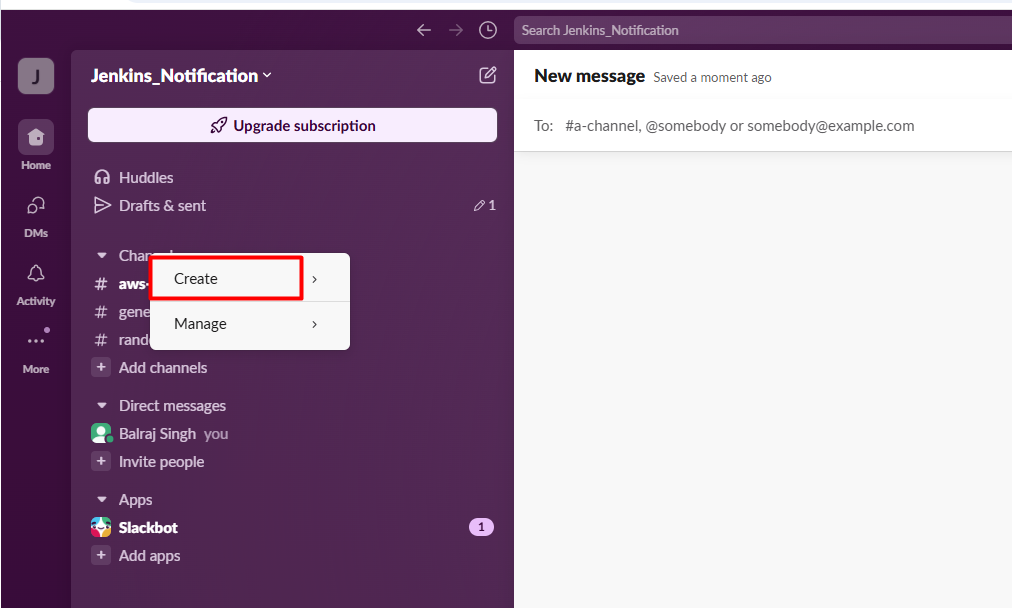
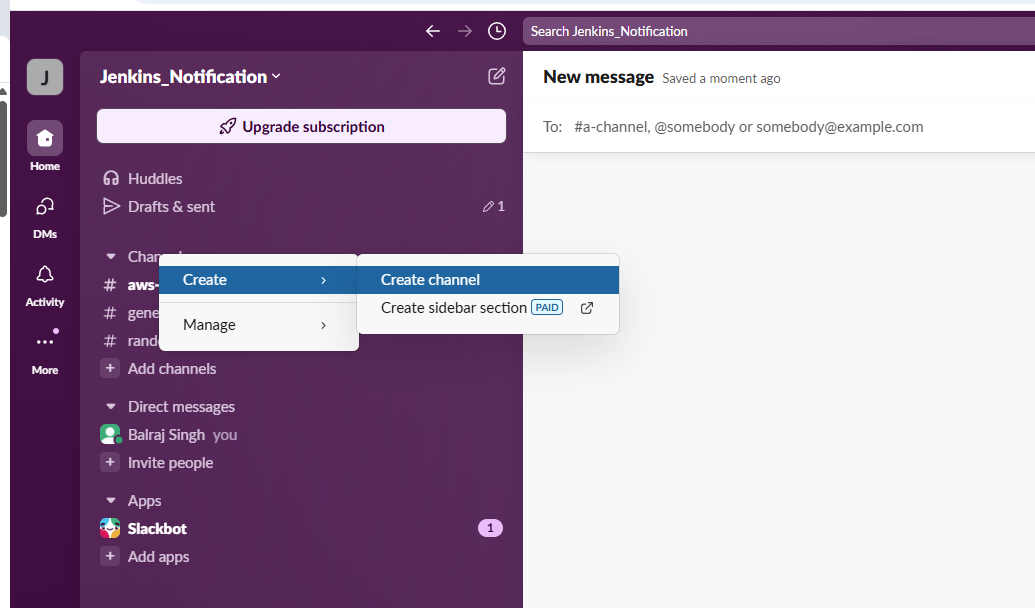
- Click on
Blank Channeland next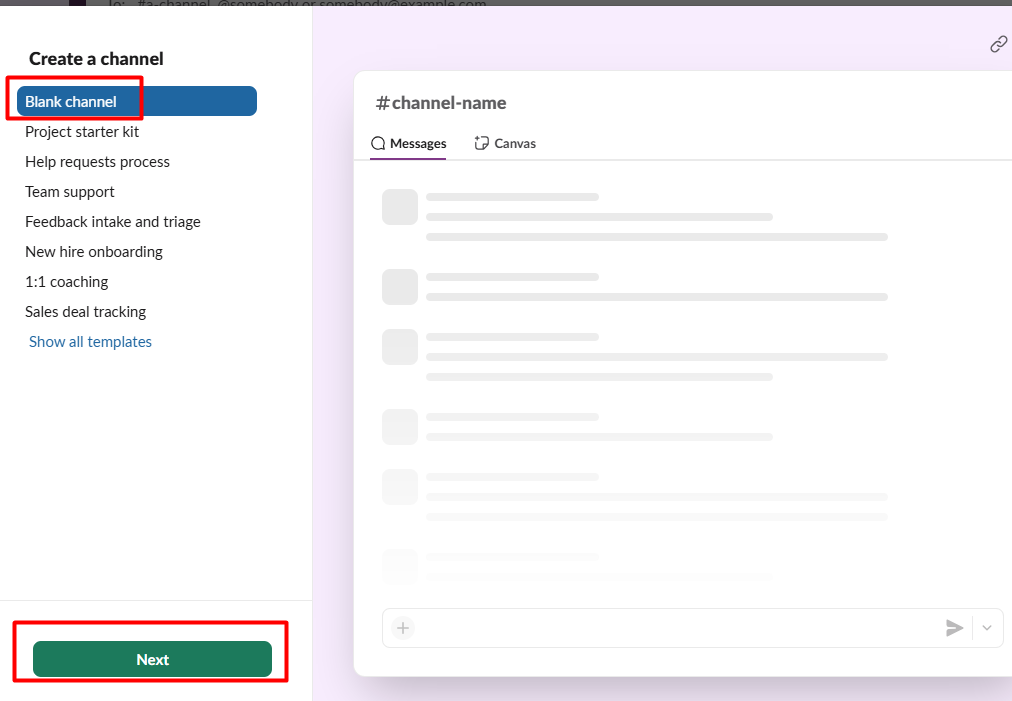
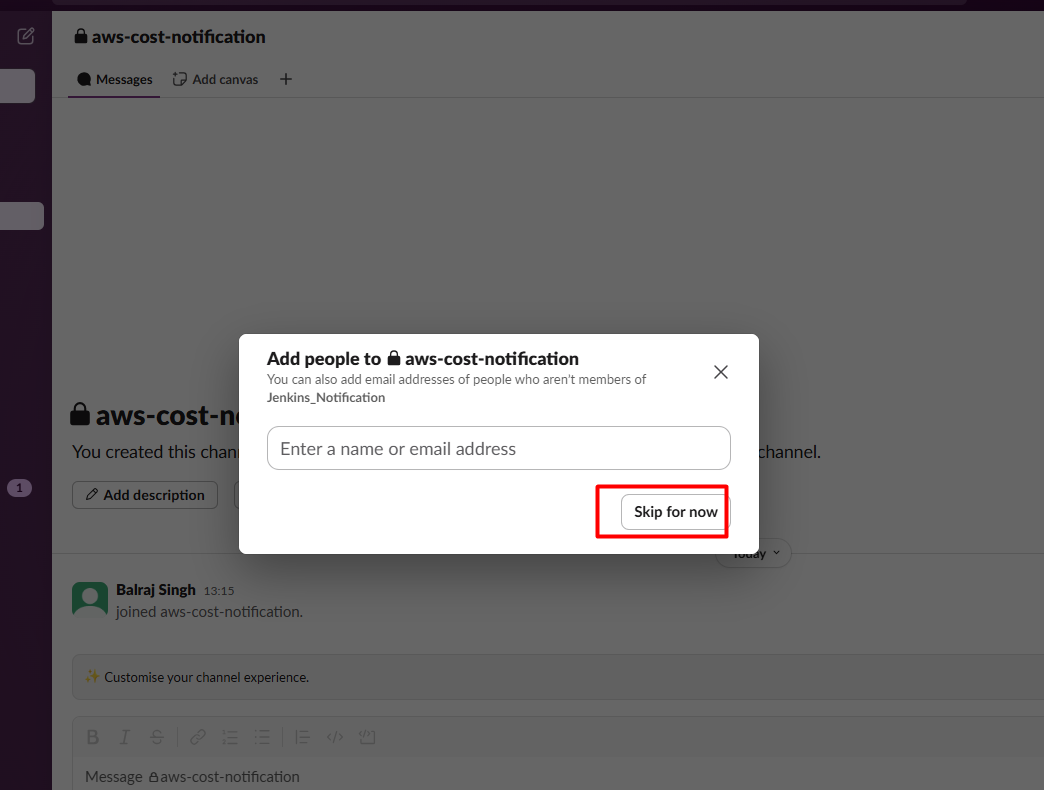
- Name your channel (e.g., "GitHub Actions Notifier") and select private and create it.
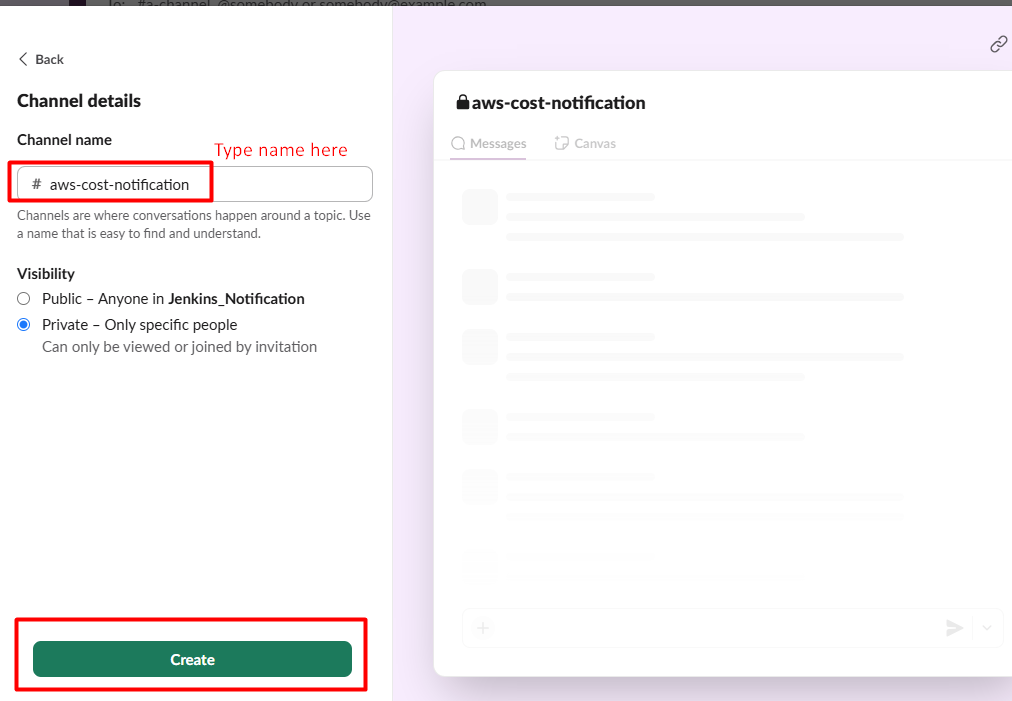
- It will ask for adding email address and skip for now.
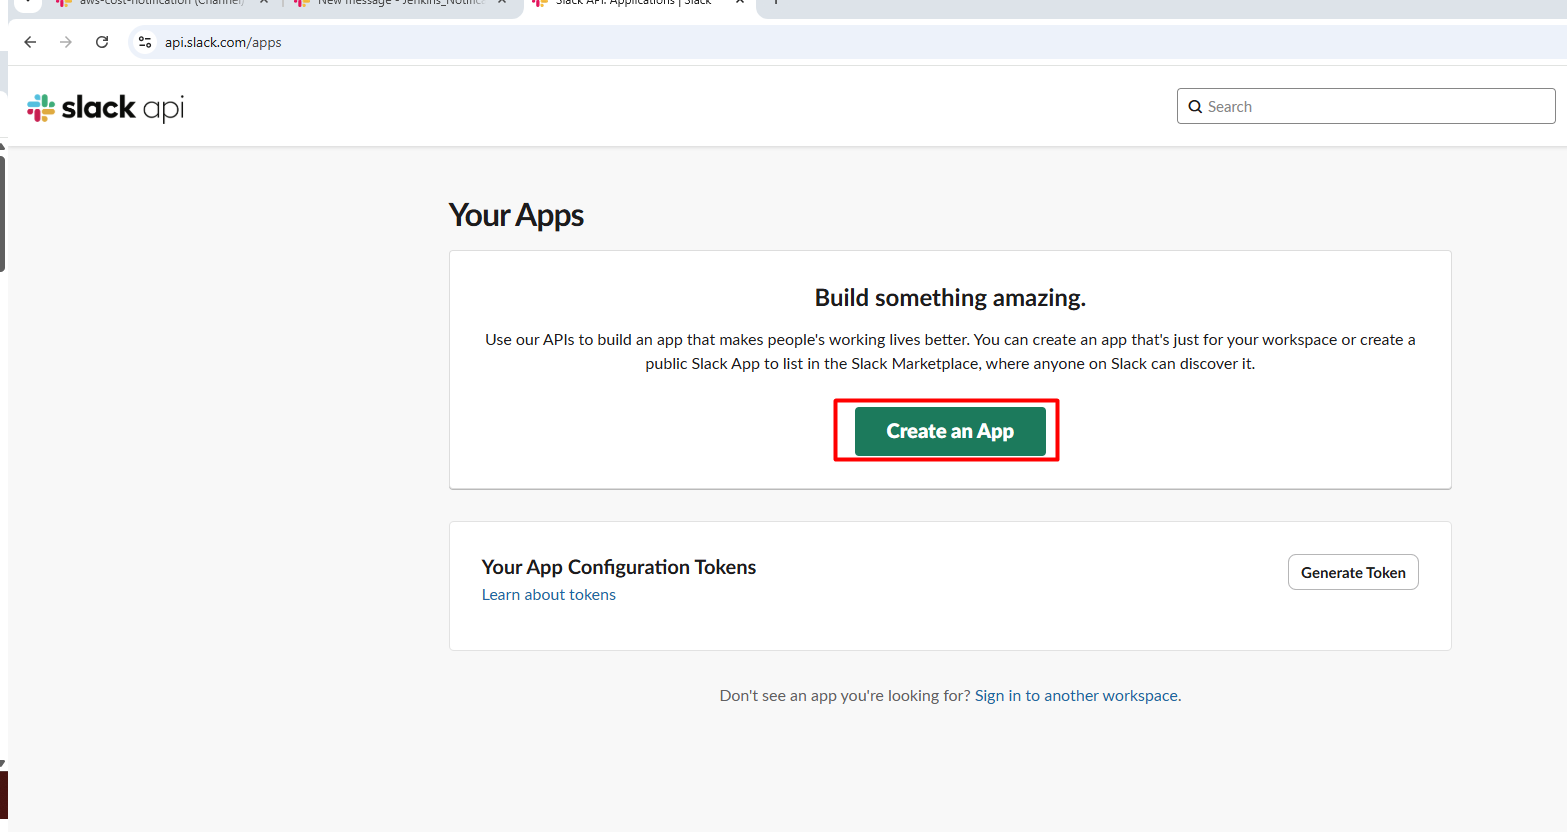
2. Create a app for Slack
- Go to your Slack workspace and create a new app (or use an existing one):
- Visit: https://api.slack.com/apps
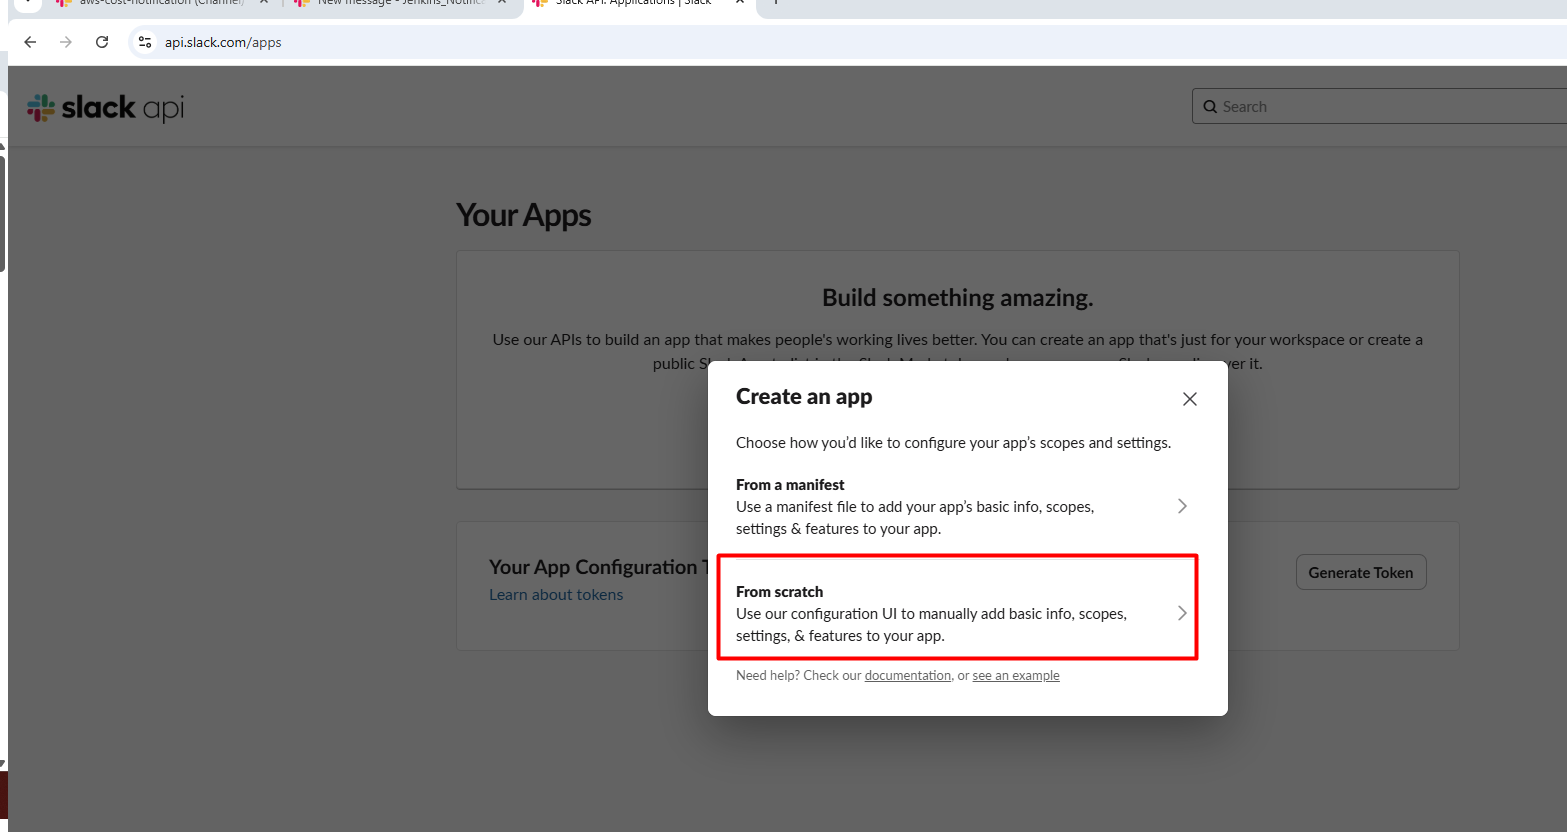
- Click "Create New App" > "From scratch"
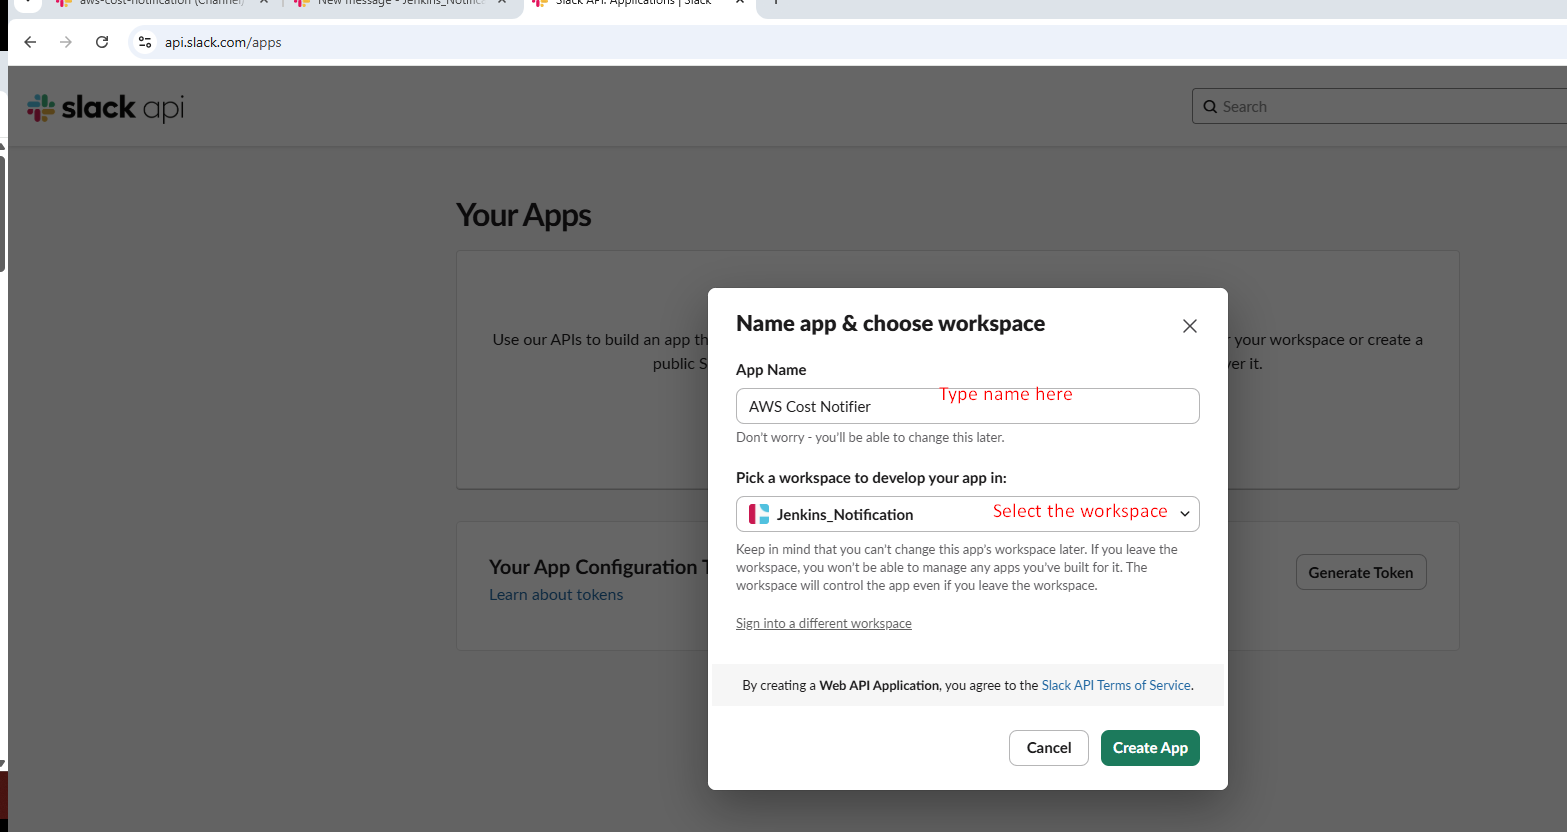
- Name your app (e.g., "GitHub Actions Notifier")
- Select your workspace i.e ("Jenkins_Notification")
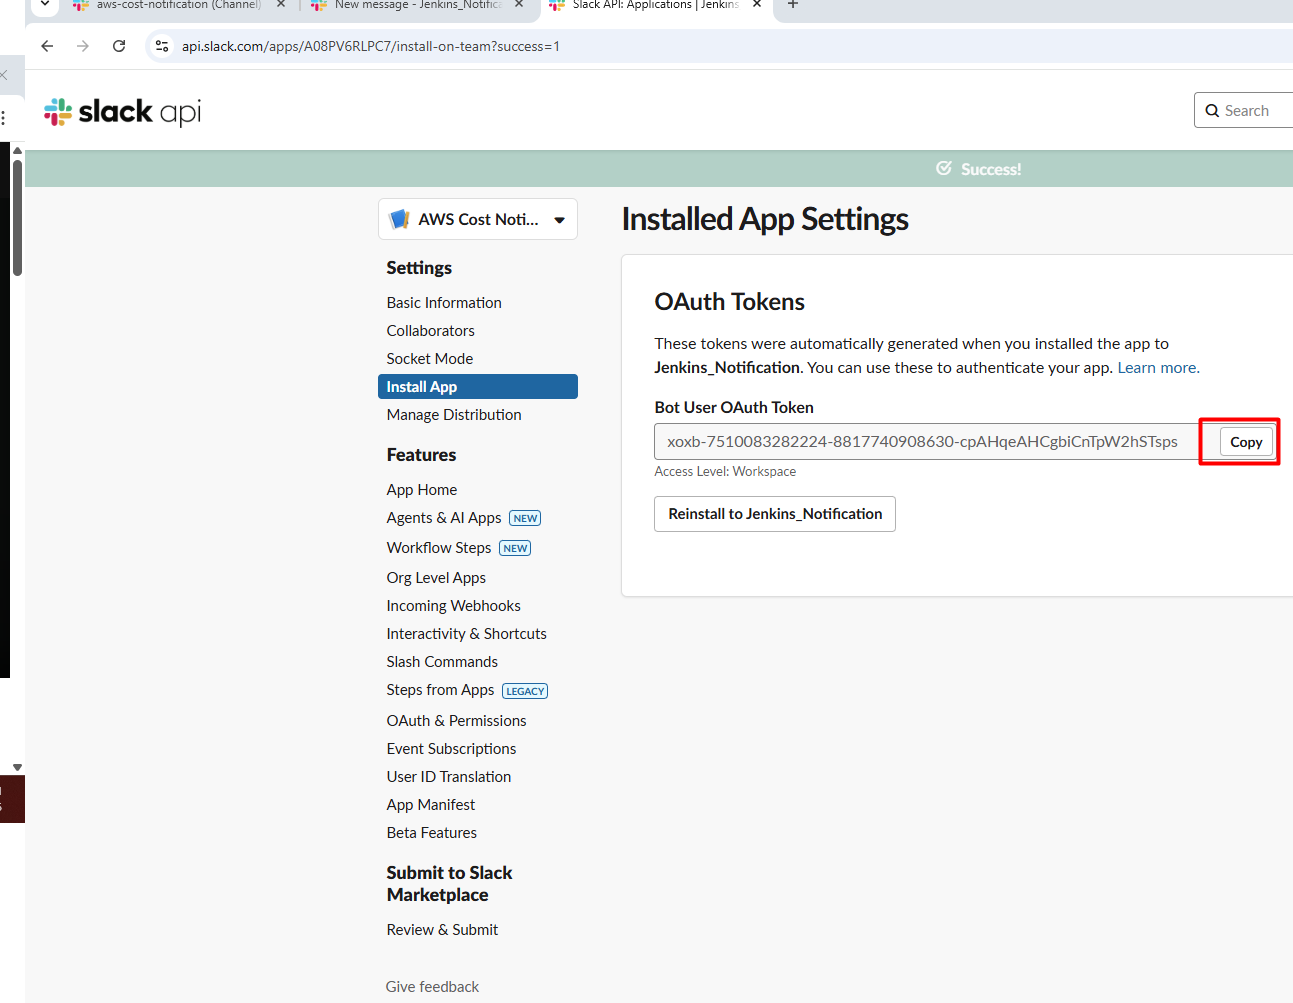
3. Set Slack App Permissions
- In your app dashboard:
- Go to OAuth & Permissions.
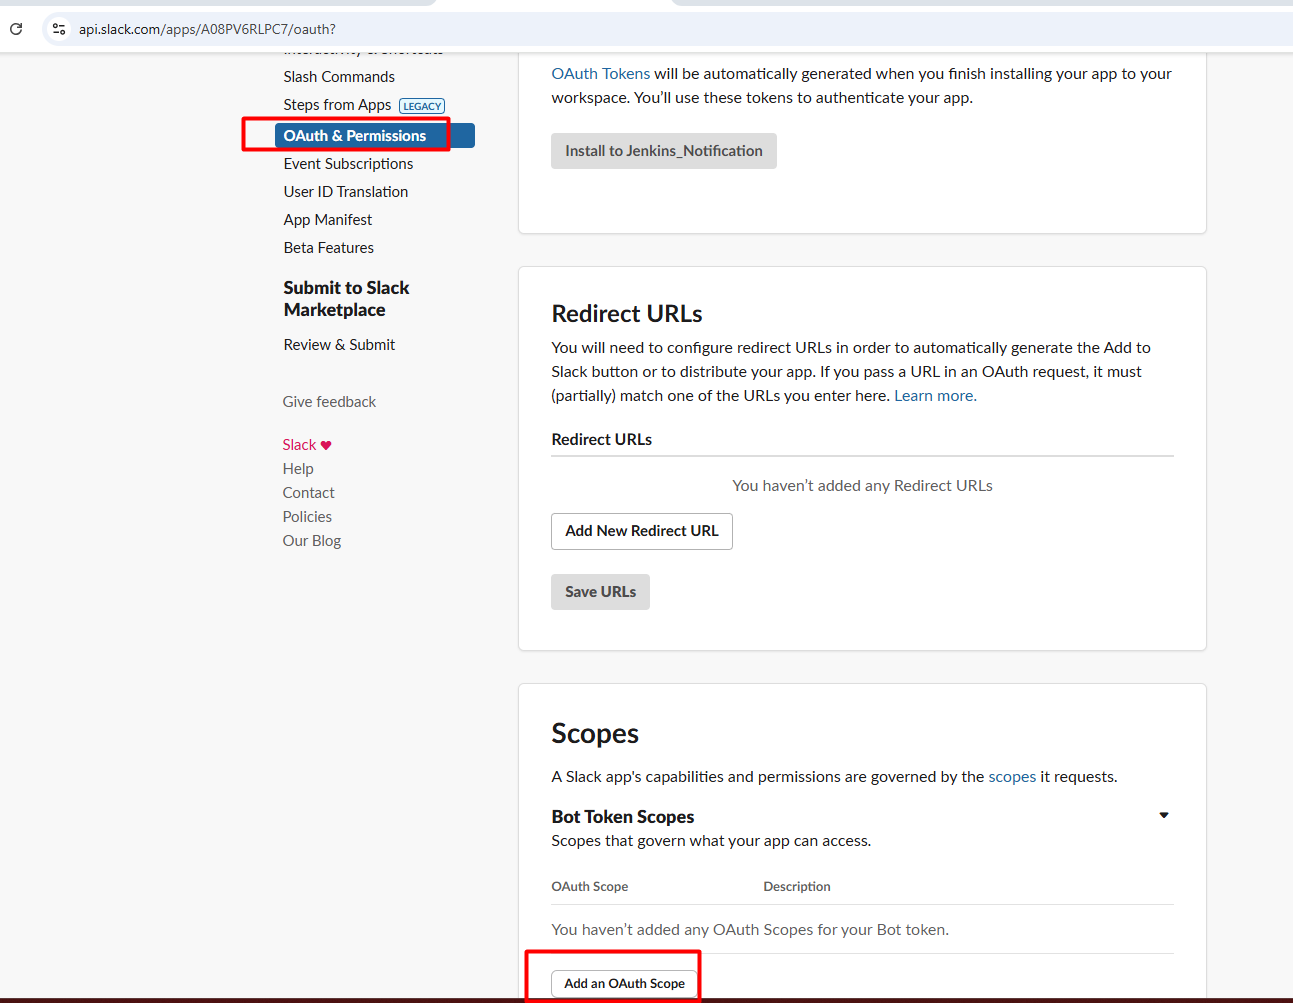
- Scroll to Scopes:
- Under Bot Token Scopes, add:
- chat:write → Allows the bot to post messages.
- chat:write.public → (Optional) Allows posting in public channels without being invited.
- Files:write → To be able to write to the slack channel
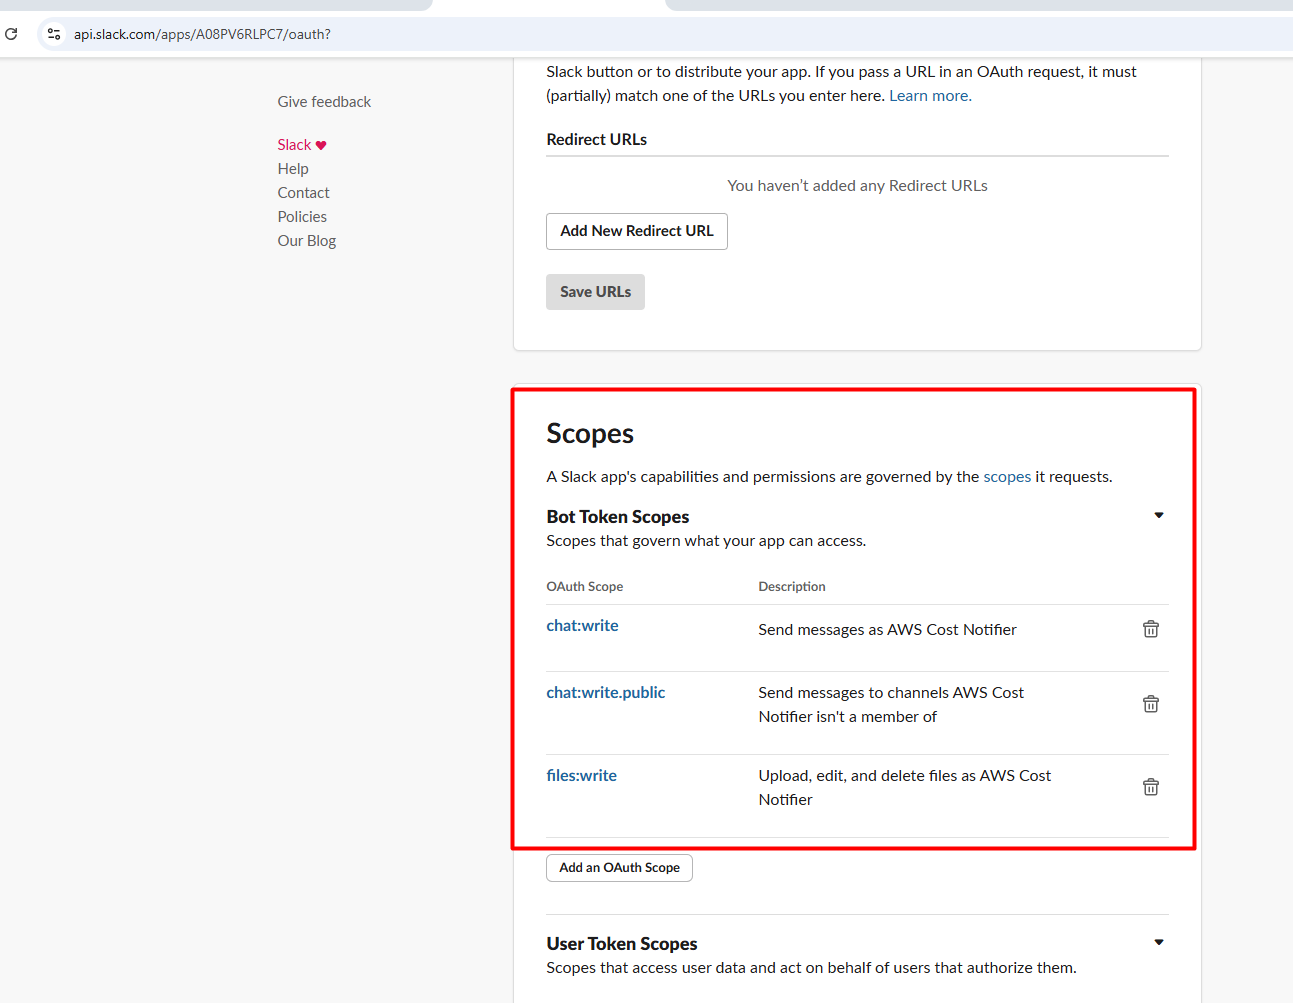
- Under Bot Token Scopes, add:
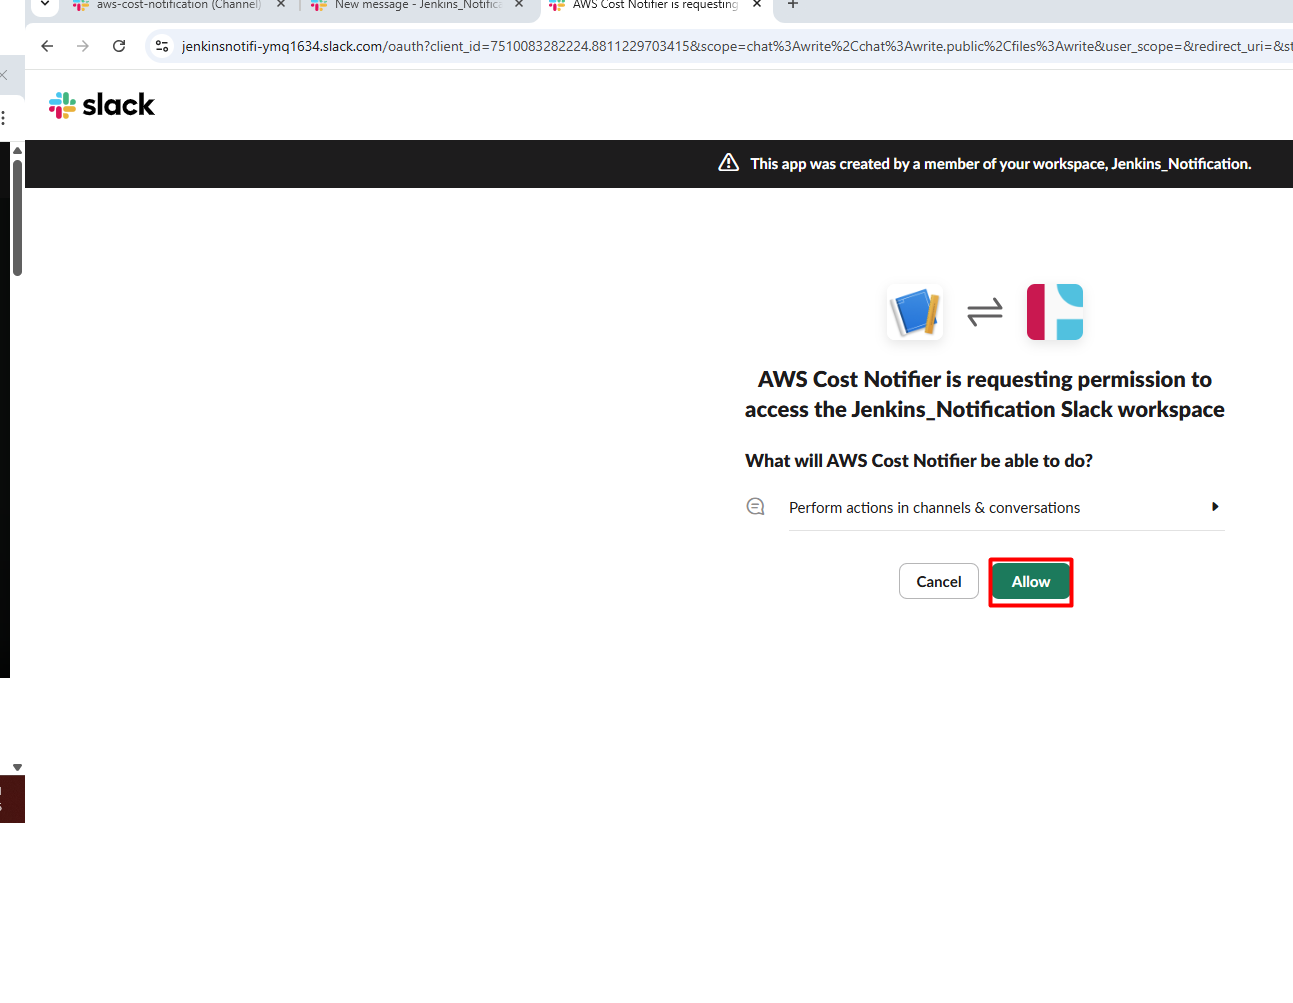
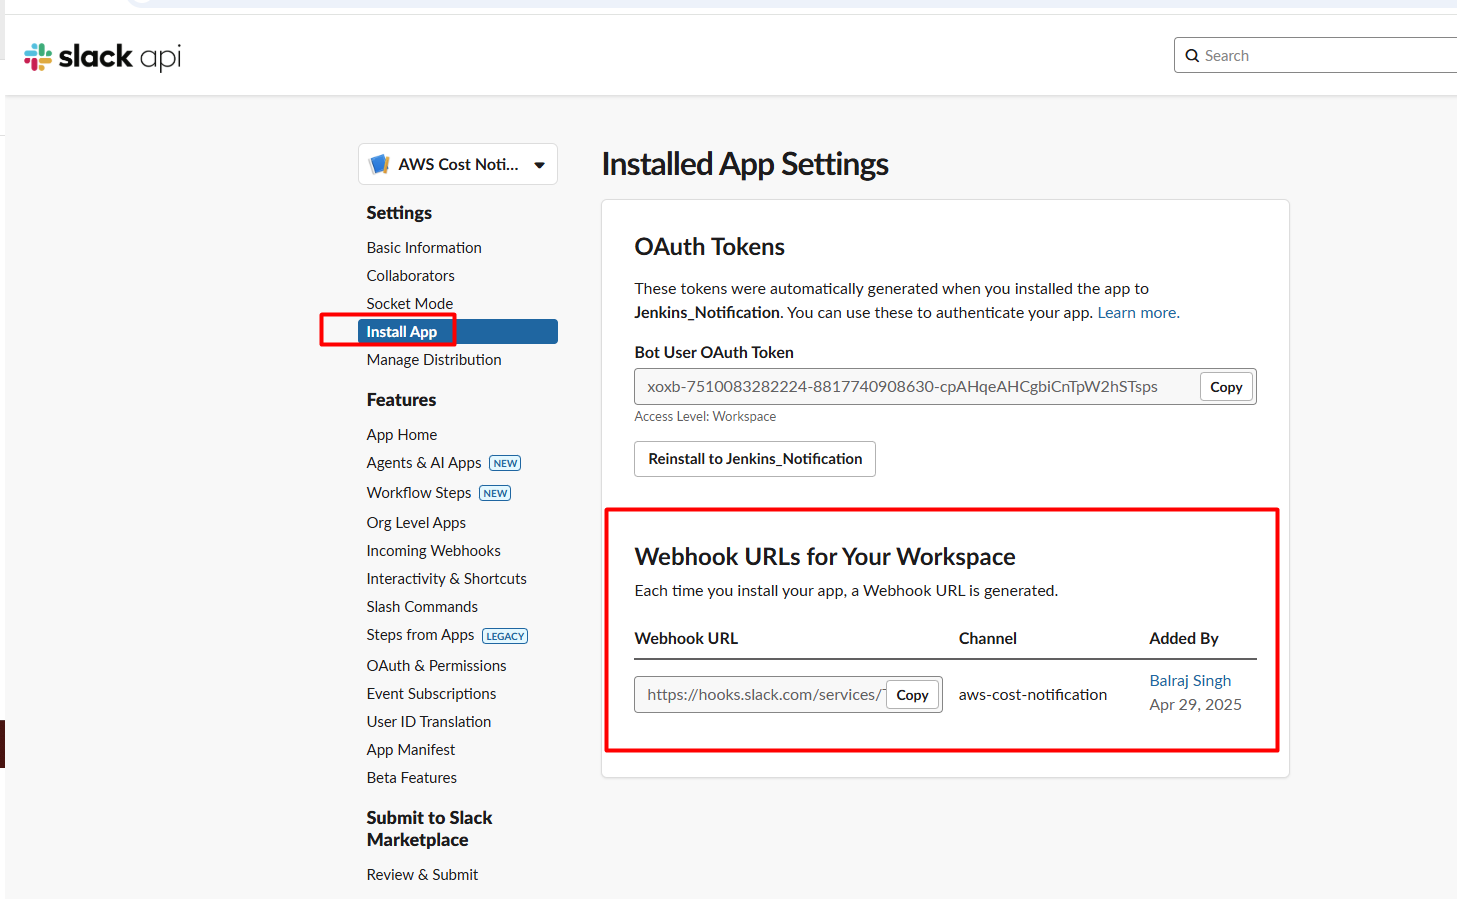
4. Configure Slack Incoming Webhook
- Set up Incoming Webhooks:
- Under "Add features and functionality", select "Incoming Webhooks"
- Toggle "Activate Incoming Webhooks" to On
- Click "Add New Webhook to Workspace"
- Choose the "aws-cost-notification" channel
- Copy the Webhook URL that is generated
- Go to
https://api.slack.com/apps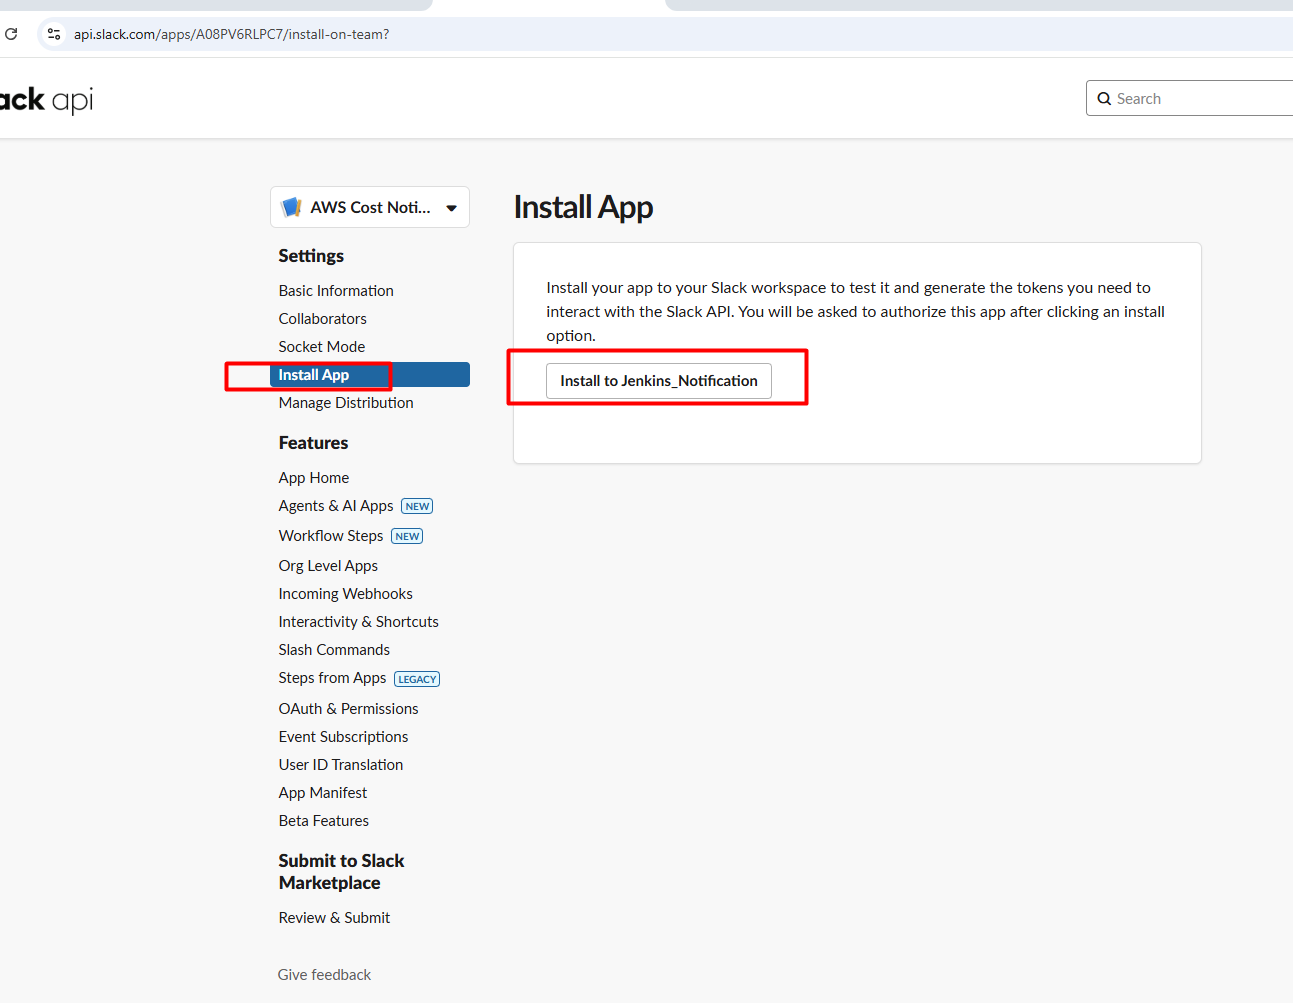
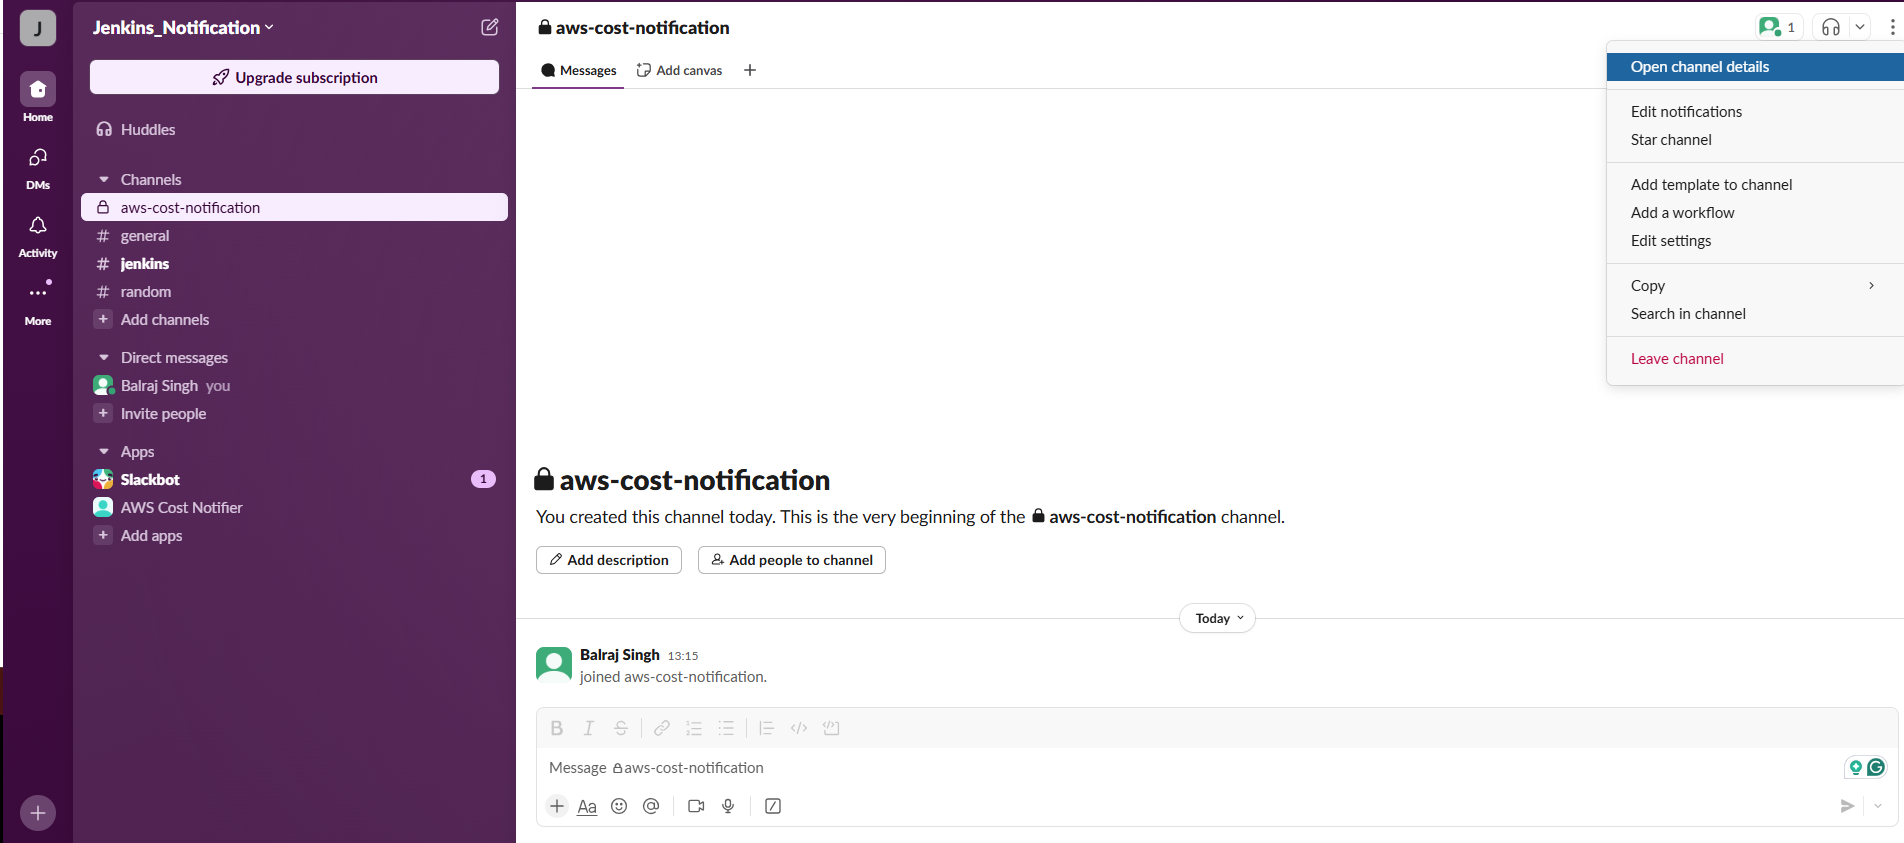
- Invite the Bot in Slack Channel
/invite @AWS Cost Notifier and click on
send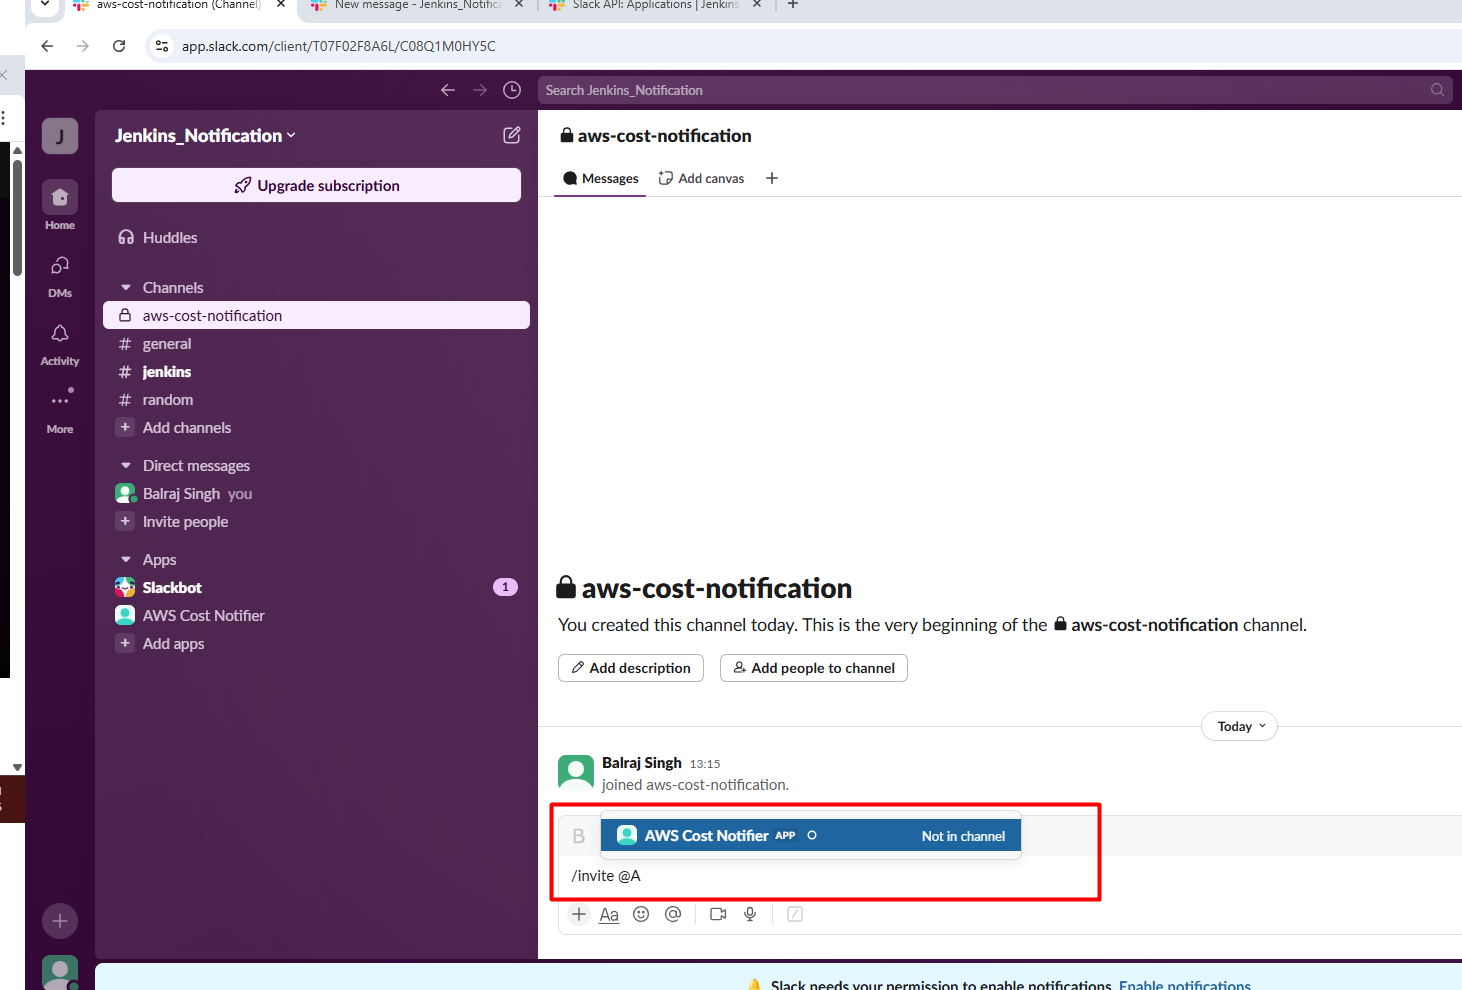
5. Add Webhook URL to GitHub Repository Secrets
- In your GitHub repository, go to "Settings" > "Secrets" > "Actions"
- Select "secret" ,Name:
SLACK_WEBHOOK_URL - Value: Paste the webhook URL from the previous step
- Click "Add secret"
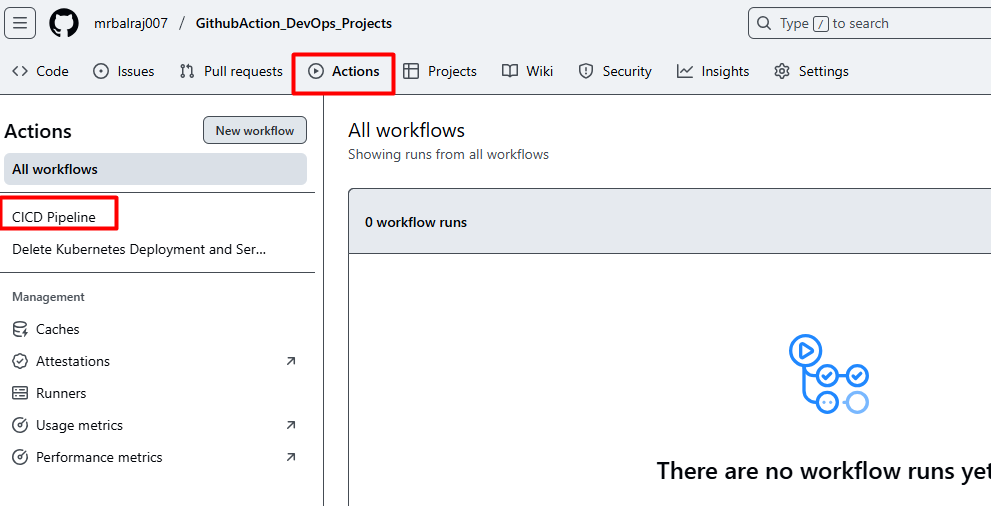
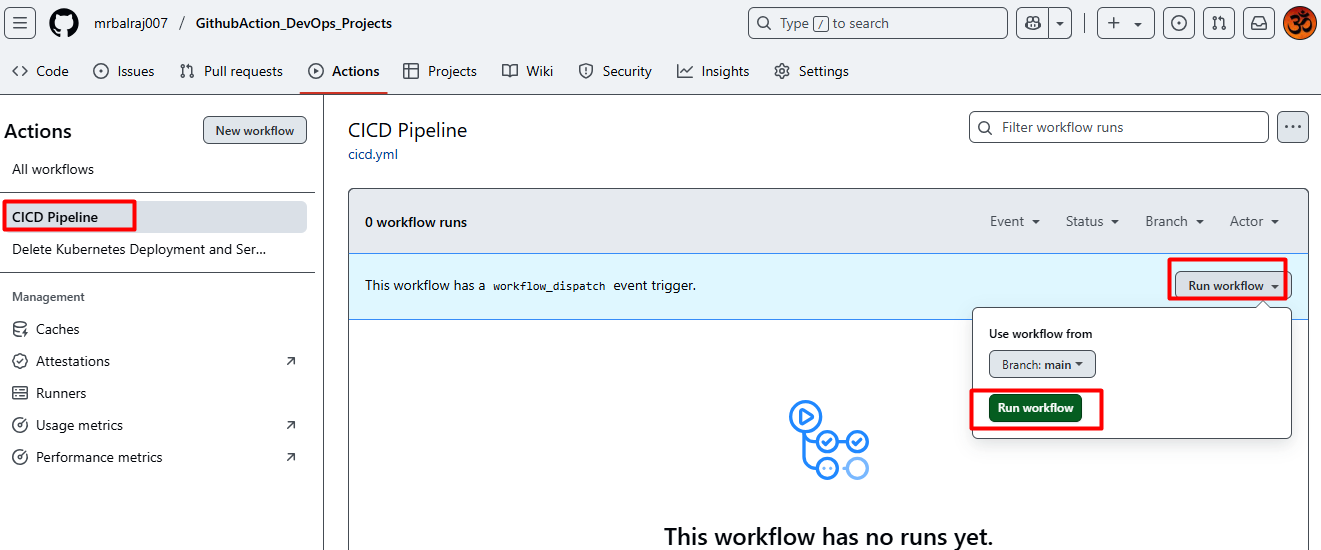
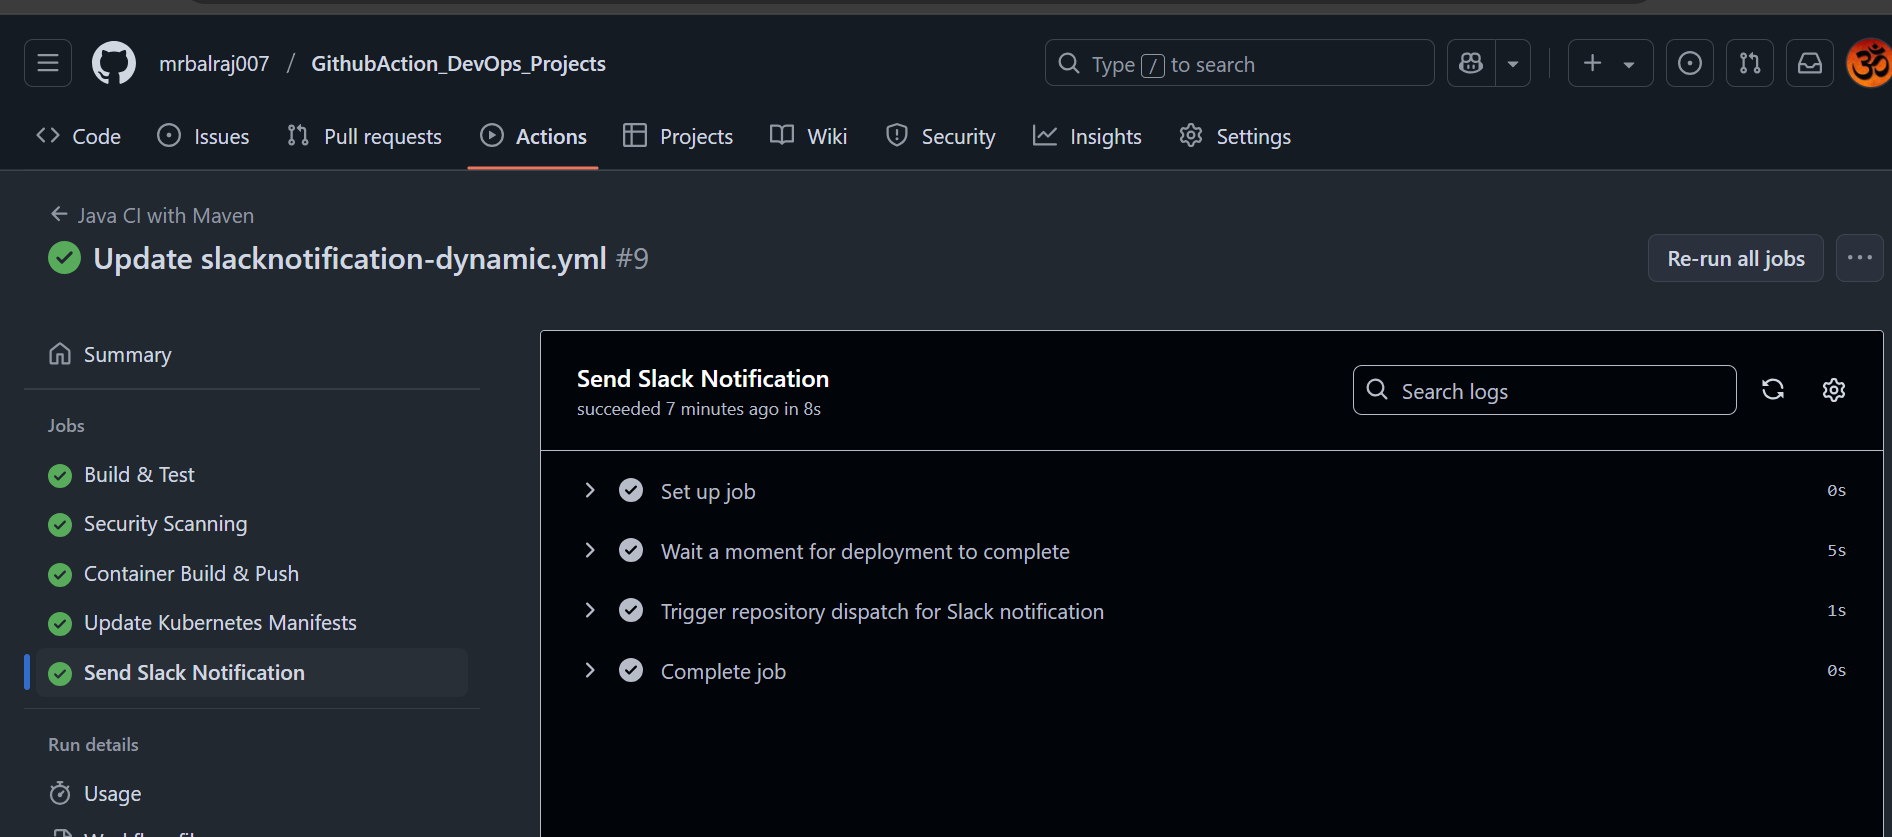
6. Workflow Execution
The workflow will run:
- When code is pushed to the main branch
- When a pull request is made to the main branch
- Manually via the "Actions" tab in GitHub
Customization in Slack webhook
You can customize the notification message by modifying the custom_payload in the .github/workflows/slack.yml file.
The SLACK_WEBHOOK_URL in your workflow file refers to a webhook URL that needs to be stored as a GitHub Actions secret. This is not an actual URL in the file, but a reference to a secret value.
To set up a Slack webhook URL:
Go to your Slack workspace and create an incoming webhook:
- Visit https://api.slack.com/apps
- Create a new app or use an existing one
- Enable "Incoming Webhooks"
- Add a new webhook to a specific channel
- Copy the webhook URL provided (looks like: https://hooks.slack.com/services/T00000000/B00000000/XXXXXXXXXXXXXXXXXXXXXXXX)
Add this webhook URL as a GitHub repository secret:
- Go to your GitHub repository
- Navigate to Settings > Secrets and variables > Actions
- Click "New repository secret"
- Name:
SLACK_WEBHOOK_URL - Value: paste the webhook URL from Slack
- Click "Add secret"
Your workflow will then use this secret value when sending notifications to Slack. The actual URL is kept secure and not visible in your workflow file.
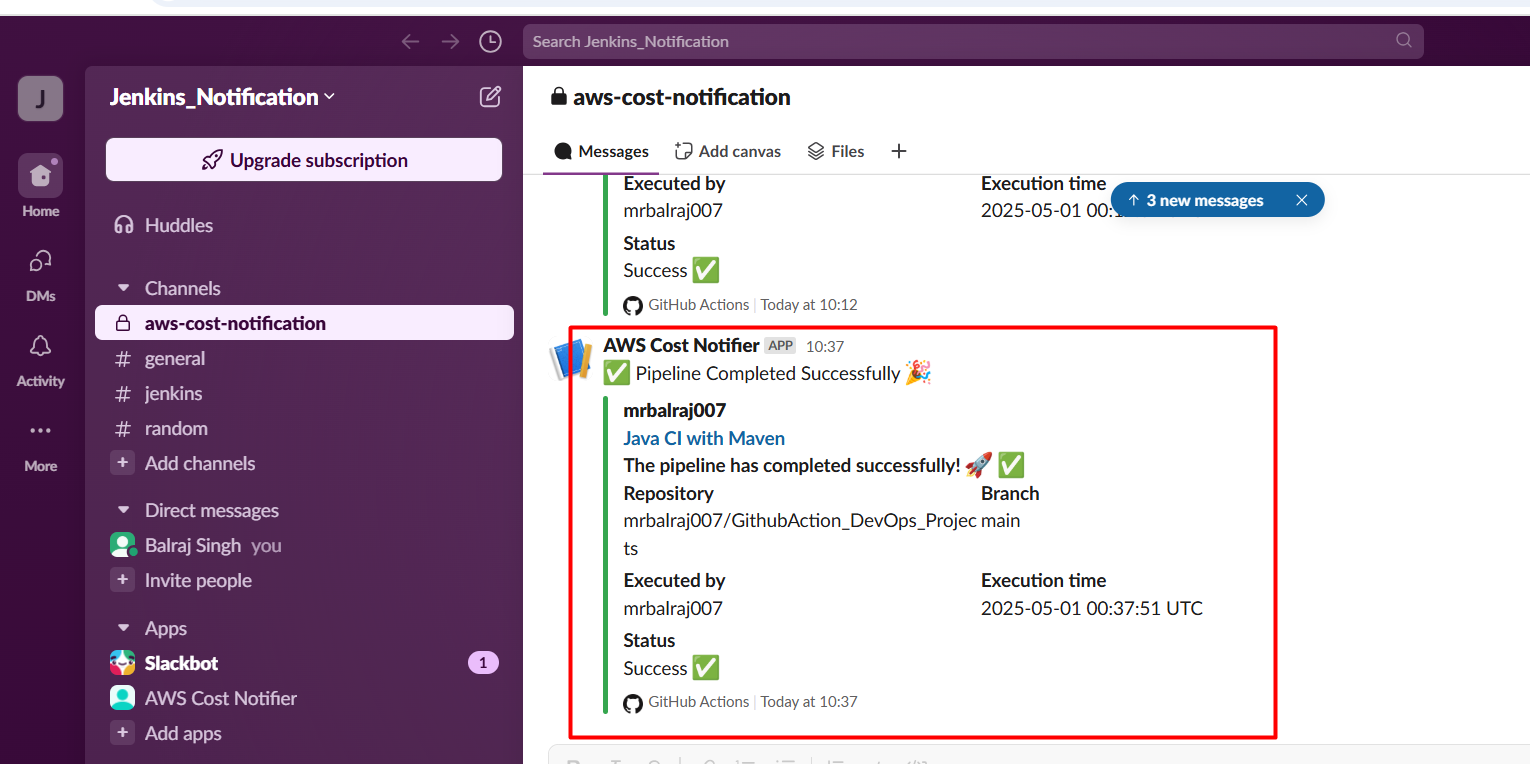
Once the pipeline is executed successfully, then get the below notification in Slack. This notification will provide details about the execution status, including any errors or warnings that may have occurred during the process. Additionally, it will outline the next steps to take if further action is required.
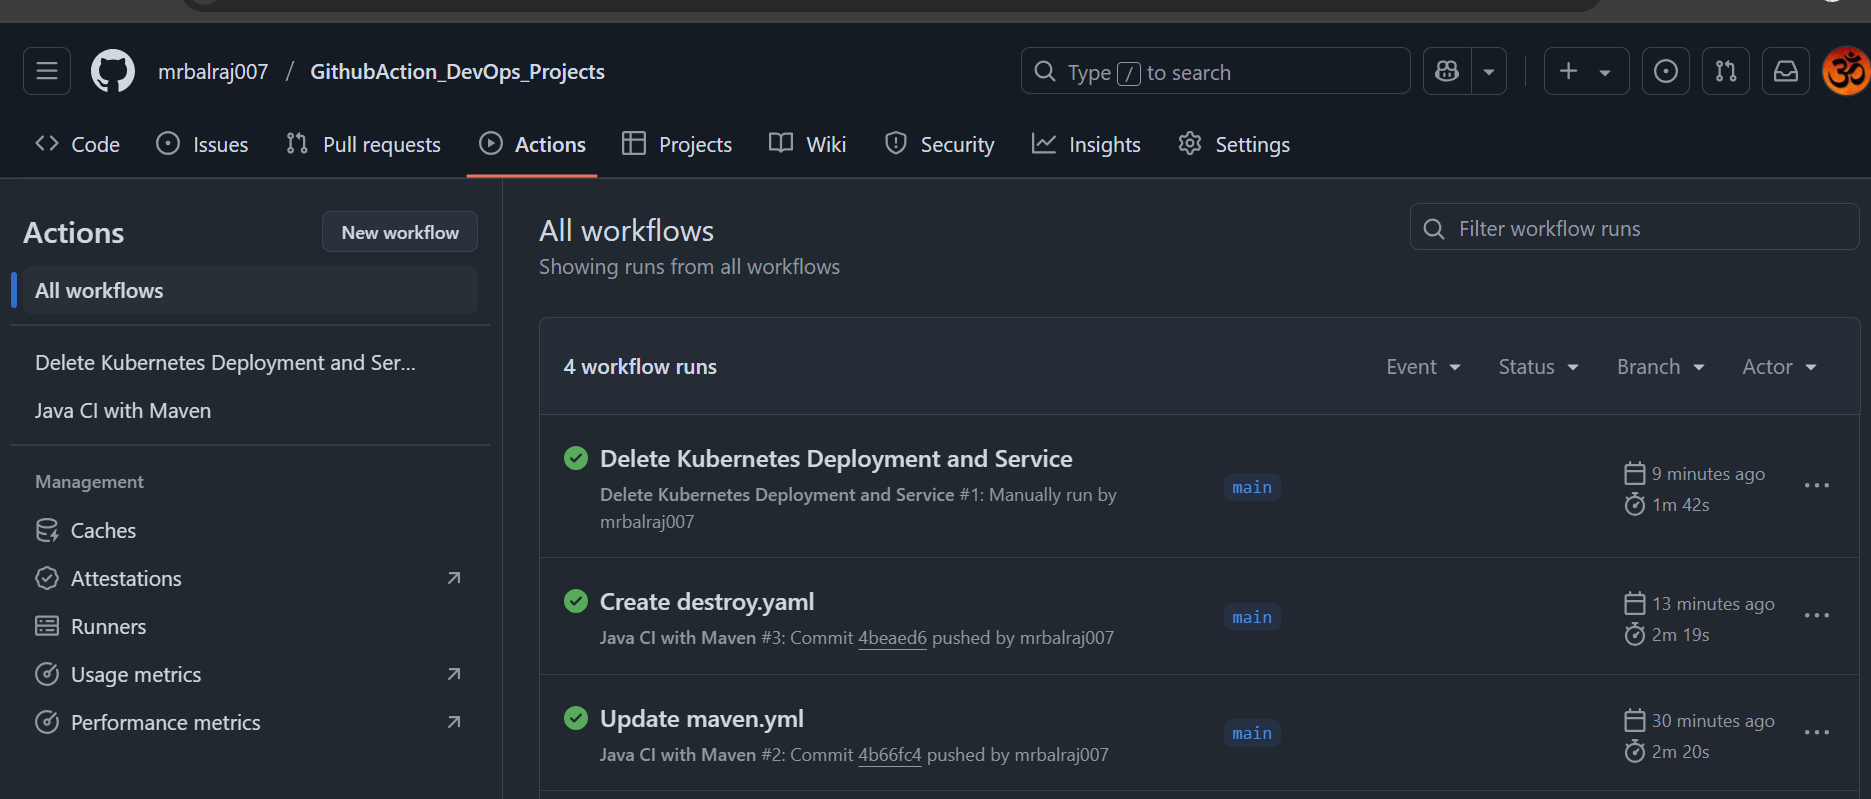
Final Status of Pipeline
Environment Cleanup:
- Following resouces are created as part of this project.
To delete deployment:
- I've created a
Github Actionto destroy the Kubernetesdeploymentandservices.
Delete all deployment/Service:
In github action, and click on the second pipeline to delete the deployment and service.
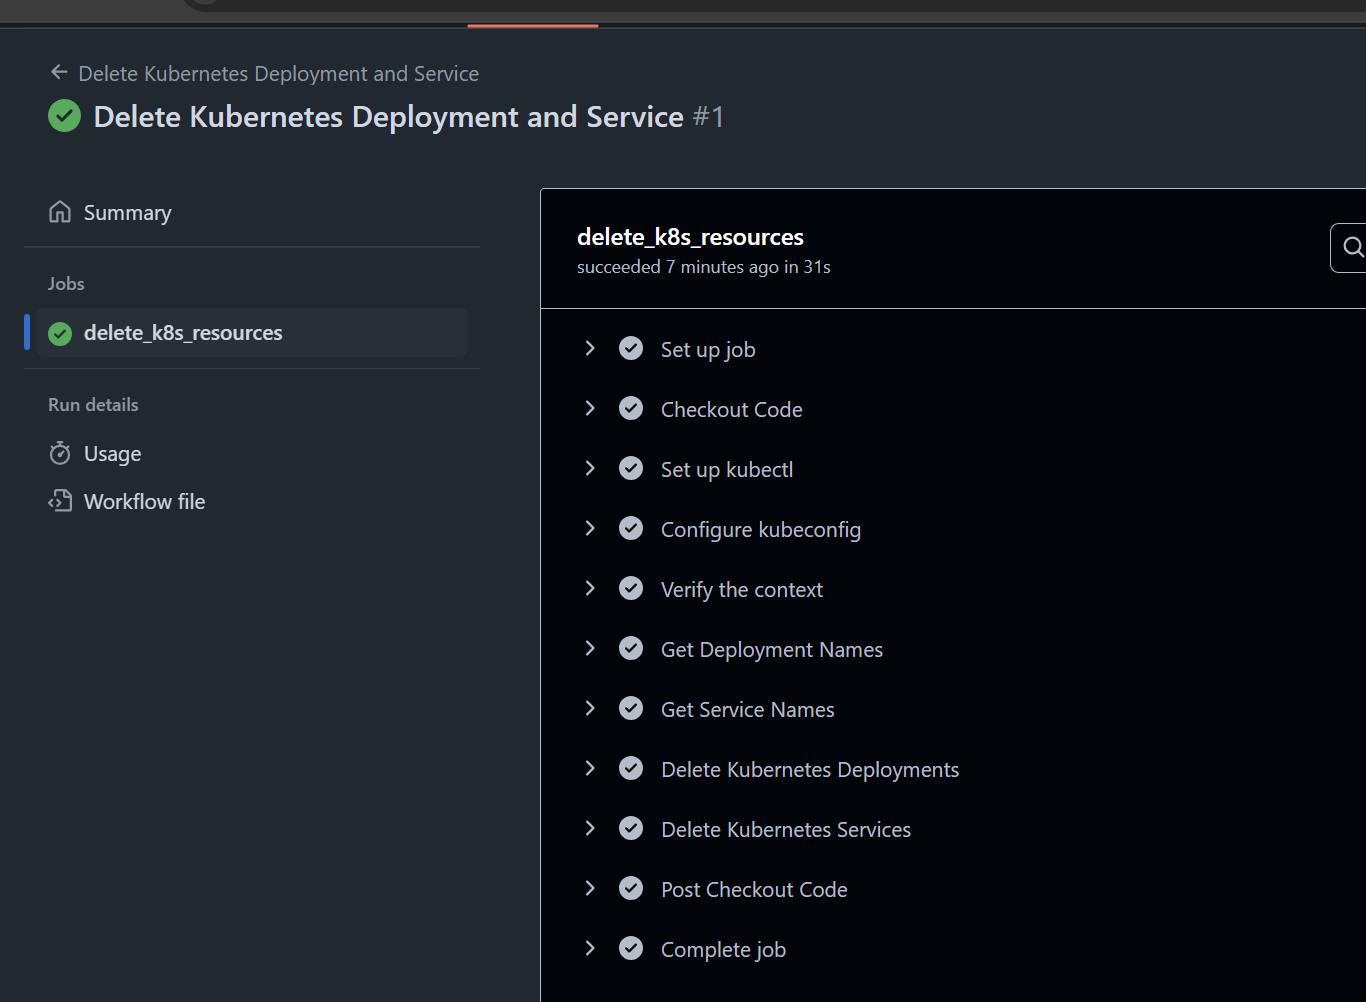
Here is the complete CICD- Pipeline to destroy Deployment and Services
To delete AWS EKS cluster
- Login into the
Terraform EC2instance and change the directory to /k8s_setup_file, and run the following command to delete the cluster.sudo su - ubuntu cd /k8s_setup_file sudo terraform destroy --auto-approveTroubleshooting:
- I am getting below error message while running the
Terraform destroy.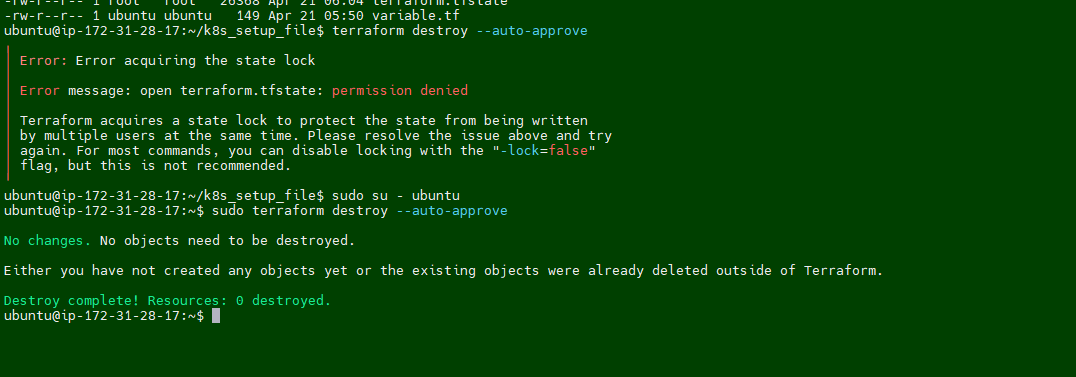
Fix/Solution:
- I noticed that permission is set to root for terraform dirctory. we have to take ownership first and then try to delete it.
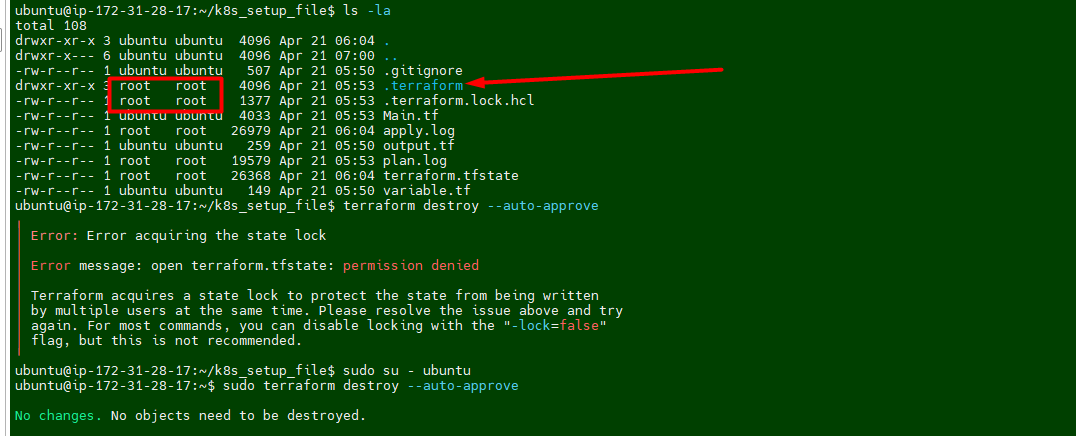
- Run the following command to take ownership
sudo chown -R ubuntu:ubuntu /home/ubuntu/k8s_setup_file/.terraform* - I was still getting error message while runing the desrtoy
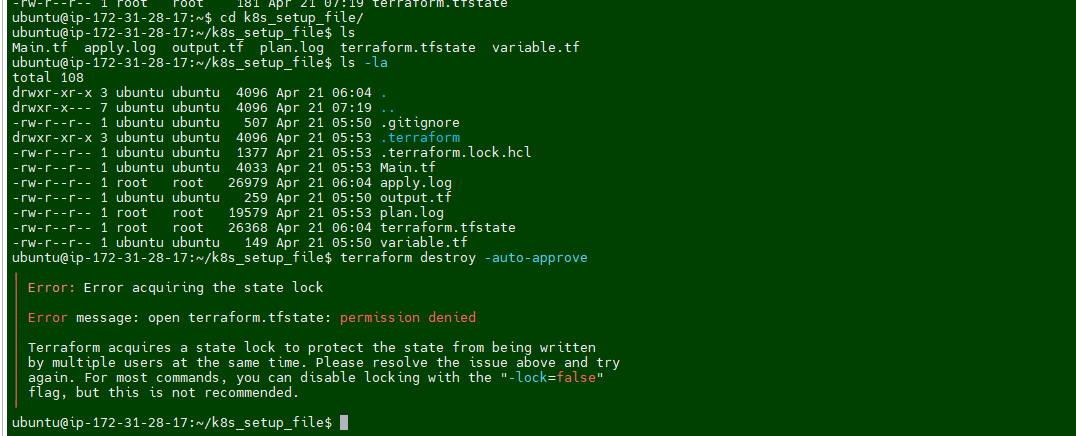
- I ran the following command again for entire terraform folder.
sudo chown -R ubuntu:ubuntu /home/ubuntu/k8s_setup_file/terraform* - Rerun the destroy command and this time it works :-)
To delete the Virtual machine.
Go to folder "02.Github_Action_DevOps-Project/Terraform_Code_Infra_setup" and run the terraform command.
00.Code_IAC-github-repo01.Code_IAC_Selfhosted-Runner-and-Trivy-02.Code_IAC_SonarQube03.Code_IAC_Terraform_boxTerraform destroy --auto-approve💡 Note:
You must use this command from
each folderin order to destroy the entire infrastructure.
Troubleshooting:
- I am getting below error message while running the
Terraform destroy.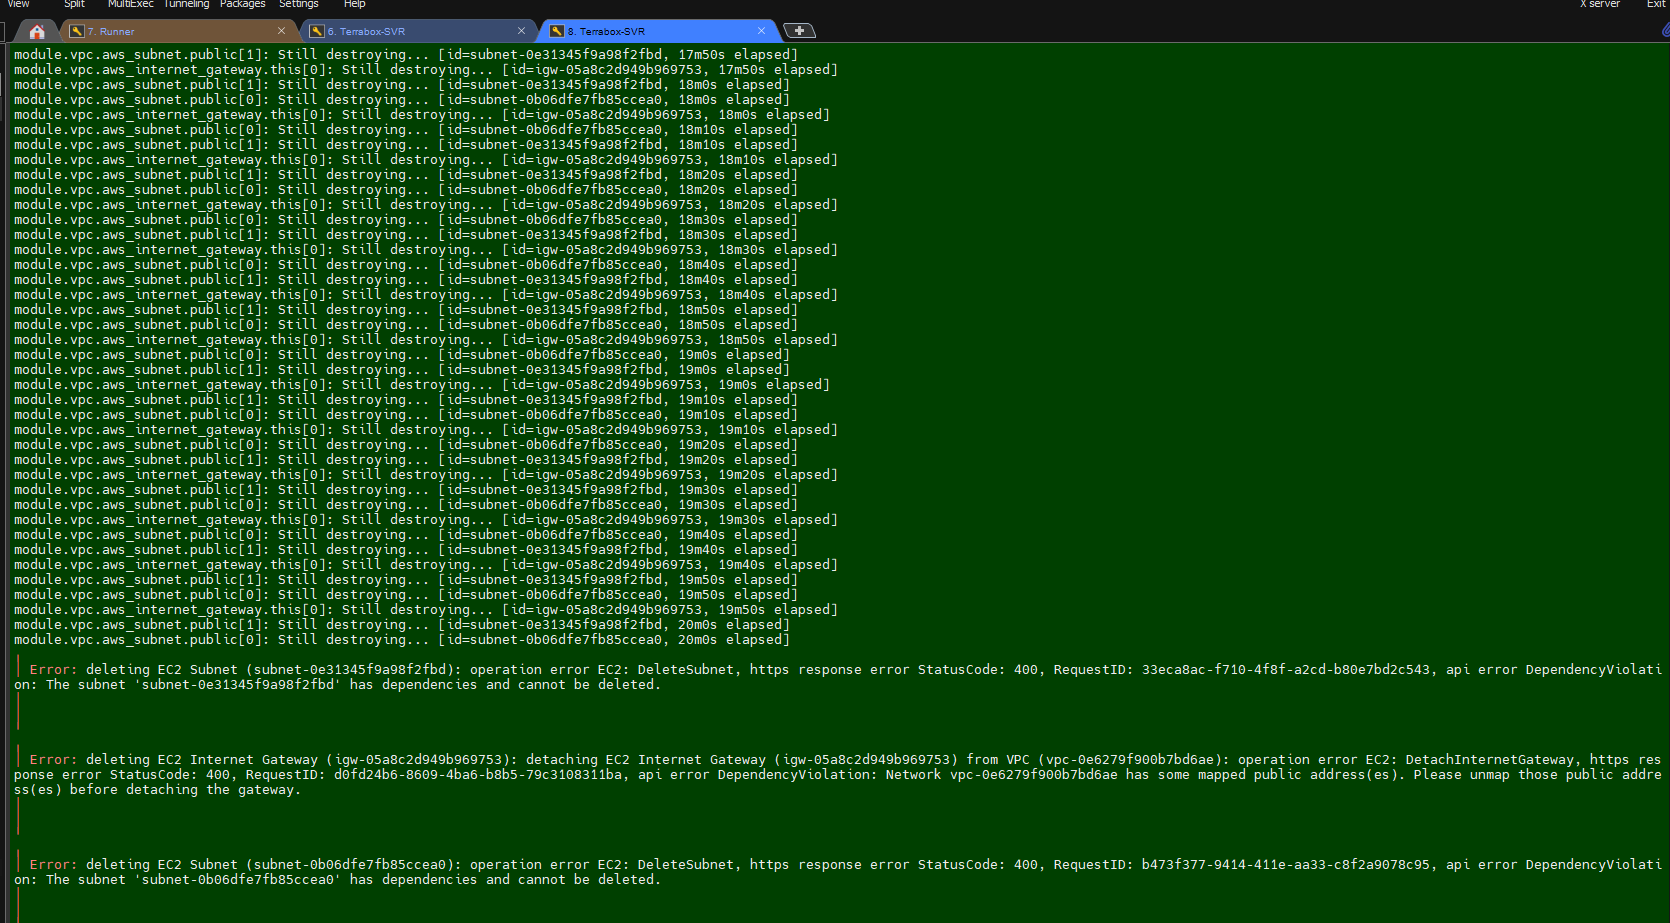
Fix/Solution:
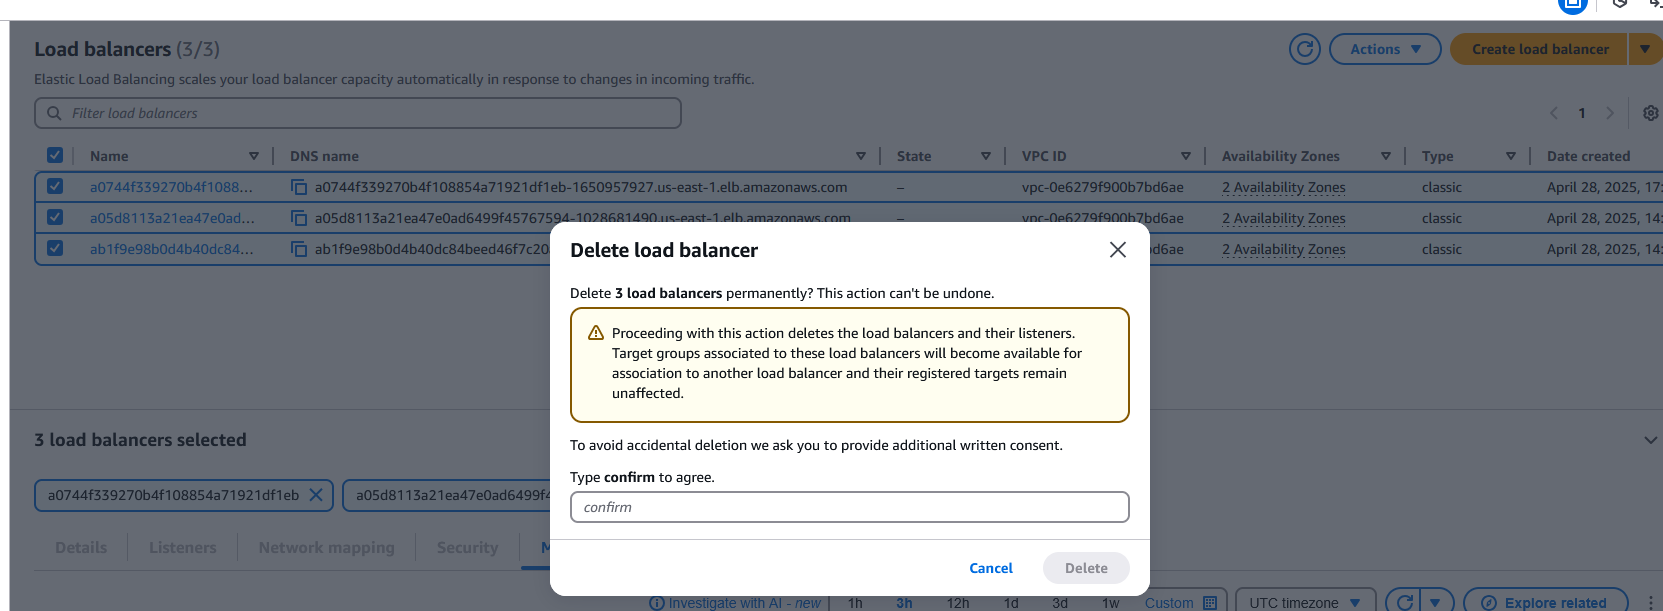
I need to delete the all
Load balancer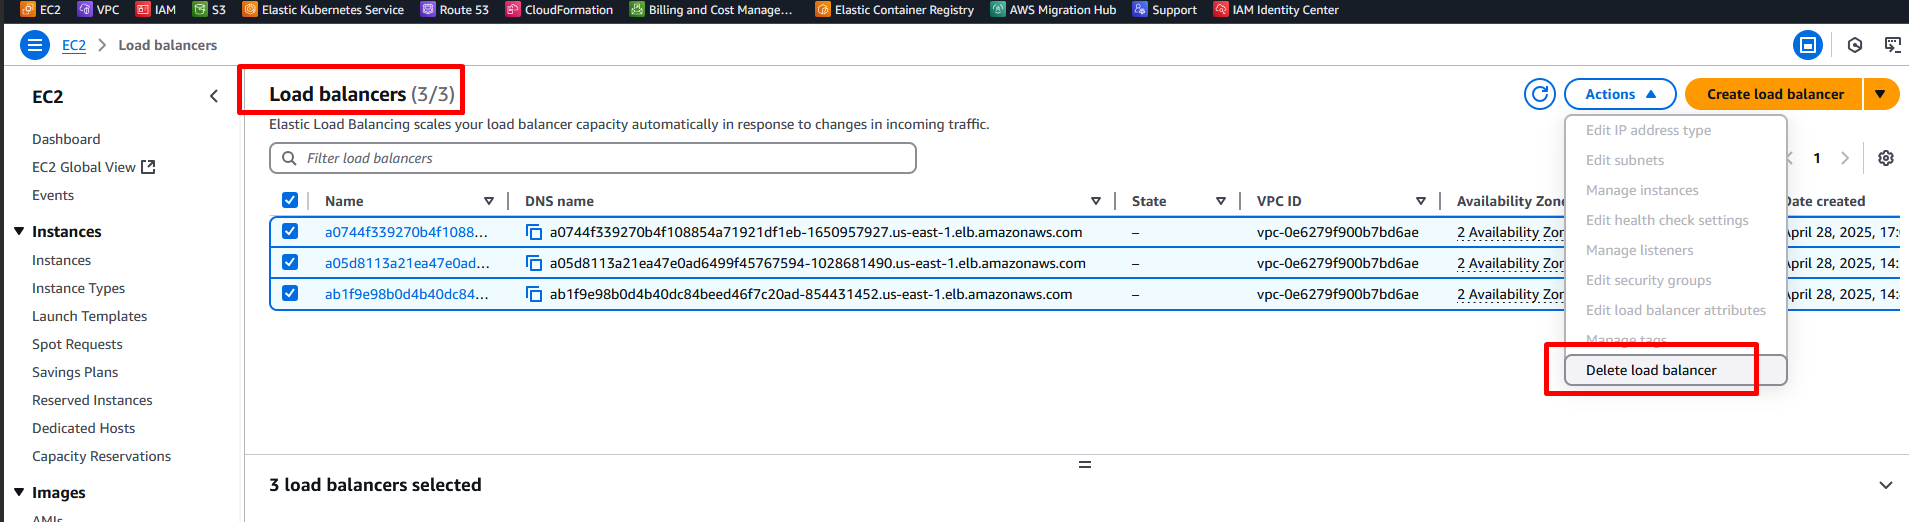
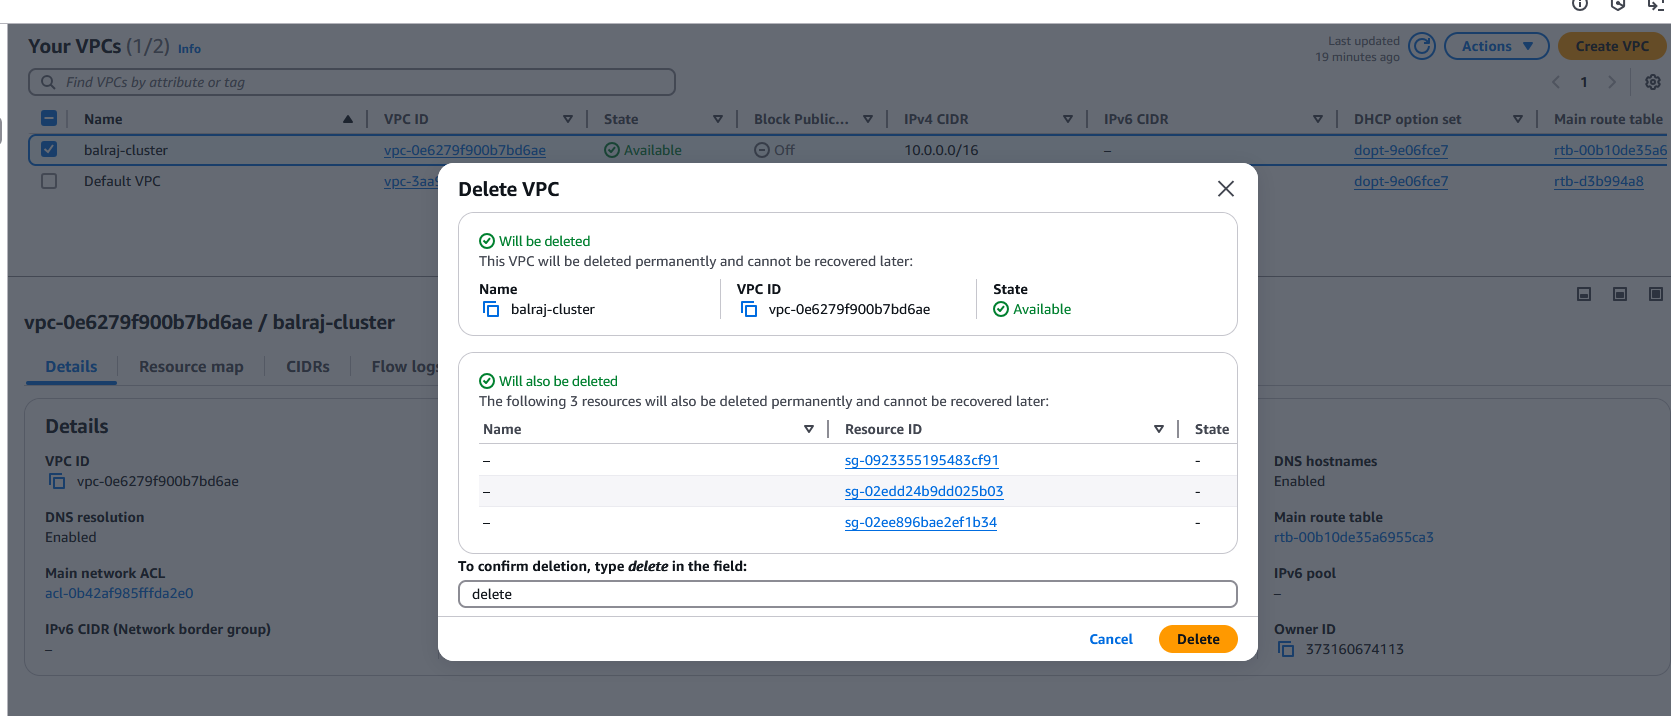
Again, I am getting the below error message and noticed that the security group is stopping me from deleting it. So, when I delete the
VPCand try to run the destroy command again. This time it works.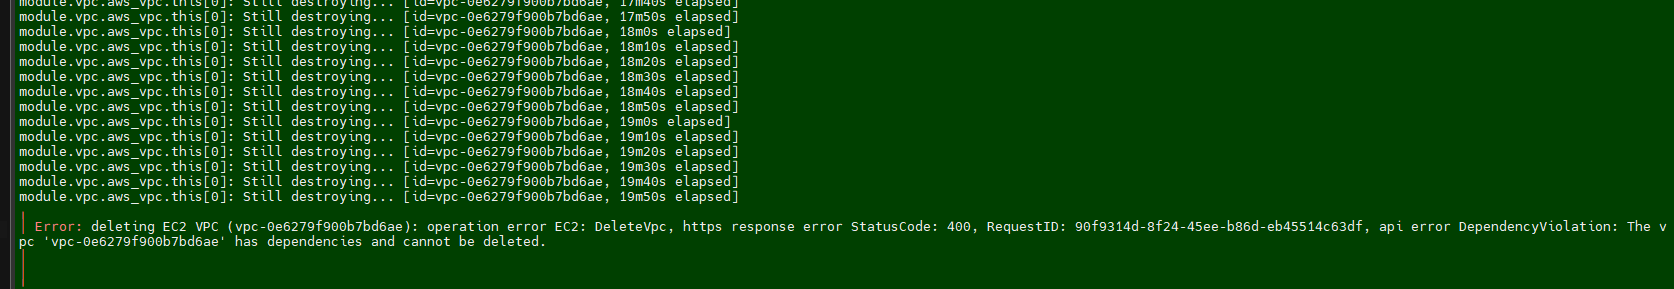
Why Use This Project
- Automation: Reduces manual effort in building, testing, and deploying applications.
- Security: Ensures code and container security through automated scans.
- Scalability: Deploys applications to scalable Kubernetes clusters.
- Best Practices: Demonstrates industry-standard CI/CD practices.
Project Challenges
Technical Complexity
- Coordinating multiple tools and technologies in a cohesive pipeline
- Ensuring proper authentication between services (GitHub, Docker Hub, Kubernetes)
- Managing Kubernetes RBAC for secure but sufficient permissions
- Configuring Prometheus targets with proper scraping intervals
Integration Points
- Bridging self-hosted runner with GitHub Actions ecosystem
- Connecting pipeline stages with appropriate artifact handoffs
- Ensuring monitoring tools receive metrics from all components
- Managing secrets securely across multiple services
Infrastructure Management
- Provisioning right-sized VMs for each component
- Configuring network security for appropriate access
- Ensuring high availability for critical components
- Managing resource consumption across the stack
Project Benefits
Development Workflow
- Automated quality gates prevent problematic code from reaching production
- Developers receive immediate feedback on code quality and security
- Clear visibility of deployment status and application health
- Reduced manual intervention in deployment processes
Operational Excellence
- Real-time monitoring of application and infrastructure
- Early detection of performance degradation or failures
- Ability to correlate infrastructure metrics with application behavior
- Historical metrics for capacity planning and optimization
Security Enhancements
- Vulnerability scanning at multiple levels (code, container)
- Principle of least privilege through RBAC implementation
- Secure secret management across the pipeline
- Audit trail of deployments and changes
Business Value
- Faster time-to-market for new features and bug fixes
- Improved application reliability and performance
- Reduced operational overhead through automation
- Better resource utilization through monitoring insights
Conclusion
This project demonstrates a comprehensive DevOps implementation that bridges the gap between development and operations through automation, monitoring, and security best practices. The pipeline not only streamlines the deployment process but also ensures quality and security at every step.
By implementing this solution, organizations can achieve:
- Increased Deployment Frequency: Automation reduces the friction in deploying new code
- Improved Quality Assurance: Integrated testing and scanning prevent defects
- Enhanced Operational Visibility: Comprehensive monitoring provides insights
- Better Developer Experience: Streamlined workflows with immediate feedback
The modular nature of the implementation allows organizations to adapt specific components to their needs while maintaining the overall workflow integrity. As container orchestration and cloud-native technologies continue to evolve, this pipeline architecture provides a solid foundation that can be extended to incorporate emerging tools and practices.
Ref Link:
Subscribe to my newsletter
Read articles from Balraj Singh directly inside your inbox. Subscribe to the newsletter, and don't miss out.
Written by