Alternatives to Chart.js
 SciChart
In this series we’re looking at comparisons of JavaScript chart libraries. JavaScript is a huge ecosystem with many frameworks, plugins and libraries allowing you to create charts & graphs in your applications. Choosing the right JavaScript chart for your application is something which requires careful consideration depending on your requirements. In these helpful guides, we will be comparing popular JavaScript Charts to help you make the right decision depending on your needs.
Today we’re looking at Chart.js. We’re going to discuss what is Chart.js, what are the pros & cons of Chart.js, how to improve Chart.js performance and finally alternatives to Chart.js for enterprise software applications.
What is Chart.js?
Chart.js is a free, open-source JavaScript library for data visualization, which supports eight chart types: bar, line, area, pie, bubble, radar, polar and scatter. It’s licensed under the permissive MIT license and is renowned for being flexible, lightweight, easy to use and extendible.
Based on HTML5 and Canvas, Chart JS is simpler than SVG based libraries and has the ability to animate charts, incorporate tooltips or handle responsive layout easily.
What are the pros & Cons of Chart.js
Advantages of Chart.js
Here are the pros of Chart.js:
Provides responsive, animated charts with a clean look & feel
Lightweight core library: 199kb minified and 67kb Gzipped according to Bundlephobia
Free open source, with a permissive MIT license
Simple, easy to use and get started
Good documentation & samples for an open source library
Popular, with a large community and plenty of contributors
Extensible, via a plugin architecture allowing for additional chart types, features or interactions to be built.
Disadvantages or Drawbacks of Chart.js
Here are the cons of ChartJS.
Only 8 basic chart types & features available in the core library
Additional chart types & features require plugins which may not have the same development pace or community as the main core library
Does not support advanced chart types like heatmap
Adding things like interactivity require plugins
No support for 3D charts
According to internet searches, Chart.js is slow and struggles with performance with large datasets. For example, some Github issues & Stackoverflow posts report:
“Chart.js is wildly slow” and unusable with large numbers but small dataset
“Chart.js unusably slow” with many data-points
“Chart js Line charts with big-data resizes very slowly”
“Zoom speed on large data is slow with Chart.js”
Realtime or dynamic updates are challenging, with performance problems reported here also
Sometimes rendering issues due to API instability or gripes with the API are reported in G2 reviews
Open source means lack of enterprise technical support, although as mentioned before the community is strong
How to improve Chart.js Performance?
Rendering performance often comes up as a disadvantage of Chart.js. For a simple application with no more than a few JS charts with small data this may not be a problem. However, data is getting bigger and bigger all the time. Dashboards in applications may have to deal with tens of charts, each with a number of series and thousands of data-points per series. This can add up to a huge problem as requirements become more complex.
According to the Chart.js docs on performance:
Chart.js is fastest if you provide data with indices that are unique, sorted, and consistent across datasets
Decimation is available as an option which reduces number of datapoints on screen. However, it comes with limitations such as dataset must be a line, sorted in X
Animations may be disabled which reduces CPU usage and improves rendering time
Specifying min and max for scales avoids the need to calculate the axis range from data.
What alternatives are there to Chart.js?
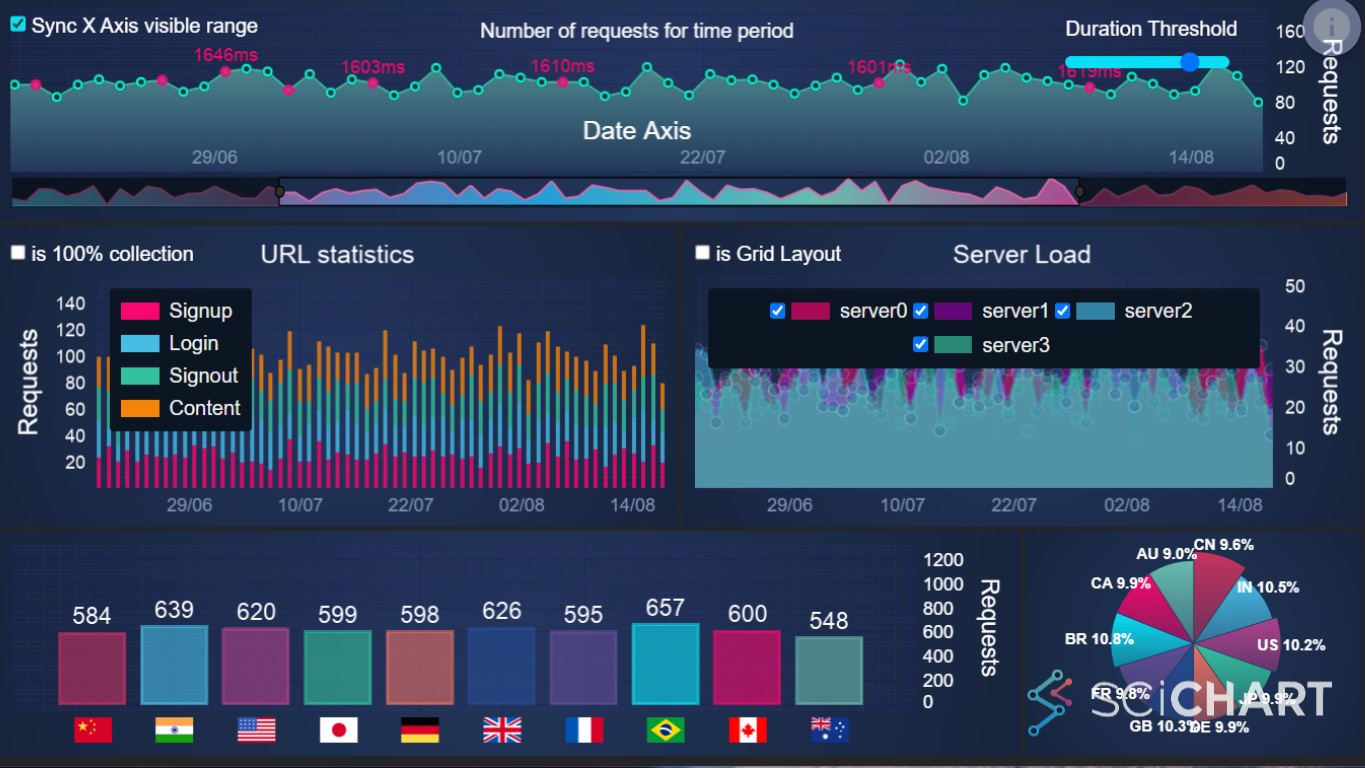
For applications which have demanding requirements, complex dashboards or big-data / performance requirements one viable alternative is SciChart.js.
One of the differences about SciChart.js is it’s designed for demanding applications that require high performance, or complex visualisations & interactions. It’s particularly focussed on enterprises building mission-critical apps, citing scientific, medical users like Siemens, financial firms such as JP Morgan & aerospace such as Nasa as key customers.
SciChart.js is designed for the following types of application:
Apps moving from Desktop to JavaScript which expect high-performance or big-data handling
Complex interactions, zooming, panning, linking of charts, tooltips and annotations available out of the box
SaaS apps, enterprise apps or Electron (desktop) apps
Enterprise apps which find tech-support a value-add
With support for React, Vue, Angular, enterprise tech-support and a wide set of docs, examples and demos, SciChart.js can quickly pay back the investment in time / cost savings when building your applications.
What are the Advantages of SciChart.js vs. Chart.js?
When compared to Chart.js, SciChart.js has the following advantages:
High performance for big datasets (1k, 10k, 100k, 1M, 10M+)
Many chart types including 2D & 3D charts out of the box
Allows complex chart interactions, allowing you to create rich dashboards
Extensibility with many API endpoints
Extensive (hundreds of pages of) documentation with embedded codepens and hundreds of demos online.
Enterprise tech support with fast bug fix turnaround and a high release cadence, allowing you to save time & money in your projects.
Learn more about SciChart.js
To learn more about SciChart.js or to discover it’s features, take a look at the following informative webpage:

Fast React, JavaScript Charts & Graphs for Enterprises
Learn more about the features & benefits of SciChart.js: an enterprise-grade alternative to Chart.js, which allows you to integrate complex & demanding JavaScript & React Charts your applications. … Continue reading Fast React, JavaScript Charts & Graphs for Enterprises
Subscribe to my newsletter
Read articles from SciChart directly inside your inbox. Subscribe to the newsletter, and don't miss out.
Written by
