📊 Monitoring Stack – Prometheus, Grafana, Loki, Promtail, cAdvisor
 Pradeep Kadam
🔍 What is Prometheus?
Prometheus is an open-source monitoring and alerting system.
It is pull-based: it scrapes metrics from HTTP endpoints.
It stores metrics in a time series database (TSDB).
Exposes metrics via a built-in web UI and allows queries using PromQL.
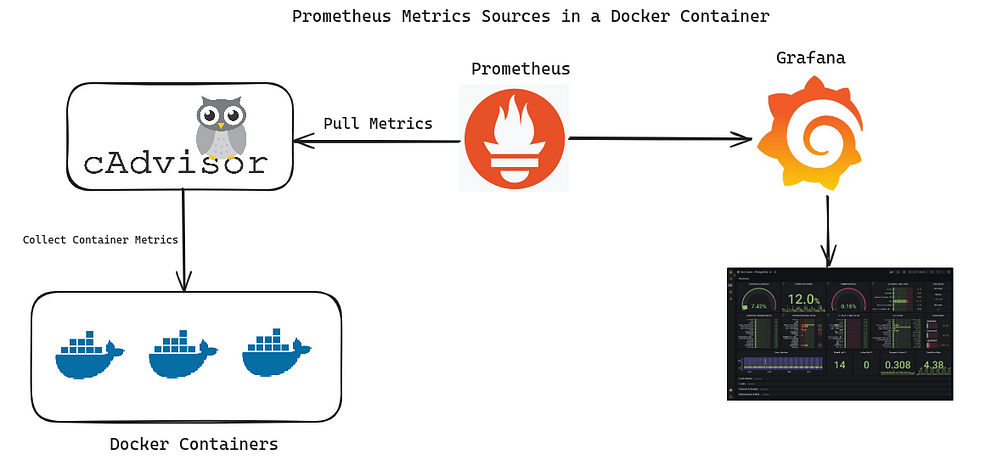
🔧 Architecture of Prometheus
TSDB: Stores metrics like CPU usage, memory, network, etc.
HTTP Server: Lets users query data using PromQL.
Exporters: Collect metrics from various systems (e.g., Node Exporter).
🛠 Default Port: 9090
🧠 Prometheus is best for pull-based monitoring, scalable architecture, and custom alerting.
🔗 What is Grafana?
Grafana is a visualization and dashboard tool for monitoring metrics.
It connects with Prometheus, Loki, and many other data sources.
Supports real-time dashboards, alerts, and custom panels.
🛠 Default Port: 3000
🔐 Default Login: admin / admin
🔄 What is Loki?
Loki is a log aggregation system from Grafana Labs.
Works like Prometheus, but for logs instead of metrics.
Does not index logs, only labels – which makes it cost-effective.
🛠 Default Port: 3100
📩 What is Promtail?
Promtail is an agent that ships logs to Loki.
It tails system logs and sends them to the Loki backend.
Uses push-based mechanism unlike Prometheus.
🔧 Requires path configs (e.g., /var/log/*) for tailing.
📋 Grafana vs Loki vs Promtail vs Prometheus
| Component | Purpose | Push/Pull | Use Case |
| Prometheus | Metric collection & query | Pull | CPU, RAM, Node metrics |
| Grafana | Dashboard/Visualization | NA | Visualize Prometheus/Loki data |
| Loki | Log collection backend | Push | Log aggregation & filtering |
| Promtail | Log forwarder to Loki | Push | Ship logs from nodes to Loki |
🧠 Note: Push-based systems like Promtail/Loki can increase network load and cost if not optimized.
🧰 Install Grafana on Ubuntu/Debian
sudo apt-get install -y apt-transport-https software-properties-common wget
sudo wget -q -O /usr/share/keyrings/grafana.key https://apt.grafana.com/gpg.key
echo "deb [signed-by=/usr/share/keyrings/grafana.key] https://apt.grafana.com stable main" | sudo tee -a /etc/apt/sources.list.d/grafana.list
sudo apt-get update
sudo apt-get install grafana
sudo /bin/systemctl start grafana-server
🐳 Install Loki & Promtail using Docker
Download Loki Config
wget https://raw.githubusercontent.com/grafana/loki/v2.8.0/cmd/loki/loki-local-config.yaml -O loki-config.yaml
Run Loki Docker Container
docker run -d --name=loki -v $(pwd):/mnt/config -p 3100:3100 grafana/loki:2.8.0 -config.file=/mnt/config/loki-config.yaml
Download Promtail Config
wget https://raw.githubusercontent.com/grafana/loki/v2.8.0/clients/cmd/promtail/promtail-docker-config.yaml -O promtail-config.yaml
Run Promtail Docker Container
docker run -d --name=promtail -v $(pwd):/mnt/config -v /var/log:/var/log --link loki grafana/promtail:2.8.0 -config.file=/mnt/config/promtail-config.yaml
⚙️ Install Prometheus & cAdvisor
Download Prometheus Config
wget https://raw.githubusercontent.com/prometheus/prometheus/main/documentation/examples/prometheus.yml
Run Prometheus with Docker
docker run -d --name=prometheus -p 9090:9090 -v $(pwd)/prometheus.yml:/etc/prometheus/prometheus.yml prom/prometheus --config.file=/etc/prometheus/prometheus.yml
Add cAdvisor Target to Config
scrape_configs:
  - job_name: cadvisor
    scrape_interval: 5s
    static_configs:
      - targets: ['cadvisor:8080']
🐳 Using Docker Compose with Prometheus + cAdvisor
version: '3.2'
services:
  prometheus:
    image: prom/prometheus:latest
    container_name: prometheus
    ports:
      - 9090:9090
    volumes:
      - ./prometheus.yml:/etc/prometheus/prometheus.yml:ro
    depends_on:
      - cadvisor

  cadvisor:
    image: gcr.io/cadvisor/cadvisor:latest
    container_name: cadvisor
    ports:
      - 8080:8080
    volumes:
      - /:/rootfs:ro
      - /var/run:/var/run:rw
      - /sys:/sys:ro
      - /var/lib/docker/:/var/lib/docker:ro

  redis:
    image: redis:latest
    container_name: redis
    ports:
      - 6379:6379
Start and Verify
docker-compose up -d
docker-compose ps
🔍 Sample PromQL Queries
CPU Rate:
rate(container_cpu_usage_seconds_total{name="redis"}[1m])Memory Usage:
container_memory_usage_bytes{name="redis"}
🔧 Prometheus Configuration Basics
Folder:
mkdir Prometheus_configsFile:
prometheus.ymlStructure:
global:
  scrape_interval: 15s
  evaluation_interval: 15s

scrape_configs:
  - job_name: "prometheus"
    static_configs:
      - targets: ["localhost:9090"]
🧪 Metrics & Exporters
Access all metrics:
http://<prometheus-ip>:9090/metricsMetrics include:
HELP + TYPE = Description
Metric Names with Labels
Common Exporters:
Node Exporter (port
9100): OS metricscAdvisor: Container metrics
🧠 What is cAdvisor?
A container monitoring tool developed by Google.
Tracks resource usage, container performance.
Built-in Prometheus metrics support.
| Feature | Description |
| Pros | Easy setup. Docker metrics. Prometheus-native. |
| Cons | Not production-grade for logging. No alerting. |
Ingress: Traffic into a Kubernetes cluster or container.
Egress: Traffic leaving a Kubernetes cluster or container.
✅ Final Notes for Interview:
Emphasize the pull vs push monitoring difference.
Know default ports:
Prometheus 9090,Grafana 3000,Loki 3100,Node Exporter 9100,cAdvisor 8080.Understand basic
PromQL, Docker Compose, and YAML configurations.
Subscribe to my newsletter
Read articles from Pradeep Kadam directly inside your inbox. Subscribe to the newsletter, and don't miss out.
Written by
Pradeep Kadam
Pradeep Kadam
👋 Welcome to my LinkedIn profile! I'm Pradeep Kadam, a dynamic Senior UX Developer who is passionate about driving innovation and efficiency in the world of technology. With a strong background in UI development and a growing expertise in DevOps practices, I am dedicated to staying at the forefront of technology trends. During my experience as a Senior UX Developer, I realized the immense potential of DevOps in accelerating software delivery and improving collaboration between teams. This led me to embark on a transition into a DevOps Engineer role, where I can combine my creative problem-solving skills with my technical expertise to create robust and scalable solutions. I have hands-on experience with a range of DevOps tools and practices, including Jenkins for continuous integration, Git for version control, Docker for containerization, Kubernetes for orchestration, and scripting languages like Python and Bash for automation. I am also familiar with infrastructure management tools such as Ansible and Terraform.