LightningChart JS 7.1 has been released
 Omar Urbano | LightningChart
Hello again!
If this is your first time reading my blog posts, I'm Omar, and I write about data visualization application development.
This time, I'm excited to announce the new release of LightningChart JS 7.1. As you may see from my Dev.to projects, LightningChart JS is the main library I use for developing data visualization projects.
So, here's a quick review of what's new in LC JS 7.1:
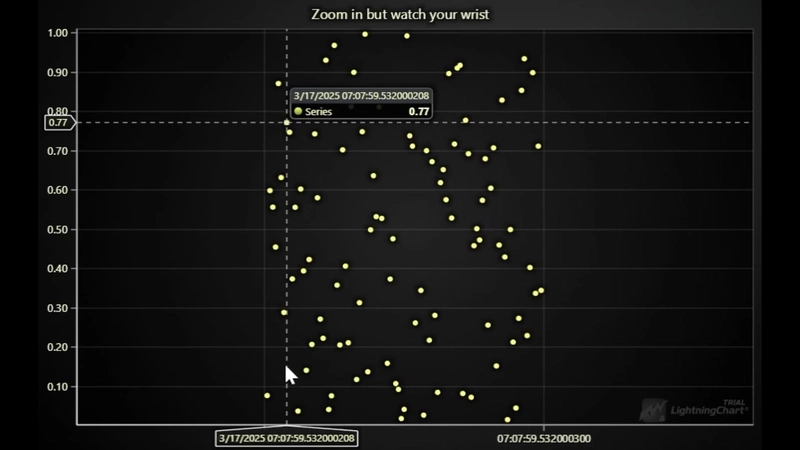
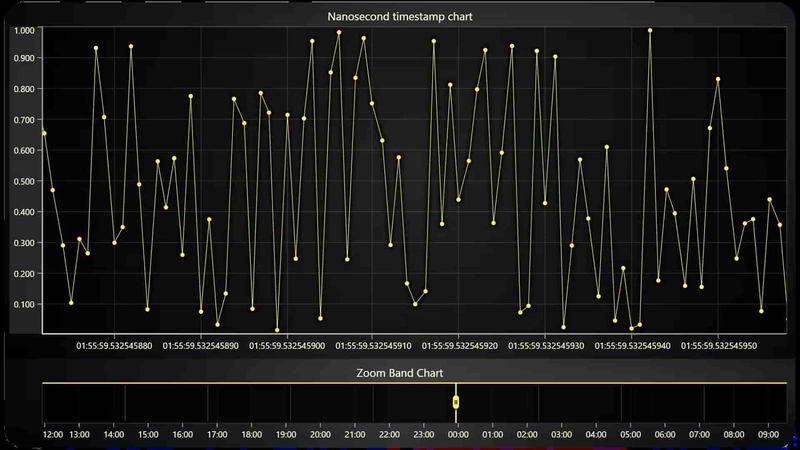
Nanosecond Timestamp Support
LightningChart JS 7.1 introduces enhanced Date-Time axis capabilities with nanosecond support.
Users can now zoom to micro- and nanosecond levels for detailed time-based data analysis, surpassing previous millisecond limitations.
HTML Text Rendering
LightningChart JS 7.1 introduces an option for HTML text rendering. This alternative to the default WebGL rendering enhances text sharpness and enables the display of advanced text formats such as LaTeX and multi-line text.
Real-time scrolling axis
LightningChart JS 7.1 introduces a new scrolling mode for axes, specifically optimized for batched data updates (e.g., data arriving every few seconds).
New axis fitting modes
LightningChart JS 7.1 introduces new fitting modes for axes:
Top (Default): Fits the axis to display all data within the current visible range, consistent with previous behavior.
Center: Fits the axis against the entire dataset, maintaining a stationary value axis.
Bottom: Anchors the axis to a specific start value (e.g., 0) and fits the end against the entire dataset.
New Chart Examples
JavaScript Synced Cursors Chart

JavaScript Nanosecond Timestamp Chart
Get Started with LightningChart JS
Access the latest version with a 30-day free trial. Or read the official release note.
Written by:
Omar Urbano | Software Engineer & Technical Writer
Send me your questions via LinkedIn
Subscribe to my newsletter
Read articles from Omar Urbano | LightningChart directly inside your inbox. Subscribe to the newsletter, and don't miss out.
Written by
Omar Urbano | LightningChart
Omar Urbano | LightningChart
Hi! I'm a Software Engineer from Mexico and a data visualization enthusiast. I'm currently writing technical articles about data visualization and high-performance charts.