How to Perform Performance Testing on a Website: A Beginner's Guide
 Syket Bhattachergee
Introduction
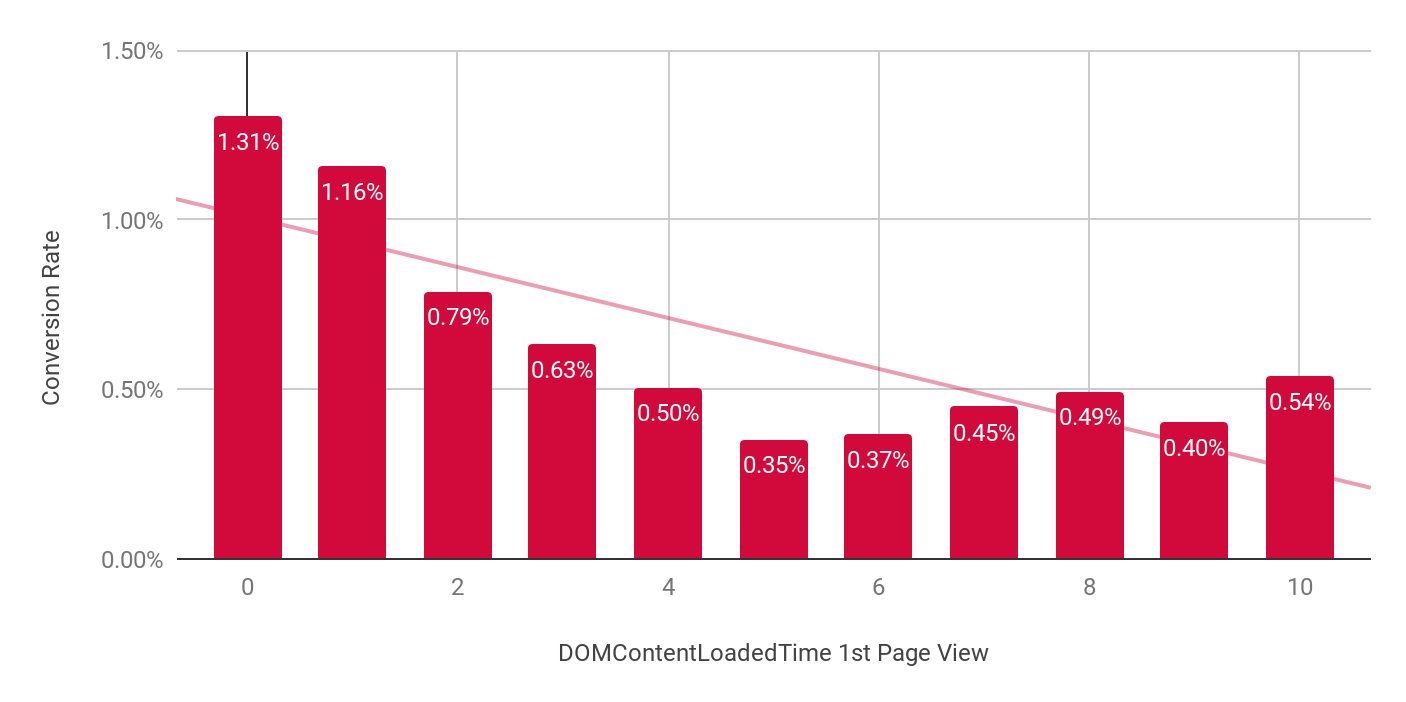
Website performance can make or break the user experience. A delay of just one second in page load time can reduce conversions by 7%, while 53% of mobile users abandon sites that take longer than three seconds to load. Performance testing identifies these issues before they impact your users and business.

This comprehensive guide walks you through the fundamentals of performance testing for websites—from understanding core concepts to implementing effective testing strategies. Whether you're a developer, QA engineer, or website owner, you'll learn practical techniques to ensure your site performs optimally under various conditions.
Understanding Performance Testing
What is Performance Testing?
Performance testing is a systematic process of determining how a website behaves under specific conditions. Unlike functional testing (which verifies if a system works correctly), performance testing examines speed, responsiveness, stability, and scalability under expected and extreme conditions.
The goal is to identify and eliminate bottlenecks before they affect end users by measuring metrics like response time, throughput, and resource utilization.
Types of Performance Testing
Different performance testing methods assess various aspects of your website's capabilities:
| Test Type | Purpose | When to Use |
| Load Testing | Evaluates performance under expected user loads | Before major releases or traffic increases |
| Stress Testing | Determines breaking points by testing beyond normal capacity | To establish system limits and failure scenarios |
| Endurance/Soak Testing | Checks system behavior under sustained load over extended periods | To identify memory leaks and resource depletion issues |
| Spike Testing | Assesses response to sudden, significant load increases | For sites expecting flash crowds or viral content |
| Volume Testing | Tests handling of large data volumes | For data-intensive applications |
| Scalability Testing | Measures how effectively the system scales with increased resources | When planning infrastructure changes |
The Performance Testing Process
An effective performance testing cycle follows these stages:
Test Planning: Define objectives, scope, and scenarios
Test Environment Setup: Configure testing infrastructure
Test Design: Create realistic user journeys and scripts
Test Execution: Run the tests while monitoring system behavior
Results Analysis: Interpret data and identify bottlenecks
Optimization: Implement improvements based on findings
Retesting: Validate that optimizations resolved the issues
Why Performance Matters for Websites
Business Impact of Website Performance
Website performance directly affects key business metrics:
Conversion rates: Amazon found that every 100ms of latency costs them 1% in sales
Bounce rates: Google discovered that as page load time increases from 1s to 3s, bounce probability increases by 32%
User engagement: Pinterest increased search engine traffic and sign-ups by 15% when they reduced perceived wait times by 40%
Revenue: Walmart observed a 2% increase in conversions for every 1-second improvement in page load time
Performance and User Experience
Users have increasingly high expectations for website performance:
79% of shoppers who experience poor website performance say they won't return to the site
47% of users expect websites to load in under 2 seconds
38% of users will stop engaging with a website if the layout is unattractive or slow
Mobile users are 5 times more likely to abandon tasks if a site isn't optimized for mobile devices
SEO and Performance
Since 2010, Google has included site speed as a ranking factor, and it became even more significant with the introduction of Core Web Vitals in 2021:
Faster sites get crawled more frequently and efficiently
Core Web Vitals (LCP, FID, CLS) directly impact search rankings
Mobile-first indexing prioritizes well-performing mobile sites
Better user experience signals (lower bounce rates, higher engagement) indirectly boost SEO performance
Preparing for Performance Testing
Essential Performance Testing Tools
Several tools can help you conduct effective performance tests:
Open Source Options:
Apache JMeter: Comprehensive load testing tool with a GUI
Gatling: Code-based performance testing with excellent reporting
Locust: Python-based tool focusing on developer-friendly scripting
k6: Modern load testing tool with JavaScript support
Commercial Solutions:
LoadRunner: Enterprise-grade performance testing suite
BlazeMeter: JMeter-compatible cloud testing platform
New Relic: Application performance monitoring with testing capabilities
Dynatrace: AI-powered performance testing and monitoring
Browser-Based Tools:
Lighthouse: Built into Chrome DevTools for performance audits
WebPageTest: Detailed performance analysis from multiple locations
PageSpeed Insights: Google's tool for performance optimization recommendations
Setting Up Your Testing Environment
To create an effective testing environment:
Define test scope: Determine which components and user flows to test
Select proper infrastructure: Choose between on-premises, cloud, or hybrid solutions
Match production conditions: Configure an environment that mirrors your production setup
Establish baseline metrics: Document current performance as a reference point
Configure monitoring tools: Set up tools to capture server, network, and client-side metrics
Isolate the environment: Prevent external factors from affecting test results
Defining Performance Goals
Establish clear, measurable objectives using the following metrics:
Response Time Metrics:
Page load time: Time from navigation start to page fully loaded (aim for < 3 seconds)
Time to First Byte (TTFB): Time until the first byte of response is received (aim for < 200ms)
First Contentful Paint (FCP): Time until first content appears (aim for < 1.8 seconds)
Largest Contentful Paint (LCP): Time until largest content element visible (aim for < 2.5 seconds)
User Experience Metrics:
First Input Delay (FID): Time before browser responds to interaction (aim for < 100ms)
Cumulative Layout Shift (CLS): Measures visual stability (aim for < 0.1)
Time to Interactive (TTI): When the page becomes fully interactive (aim for < 3.8 seconds)
Server Metrics:
Throughput: Requests per second the system can handle
Error rate: Percentage of requests resulting in errors (aim for < 1%)
CPU/Memory utilization: Resource consumption under load (aim for < 80%)
Conducting Performance Tests
Planning Your Test Scenarios
Effective test scenarios reflect real user behavior:
Identify critical user journeys: Focus on high-traffic and business-critical paths
Define user profiles: Create different user types with varied behaviors
Establish realistic pacing: Include natural pauses and think times
Consider device and network variations: Test across different devices and connection speeds
Plan for data variations: Account for different data inputs and outputs
Include edge cases: Test both common and uncommon usage patterns
Load Testing Implementation
To implement a basic load test with Apache JMeter:
Create a Test Plan: Define the overall testing strategy
Add Thread Groups: Specify the number of users and ramp-up period
Add HTTP Request samplers: Define the URLs to test
Add Listeners: Configure result collectors and reports
Configure Assertions: Set pass/fail criteria
Run the test: Execute and monitor results
Example JMeter script configuration:
Thread Group:
- Number of Threads (Users): 100
- Ramp-up Period: 300 seconds
- Loop Count: 10

HTTP Request:
- Protocol: https
- Server Name: example.com
- Path: /homepage
- Method: GET

Listeners:
- View Results Tree
- Summary Report
- Aggregate Report
Real-World Testing Approaches
Gradual Load Increase:
Start with a small number of users and gradually increase to identify the point where performance degrades.
Example script:
for (users = 10; users <= 1000; users += 10) {
    startTest(users, 60); // 60-second test at each level
    recordMetrics();
    if (responseTime > threshold) {
        reportBreakingPoint(users);
        break;
    }
}
Geographic Distribution:
Test from multiple locations to account for CDN performance and regional differences.
Example test configuration:
North America: 40% of users
Europe: 30% of users
Asia: 20% of users
Rest of World: 10% of users
Mobile vs. Desktop:
Configure different user profiles to simulate various device types.
Example profile settings:
Mobile:
- Connection: 4G (5 Mbps)
- Browser: Mobile Chrome/Safari
- Headers: Mobile User-Agent

Desktop:
- Connection: Broadband (20 Mbps)
- Browser: Desktop Chrome/Firefox
- Headers: Desktop User-Agent
Analyzing Test Results
Interpreting Performance Data
When analyzing test results, focus on:
Response time distribution: Look beyond averages to percentiles
50th percentile (median) shows the typical user experience
90th percentile reveals poor experiences for 10% of users
99th percentile identifies the worst-case scenarios
Error analysis: Categorize errors by:
Type (timeout, server error, etc.)
Frequency (sporadic vs. consistent)
Impact (affecting specific features vs. the entire system)
Resource utilization patterns:
Identify resource saturation points (CPU, memory, I/O)
Look for correlations between resource utilization and performance degradation
Analyze scaling behavior as load increases
Common Performance Bottlenecks
| Bottleneck Type | Symptoms | Common Causes |
| Server-side | High CPU/memory usage, long processing times | Inefficient code, database issues, inadequate caching |
| Database | Slow queries, high I/O wait times | Missing indexes, poor query design, inadequate connection pooling |
| Network | High latency, packet loss | Insufficient bandwidth, network congestion, DNS issues |
| Frontend | Slow rendering, high JavaScript execution time | Large JavaScript bundles, render-blocking resources, excessive DOM size |
| Third-party services | Delayed load completion, timeouts | Slow API responses, unoptimized external scripts |
Visual Analysis Techniques
Use waterfall charts and heatmaps to identify issues:
Waterfall charts help identify:
Render-blocking resources
Long server response times
Resource loading order issues
Content delivery inefficiencies
Heatmaps reveal:
Performance variations across geographic regions
Time-based performance patterns
Correlation between user actions and performance issues
Section 6: Optimizing Website Performance
Frontend Optimization Strategies
Image Optimization:
Use WebP or AVIF formats for better compression
Implement responsive images with srcset
Lazy-load images below the fold
Optimize image dimensions and quality
Example implementation:
<img
  src="small.jpg"
  srcset="small.jpg 400w, medium.jpg 800w, large.jpg 1200w"
  sizes="(max-width: 600px) 400px, (max-width: 1200px) 800px, 1200px"
  loading="lazy"
  alt="Optimized responsive image"
/>
JavaScript Optimization:
Implement code splitting and lazy loading
Minimize and compress JavaScript files
Use async/defer attributes for non-critical scripts
Remove unused code and reduce dependencies
CSS Optimization:
Inline critical CSS
Load non-critical CSS asynchronously
Remove unused styles
Minimize and compress CSS files
Backend Optimization Strategies
Caching Implementation:
Set up proper HTTP caching headers
Implement browser caching for static assets
Use CDN caching for global content delivery
Implement application-level caching
Example cache control headers:
Cache-Control: public, max-age=31536000, immutable  // For static resources that never change
Cache-Control: public, max-age=86400, must-revalidate  // For resources that change daily
Cache-Control: no-cache  // For dynamic content requiring validation
Database Optimization:
Add appropriate indexes
Optimize query structure
Implement connection pooling
Consider read replicas for high-traffic sites
Server Configuration:
Enable HTTP/2 or HTTP/3
Configure proper GZIP/Brotli compression
Optimize server threading and timeouts
Implement load balancing for high-traffic sites
Infrastructure Optimization
Content Delivery Network (CDN):
Distribute static assets across global edge servers
Enable edge caching for dynamic content where possible
Use CDN for SSL termination to reduce server load
Scaling Strategies:
Horizontal scaling: Add more servers to distribute the load
Vertical scaling: Increase resources on existing servers
Auto-scaling: Dynamically adjust resources based on demand
Section 7: Continuous Performance Testing
Integrating Performance Testing into CI/CD
Incorporate performance testing into your development workflow:
Establish baseline performance metrics for comparison
Create automated performance test suites that run on each build
Define performance budgets and enforce them in CI/CD pipelines
Configure alerts for performance regressions
Generate automated reports for stakeholder review
Example Jenkins pipeline configuration:
pipeline {
    agent any
    stages {
        stage('Build') { ... }
        stage('Unit Tests') { ... }
        stage('Performance Tests') {
            steps {
                sh 'jmeter -n -t load_test.jmx -l results.jtl'
                perfReport 'results.jtl'
            }
            post {
                always {
                    perfPublisher threshold: 80
                }
            }
        }
        stage('Deploy') { ... }
    }
}
Real-Time Monitoring
Implement continuous monitoring to catch issues early:
User-centric monitoring: Collect real user metrics (RUM) to understand actual user experience
Synthetic monitoring: Schedule regular tests from different locations
Server monitoring: Track resource utilization and application performance
Alert configuration: Set up notifications for performance anomalies
Performance Testing Best Practices
Test Early and Often:
Shift performance testing left in the development cycle
Run smaller tests during development to catch issues early
Perform comprehensive tests before major releases
Focus on the User Experience:
Prioritize testing user-critical paths
Measure perceived performance, not just technical metrics
Test across various devices and network conditions
Maintain Performance Knowledge Base:
Document performance patterns and solutions
Create reusable test scripts and scenarios
Share performance insights across development teams
Conclusion
Performance testing is not a one-time activity but an essential ongoing website development and maintenance process. By implementing the strategies outlined in this guide, you can identify and resolve performance issues before they impact your users and business outcomes.
Remember these key takeaways:
Performance directly impacts user experience, conversion rates, and SEO rankings
Different types of performance tests serve different purposes—use the right test for your goals
Establish clear performance metrics and benchmarks before testing
Analyze both frontend and backend components to identify bottlenecks
Implement a continuous performance testing strategy integrated with your development workflow
As web technologies and user expectations evolve, staying vigilant about performance will ensure your website remains competitive, user-friendly, and effective at achieving your business goals.
We at CreoWis believe in sharing knowledge publicly to help the developer community grow. Let’s collaborate, ideate, and craft passion to deliver awe-inspiring product experiences to the world.
Let's connect:
This article is crafted by Syket Bhattachergee, a passionate developer at CreoWis. You can reach out to him on X/Twitter, LinkedIn, and follow his work on the GitHub.
Subscribe to my newsletter
Read articles from Syket Bhattachergee directly inside your inbox. Subscribe to the newsletter, and don't miss out.
Written by
Syket Bhattachergee
Syket Bhattachergee
🚀 Hey there, I'm Syket, a passionate Software Engineer with a love for crafting extraordinary solutions using the power of React, Next.js, Typescript, Express, and MongoDB. 🚀 🌟 With a focus on scalability and robustness, I embark on coding adventures that push the boundaries of what's possible. 🌟 📚 Lifelong learning is my mantra, and I thrive on mastering new technologies in record time. Whether it's learning the latest libraries or staying ahead of the curve with emerging trends, I'm always up for the challenge. 💡 🔧 Efficiency is my middle name, and I'm all about embracing automation to make our lives as developers smoother and more productive. Less time spent on repetitive tasks means more time for groundbreaking innovations. 💻 💡 A clean code advocate, I believe in the power of elegant solutions that are easy to maintain and delight to collaborate on. Let's create code that's not just functional but a masterpiece of art. 🎨 🤝 Building strong and trusting teams is my superpower. Leading with empathy, I thrive in collaborative environments where diverse perspectives create the most remarkable outcomes. Let's forge a team that's unstoppable. 🤝 🏆 When it comes to project completion, success is the only option. I'm a tenacious problem-solver, and I won't rest until our projects shine brightly with unparalleled achievements. 🏆 🌟 Let's connect and build something extraordinary together!