Handling Class Imbalance
 Edward Tian
What is class imbalance? When we’re dealing with a classification task, we have a model that tries to classify a record into some sort of category. Sometimes it’s whether or not a tumor is cancerous, or whether or not an application for a loan is acceptable.
So let’s imagine a model needs to determine a binary output, that is the model has to predict whether or not a record is one of two things (for now, let’s assume cancerous vs non-cancerous, since the medical industry is rife with class imbalance problems).
For each record, the model has a guess, and the record has an actual value, so we have 4 possible outcomes:
The model guessed that the record represented a cancerous tumor, and the patient indeed had a cancerous tumor. This is known as a true positive.
The model guessed cancerous, but the patient actually had a benign tumor. This is known as a false positive.
The model guessed benign, but the patient had a cancerous tumor (yikes!). This would be considered a false negative.
The model guessed benign, and the patient indeed had a benign tumor. This is called a true negative.
When we train and then evaluate a model, I find that the gut instinct is to first look at the accuracy of the model. This is usually given in a percentage representing the % of records that the model predicted correctly. That is:
(True Positive + True Negative) / # of Records
But accuracy isn’t always a great metric to determine whether or not a model is sound. Consider a data set that had 100 records, and only one of them represented a patient with a cancerous tumor. I could give you a model that has 99% predictive accuracy, and I didn’t even write any code: just predict that all of the patients are totally fine.
Here lies the class imbalance problem. Models tend to get a “lazy” bias when the data they train on is already biased towards one class. In this case, we’d want to examine some other metrics, such as sensitivity (True Positive / [True Positive + False Negative]) or specificity (True Negative / [False Positive + True Negative]).
In my code, I tackle a data set involving customer churn from a telecommunications service provider. If you look at these density graphs:

You can see that there are fewer churns (Yes’s) than customers who are still present. It’s more clear when we examine total charges:

I present two different approaches to fighting against class imbalance: one involves using the SMOTE function in DMwR (Data Mining with R), and the other is using a cost matrix to whip the model back into shape, incentivizing predictions of true positives over true negatives.
SMOTE:
SMOTE generates new, nearest-neighbor records from whatever your data’s minority class is, while simultaneously under-sampling from the majority class. This results in data that is more balanced. When I use SMOTE in my code, it’s very important to see when the smoting takes place. My first time using SMOTE, everyone in my group assignment had better “results” than me, with high accuracy and sensitivity across the board, but they all used SMOTE wrong, so all we could do was submit my work and hope for the best – no discussion, no comparisons, nothing. If you SMOTE your data incorrectly, your resulting models are simply invalid, because you are basing the optimization and modifications of your model on biased evaluation metrics.
The most common mistake is to SMOTE the data right away. Make sure the model never sees any class imbalance, and then we won’t have any class imbalance problems in the model, right? Wrong. You should partition your data for cross-validation first, creating the training and test data sets. Then, you SMOTE only the training dataset.
We do this because the purpose of the test data set is to see how the model performs with new data under real-world conditions. If the test data set was already SMOTED, then they’re no longer real-world conditions; we won’t be able to know whether or not the model is able to perform well when faced with imbalanced data.
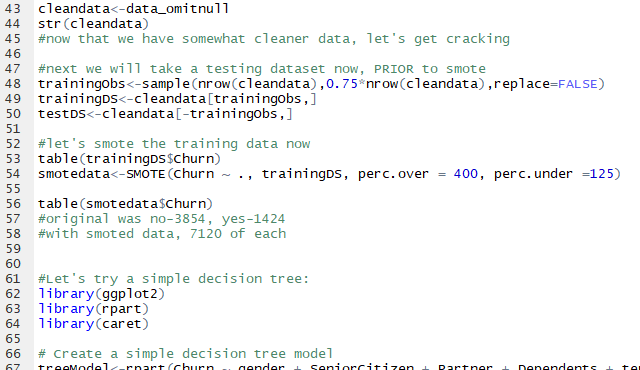
You can see around line 45 where I smote the data, and compare the original to the smoted data:
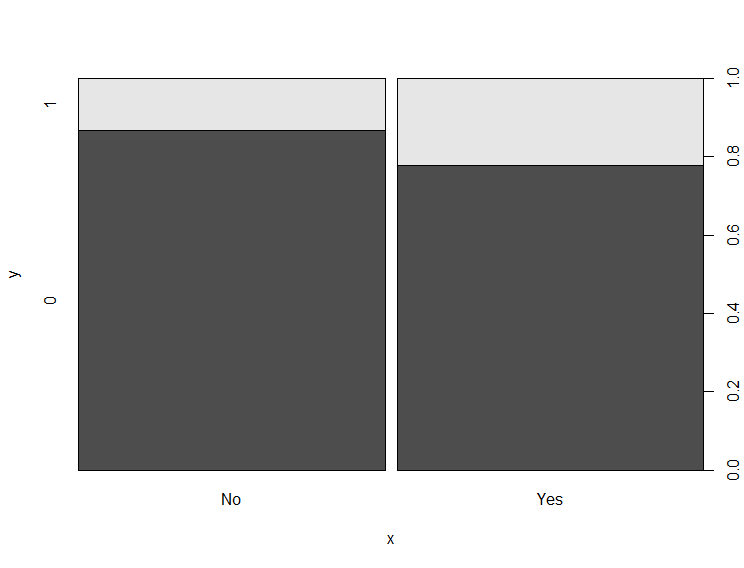
We can look at a plot of churn vs non-churn records in context with whether or not the customer was a senior citizen in the clean data:

And we can see the class imbalance problem – there are so many more no’s than there are yes’s (there are also way more young people than senior citizens, but since that’s not our target variable, it’s not an issue). Now, if we look at the same plot, but with the smoted data:
The class imbalance is gone. This data would be much better for the model to train on.
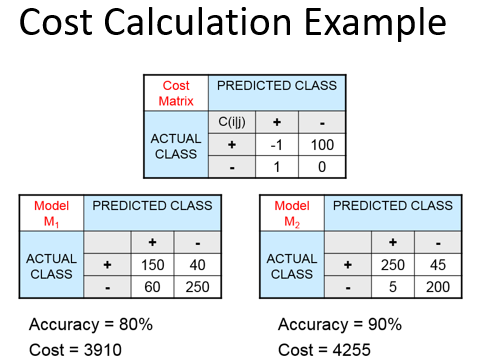
COST MATRICES:
Another technique to fight against class imbalance is to introduce a cost matrix. A cost matrix allows you to assign a cost to each outcome (True Positive, False Negative, False Positive, True Negative). This means you can redirect the predictive power of your model. One way would be to assign a larger cost to true negatives than true positives in order for your model to try harder at finding the positive records. While this may cause your accuracy to drop, your specificity or sensitivity (depending on where the imbalance is) may increase, which is often the goal.
Subscribe to my newsletter
Read articles from Edward Tian directly inside your inbox. Subscribe to the newsletter, and don't miss out.
Written by