Autoscaling TensorFlow Model Deployments with TF Serving and Kubernetes - GSP777
 David Nguyen
Table of contents
- Overview
- Setup and requirements
- Lab tasks
- Task 1. Getting lab files
- Task 2. Creating a GKE cluster
- Task 3. Deploying ResNet101
- Task 4. Creating ConfigMap
- Task 5. Creating TensorFlow Serving deployment
- Task 6. Exposing the deployment
- Task 7. Configuring horizontal pod autoscaler
- Task 8. Testing the model
- Task 9. Installing Locust
- Task 10. Starting a load test
- Task 11. Monitoring the load test
- Task 12. Stopping the load test
- Solution of Lab

Overview
Serving deep learning models can be especially challenging. The models are often large, requiring gigabytes of memory. They are also very compute intensive - a small number of concurrent requests can fully utilize a CPU or GPU. Automatic horizontal scaling is one of the primary strategies used in architecting scalable and reliable model serving infrastructures for deep learning models.
In this lab, you will use TensorFlow Serving and Google Cloud Kubernetes Engine (GKE) to configure a high-performance, autoscalable serving system for TensorFlow models.
Objectives
In this lab, you will learn how to:
Configure a GKE cluster with an autoscaling node pool.
Deploy TensorFlow Serving in an autoscalable configuration.
Monitor serving performance and resource utilization
Prerequisites
To successfully complete the lab you need to have a solid understanding of how to save and load TensorFlow models and a basic familiarity with Kubernetes concepts and architecture. Before proceeding with the lab it is recommended to review the following resources:
Lab scenario
You will use TensorFlow Serving to deploy the ResNet101 model. TensorFlow Serving is a flexible, high-performance serving system for machine learning models, designed for production environments. TensorFlow Serving makes it easy to deploy new algorithms and experiments, while keeping the same server architecture and APIs. TensorFlow Serving provides out-of-the-box integration with TensorFlow models, but can be easily extended to serve other types of models and data.
TensorFlow Serving can be run in a docker container and deployed and managed by Kubernetes. In the lab, you will deploy TensorFlow Serving as a Kubernetes Deployment on Google Cloud Kubernetes Engine (GKE) and use Kubernetes Horizontal Pod Autoscaler to automatically scale the number of TensorFlow Serving replicas based on observed CPU utilization. You will also use GKE Cluster Autoscaler to automatically resize your GKE cluster's node pool based on the resource demands generated by the TensorFlow Serving Deployment.
Horizontal Pod Autoscaler automatically scales the number of Pods in a replication controller, deployment, replica set or stateful set based on observed CPU utilization (or, with custom metrics support, on some other application-provided metrics). Horizontal Pod Autoscaler is implemented as a Kubernetes API resource and a controller. The resource determines the behavior of the controller. The controller periodically adjusts the number of replicas in a replication controller or deployment to match the observed average CPU utilization to the target specified by the user.
GKE's Cluster Autoscaler automatically resizes the number of nodes in a given node pool, based on the demands of your workloads. You don't need to manually add or remove nodes or over-provision your node pools. Instead, you specify a minimum and maximum size for the node pool, and the rest is automatic.
After configuring the cluster and deploying TensorFlow Serving you will use an open source load testing tool Locust to generate prediction requests against the ResNet101 model and observe how the model deployment automatically scales up and down based on the load.
Summary of the tasks performed during the lab:
Create a GKE cluster with autoscaling enabled on a default node pool
Deploy the pretrained ResNet101 model using TensorFlow Serving
Configure Horizontal Pod Autoscaler
Install Locust
Load the ResNet101 model
Monitor the model deployment
Setup and requirements
Before you click the Start Lab button
Read these instructions. Labs are timed and you cannot pause them. The timer, which starts when you click Start Lab, shows how long Google Cloud resources are made available to you.
This hands-on lab lets you do the lab activities in a real cloud environment, not in a simulation or demo environment. It does so by giving you new, temporary credentials you use to sign in and access Google Cloud for the duration of the lab.
To complete this lab, you need:
- Access to a standard internet browser (Chrome browser recommended).
Note: Use an Incognito (recommended) or private browser window to run this lab. This prevents conflicts between your personal account and the student account, which may cause extra charges incurred to your personal account.
- Time to complete the lab—remember, once you start, you cannot pause a lab.
Note: Use only the student account for this lab. If you use a different Google Cloud account, you may incur charges to that account.
How to start your lab and sign in to the Google Cloud console
Click the Start Lab button. If you need to pay for the lab, a dialog opens for you to select your payment method. On the left is the Lab Details pane with the following:
The Open Google Cloud console button
Time remaining
The temporary credentials that you must use for this lab
Other information, if needed, to step through this lab
Click Open Google Cloud console (or right-click and select Open Link in Incognito Window if you are running the Chrome browser).
The lab spins up resources, and then opens another tab that shows the Sign in page.
Tip: Arrange the tabs in separate windows, side-by-side.
Note: If you see the Choose an account dialog, click Use Another Account.
If necessary, copy the Username below and paste it into the Sign in dialog.
student-04-b179b49d2382@qwiklabs.netYou can also find the Username in the Lab Details pane.
Click Next.
Copy the Password below and paste it into the Welcome dialog.
rBNYlkXmqcF7You can also find the Password in the Lab Details pane.
Click Next.
Important: You must use the credentials the lab provides you. Do not use your Google Cloud account credentials.
Note: Using your own Google Cloud account for this lab may incur extra charges.
Click through the subsequent pages:
Accept the terms and conditions.
Do not add recovery options or two-factor authentication (because this is a temporary account).
Do not sign up for free trials.
After a few moments, the Google Cloud console opens in this tab.
Note: To access Google Cloud products and services, click the Navigation menu or type the service or product name in the Search field.

Activate Cloud Shell
Cloud Shell is a virtual machine that is loaded with development tools. It offers a persistent 5GB home directory and runs on the Google Cloud. Cloud Shell provides command-line access to your Google Cloud resources.
Click Activate Cloud Shell at the top of the Google Cloud console.
Click through the following windows:
Continue through the Cloud Shell information window.
Authorize Cloud Shell to use your credentials to make Google Cloud API calls.
When you are connected, you are already authenticated, and the project is set to your Project_ID, qwiklabs-gcp-01-3f7d313d13f2. The output contains a line that declares the Project_ID for this session:
Your Cloud Platform project in this session is set to qwiklabs-gcp-01-3f7d313d13f2
gcloud is the command-line tool for Google Cloud. It comes pre-installed on Cloud Shell and supports tab-completion.
- (Optional) You can list the active account name with this command:
gcloud auth list
- Click Authorize.
Output:
ACTIVE: *
ACCOUNT: student-04-b179b49d2382@qwiklabs.net

To set the active account, run:
    $ gcloud config set account `ACCOUNT`
- (Optional) You can list the project ID with this command:
gcloud config list project
Output:
[core]
project = qwiklabs-gcp-01-3f7d313d13f2
Note: For full documentation of gcloud, in Google Cloud, refer to the gcloud CLI overview guide.
Lab tasks
You will use Cloud Shell and Cloud Console for all of the tasks in the lab. Some tasks require you to edit text files. You can use any of the classic command line text editors pre-installed in Cloud Shell, including vim, emacs, or nano. You can also use the built-in Cloud Shell Editor.
Before proceeding, make sure that you completed the Activate Cloud Shell step in the Setup and requirements instructions and your Cloud Shell is open and ready.
Task 1. Getting lab files
- Start by getting the lab files from GitHub:
cd
SRC_REPO=https://github.com/GoogleCloudPlatform/mlops-on-gcp
kpt pkg get $SRC_REPO/workshops/mlep-qwiklabs/tfserving-gke-autoscaling tfserving-gke
cd tfserving-gke
Task 2. Creating a GKE cluster
- Set the default compute zone and a couple of environment variables to store your project id and cluster name:
gcloud config set compute/zone us-east1-b

PROJECT_ID=$(gcloud config get-value project)
CLUSTER_NAME=cluster-1
- To create a cluster execute the below command - it may take a few minutes to complete:
gcloud beta container clusters create $CLUSTER_NAME \
  --cluster-version=latest \
  --machine-type=e2-standard-4 \
  --enable-autoscaling \
  --min-nodes=1 \
  --max-nodes=3 \
  --num-nodes=1
After the command completes you should see the output similar to one below:
To inspect the contents of your cluster, go to: https://console.cloud.google.com/kubernetes/workload_/gcloud/us-east1-b/cluster-1?project=qwiklabs-gcp-00-aea5e829799a
kubeconfig entry generated for cluster-1.
NAME: cluster-1
LOCATION: us-east1-b
MASTER_VERSION: 1.24.1-gke.1400
MASTER_IP: 34.67.10.235
MACHINE_TYPE: e2-standard-4
NODE_VERSION: 1.24.1-gke.1400
NUM_NODES: 1
STATUS: RUNNING
Click Check my progress to verify the objective.
Create a GKE cluster
Check my progress
The command created a CPU-based GKE cluster. The cluster has a default node pool, which is configured to autoscale from 1 to 3 nodes. Initially, the node pool has only one node.
- Get the credentials for you new cluster so you can interact with it using
kubectl:
gcloud container clusters get-credentials $CLUSTER_NAME
Task 3. Deploying ResNet101
The pretrained ResNet101 model in the SavedModel format has been uploaded to a public Cloud Storage location.
You will first download the model files to a storage bucket in your project. Since storage buckets are a global resource in Google Cloud you have to use a unique bucket name. For the purpose of this lab, you can use your project id as a name prefix.
- To create a storage bucket in your project:
export MODEL_BUCKET=${PROJECT_ID}-bucket
gsutil mb gs://${MODEL_BUCKET}
- After the bucket has been created, copy the model files:
gsutil cp -r gs://spls/gsp777/resnet_101 gs://${MODEL_BUCKET}
Click Check my progress to verify the objective.
Create a storage bucket and upload model files into it
Check my progress
You are now ready to deploy TensorFlow Serving to GKE and configure it to serve the ResNet101 model. You will deploy TF Serving in four steps:
First you will create a Kubernetes ConfigMap that points to the location of the ResNet101 model in your storage bucket.
Then, you will create a Kubernetes Deployment using a standard TensorFlow Serving image from Docker Hub.
When the deployment is ready, you will create a Kubernetes Service to expose the deployment through a load balancer.
Finally, you will configure Horizontal Pod Autoscaler.
Task 4. Creating ConfigMap
- Use your preferred command line editor or Cloud Shell Editor to update the
MODEL_PATHfield in thetf-serving/configmap.yamlfile to reference your bucket. Recall that the bucket name was stored in the $MODEL_BUCKET environment variable:
echo $MODEL_BUCKET
sed -i "s/your-bucket-name/$MODEL_BUCKET/g" tf-serving/configmap.yaml
After the update the configmap.yaml should look similar to the one below:
apiVersion: v1
kind: ConfigMap
metadata:
  name: tfserving-configs
data:
  MODEL_NAME: image_classifier
  MODEL_PATH: gs://qwiklabs-gcp-03-4b91a600a7a2-bucket/resnet_101
- Using
kubectlcreate the ConfigMap:
kubectl apply -f tf-serving/configmap.yaml
Click Check my progress to verify the objective.
Create a Kubernetes ConfigMap
Check my progress
Task 5. Creating TensorFlow Serving deployment
- Inspect the manifest for the TensorFlow Serving deployment:
cat tf-serving/deployment.yaml
Notice that the TF Serving process is configured to serve the model referenced by the MODEL_PATH environment variable and that this variable is set by the ConfigMap you created in the previous step.
...
    spec:
      containers:
      - name: tf-serving
        image: "tensorflow/serving"
        args:
        - "--model_name=$(MODEL_NAME)"
        - "--model_base_path=$(MODEL_PATH)"
        envFrom:
        - configMapRef:
            name: tfserving-configs
...
Also notice that the deployment is configured to start with one replica.
...
apiVersion: apps/v1
kind: Deployment
metadata:
  name: image-classifier
  namespace: default
  labels:
    app: image-classifier
spec:
  replicas: 1
...
In the deployment manifest, there is an explicit request for CPU and RAM resources:
...
resources:
  requests:
    cpu: "3"
    memory: 4Gi
...
At start, each replica requests 3 CPUs and 4 Gigabytes of RAM. Your cluster is configured with e2-standard-4 nodes that have 4 virtual CPUs and 15GB or RAM. It means that only a single replica can run on a node.
- Create the deployment:
kubectl apply -f tf-serving/deployment.yaml
It may take a few minutes before the deployment is ready.
- To check the status of the deployment:
kubectl get deployments
- Wait till the READY column in the output of the previous command changes to
1/1.
Click Check my progress to verify the objective.
Create a TensorFlow Serving deployment
Check my progress
Task 6. Exposing the deployment
1.Inspect the manifest for the service:
cat tf-serving/service.yaml
Notice that the service is of type LoadBalancer and that it exposes two ports: 8500 and 8501. By default, Tensorflow Serving uses port 8500 for the gRPC interface and port 8501 for the REST interface.
...
spec:
  type: LoadBalancer
  ports:
  - port: 8500
    protocol: TCP
    name: tf-serving-grpc
  - port: 8501
    protocol: TCP
    name: tf-serving-http
  selector:
    app: image-classifier
...
- Create the service:
kubectl apply -f tf-serving/service.yaml
It may take a few minutes before the service is operational. Wait till the external IP address exposed by the service has been set.
- You can check the status of provisioning the service by executing the following command:
kubectl get svc image-classifier
When the service is ready, you should see output that provides service details.
Click Check my progress to verify the objective.
Create a Kubernetes service
Check my progress
Task 7. Configuring horizontal pod autoscaler
The final step is to add Horizontal Pod Autoscaler (HPA). The command below configures HPA to start a new replica of TensorFlow Serving whenever the mean CPU utilization across all already running replicas reaches 60%. HPA will attempt to create up to 4 replicas and scale down to 1 replica.
- Enter the command:
kubectl autoscale deployment image-classifier \
--cpu-percent=60 \
--min=1 \
--max=4
- Check the status of the HPA:
kubectl get hpa
Click Check my progress to verify the objective.
Add a horizontal pod autoscaler(HPA)
Check my progress
Task 8. Testing the model
The Tensorflow Serving model server is now up and running. You can test it by submitting a request using the curl command. In the locust folder you can find a sample request body (request-body.json) formatted to conform to the TensorFlow Serving REST API. It contains a picture of Grace Hopper.
- To invoke the model set the
EXTERNAL_IPenvironment variable to the external IP of your service and execute thecurlcommand:
EXTERNAL_IP=[YOUR_SERVICE_IP]
curl -d @locust/request-body.json -X POST http://${EXTERNAL_IP}:8501/v1/models/image_classifier:predict
The response returned by the model includes the list of the 5 most likely labels with the associated probabilities.
Task 9. Installing Locust
You are now ready to load test the ResNet101 model. As described previously, you will use an open source load testing tool Locust to generate prediction requests.
- To install Locust:
pip3 install locust==1.4.1
The installation process can take a few minutes. The Locust command line interface (CLI) gets installed into the ~/.local/bin folder which is not on PATH.
- You need to add this folder to PATH:
export PATH=~/.local/bin:$PATH
- To validate the installation and show the Locust version number:
locust -V
Task 10. Starting a load test
The locust folder contains the Locust script that generates prediction requests against the ResNet101 model. The script uses the same request body you used previously to verify the TensorFlow Serving deployment. The script is configured to progressively increase the number of simulated users that send prediction requests to the ResNet101 model. After reaching the maximum number of configured users, the script stops generating the load. The number of users is adjusted every 60s.
Refer to Locust documentation for more information on Locust settings.
- To start the test, execute the command:
cd locust
locust -f tasks.py \
--headless \
--host http://${EXTERNAL_IP}:8501
Task 11. Monitoring the load test
You will monitor the behavior of the TensorFlow Serving deployment and the GKE node pool using GKE Dashboards.
- To monitor the TensorFlow Serving deployment open a new tab in the same browser window in which you run Cloud Shell and navigate to the following URL:
https://console.cloud.google.com/kubernetes/deployment/us-east1-b/cluster-1/default/image-classifier/overview
The Image-Classifier page opens.
Two lines on the CPU line chart in the upper left part of the page show the requested and the currently utilized CPUs. As the load increases, the number of requested CPUs will increase in steps of 3 as new replicas are started. The number of used CPUs will be a ragged curve representing the current utilization averaged across all allocated CPU resources. The CPU line chart shows data delayed by about 60 seconds.
Note that you need to click on the Refresh button on the top menu to see the updates.
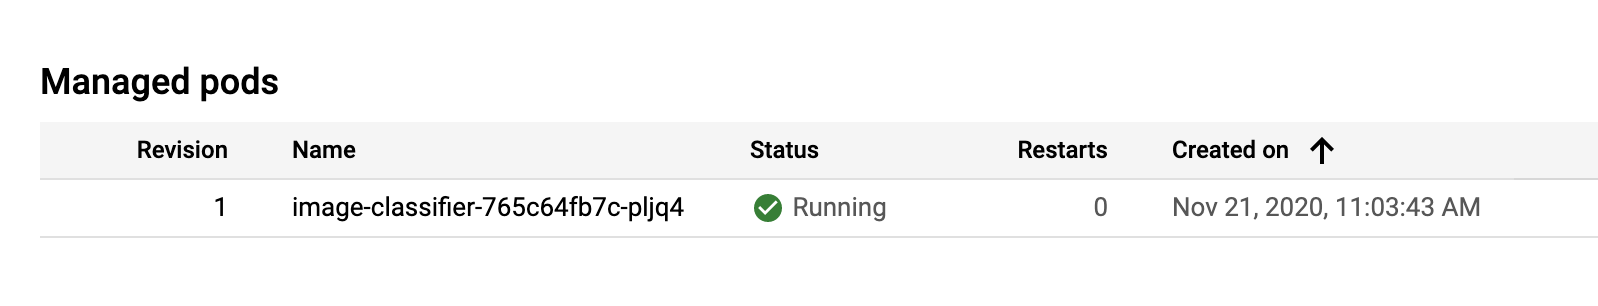
The Managed pods widget shows the current number of replicas. At the beginning of the test it will show one replica:
Soon you will see two pods. One running and one in the unschedulable state:
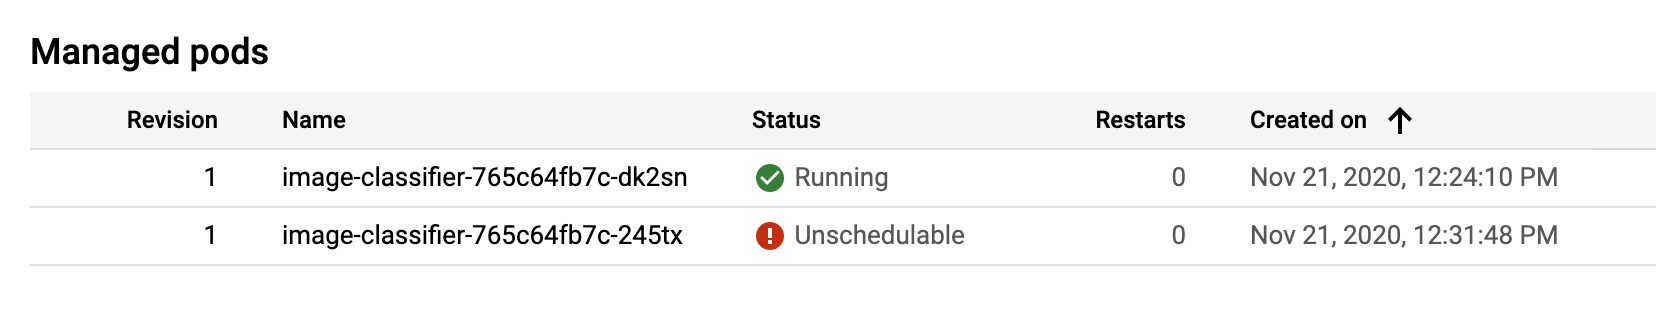
Recall that only one TensorFlow Serving pod can fit on a single cluster node. The pod stays in the unschedulable state while GKE autoscaler creates a new node.
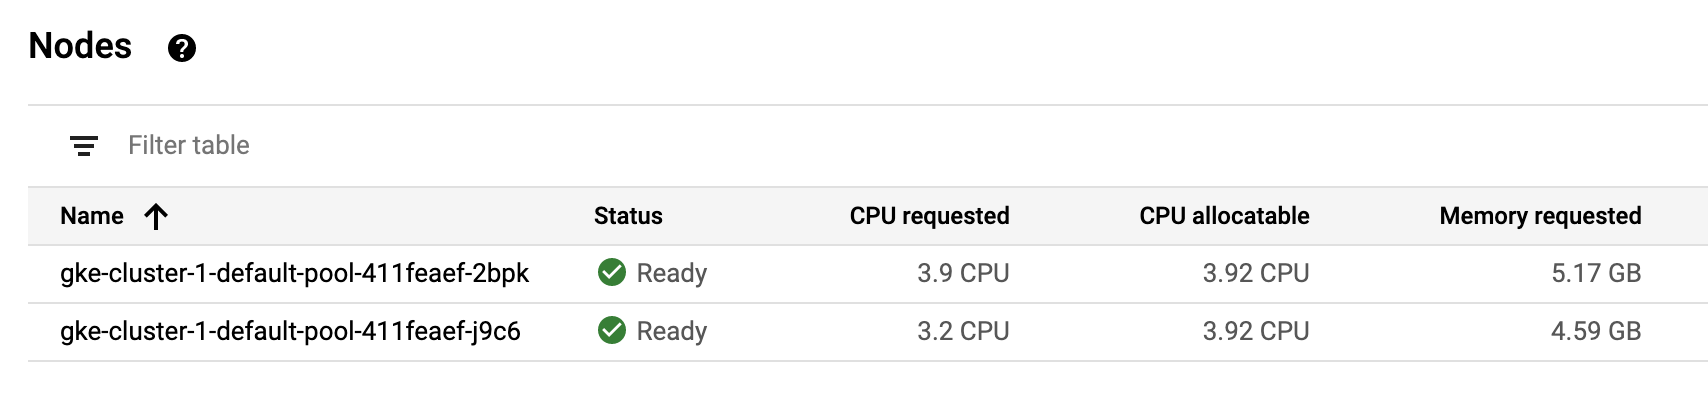
- After both pods are in the running state you can verify that a new node has been created in the default node pool by opening the node pool dashboard in another browser tab.
https://console.cloud.google.com/kubernetes/nodepool/us-east1-b/cluster-1/default-pool
At some point the fourth replica is scheduled:
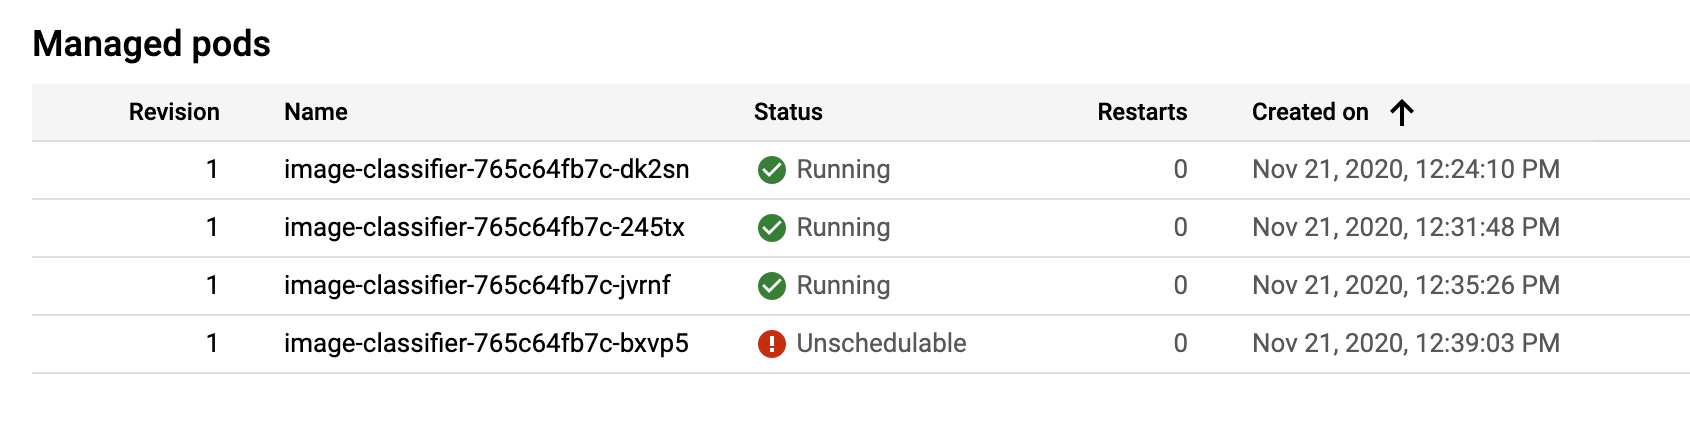
The fourth replica will not transition to the running state as the GKE autoscaler was configured to create a maximum of three nodes.
After about 15 minutes, the script stops sending requests. As a result, the number of TensorFlow Serving replicas will also go down.
By default, the HPA will wait for 5 minutes before triggering the downscaling operation so you will need to wait at least 5 minutes to observe this behavior.
As the number of replicas goes down, the GKE autoscaler starts removing nodes from the default node pool.
For the purposes of scaling down, the autoscaler calculates the group's recommended target size based on peak load over the last 10 minutes. These last 10 minutes are referred to as the stabilization period. So be patient. It will take over 15 minutes after the script stopped generating predictions to see the changes in the size of the default node pool.
Click Check my progress to verify the objective.
Start and monitor load test
Check my progress
Task 12. Stopping the load test
- To stop the load test, kill the Locust process by issuing the Ctrl+C command in the Cloud Shell terminal.
Solution of Lab
curl -LO raw.githubusercontent.com/Techcps/Google-Cloud-Skills-Boost/master/Autoscaling%20TensorFlow%20Model%20Deployments%20with%20TF%20Serving%20and%20Kubernetes/techcps777.sh
sudo chmod +x techcps777.sh
./techcps777.sh
Subscribe to my newsletter
Read articles from David Nguyen directly inside your inbox. Subscribe to the newsletter, and don't miss out.
Written by
David Nguyen
David Nguyen
A passionate full-stack developer from @ePlus.DEV