Cutting Spark Costs by 75% and Job Time by 90% — Here's How
 Aaron Jevil Nazareth
Hello there, fellow coders and web enthusiasts!
Today, I want to share a challenge I was recently assigned, one that had me scratching my head for quite a while! Finding the right solution wasn't as straightforward as I'd hoped, but I'm excited to walk you through the journey of figuring it out. 🚀
Picture this: you submit a Spark job thinking it'll wrap up in an hour, grab some coffee, come back... and it's still running. Eight hours later, it's STILL running, your cloud bill is through the roof, and you're questioning every life choice that led to this moment.

Quick PySpark Context 🐍
Before we dive in, let's set the stage! We're working with PySpark - Apache Spark's Python API that lets you process massive datasets across distributed clusters. If you're new to PySpark, think of it as pandas on steroids for Big Data! The key concepts you'll see throughout this article are DataFrames (distributed datasets), transformations (lazy operations), and actions (operations that trigger computation). Check out the official PySpark documentation if you want to dive deeper into the fundamentals!
The Original Setup
We were building a company matcher using Jaccard distance. Pretty standard ML pipeline stuff. Jaccard distance measures how different two sets are! But here's the cool part - we're using it to compare company names, not keywords. Think about it: our model might extract "the apple" from some text, while our org database has "Apple Inc." We need to match these variations intelligently!
Below the formula to calculate Jaccard Distance
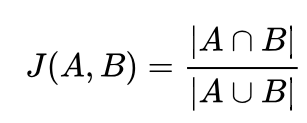
Below is a visual representation of how it happens in our example have n-gram 4 giving 0.33 jaccard dist.

Jaccard dist varies between 0 to 1, 0 meaning exact match and 1 meaning nothing in common.
Now you may ask why Jaccard dist and not simple substring matching using fuzzy string matching?
The challenge is speed - comparing every extracted company name against millions(YES MILLONS) of official company names is computationally expensive. That's where our clever ML pipeline comes in to make this lightning fast! (or soo we thought😩)
pipeline = Pipeline(stages=[
    SQLTransformer(statement=f"SELECT *, lower({match_column}) AS lower FROM __THIS__"),
    Tokenizer(inputCol="lower", outputCol="token"),
    StopWordsRemover(inputCol="token", outputCol="stop"),
    SQLTransformer(statement="SELECT *, concat_ws(' ', stop) AS concat FROM __THIS__"),
    RegexTokenizer(pattern="", inputCol="concat", outputCol="char", minTokenLength=1),
    NGram(n=4, inputCol="char", outputCol="ngram"),
    HashingTF(inputCol="ngram", outputCol="vector"),
    MinHashLSH(inputCol="vector", outputCol="lsh", numHashTables=3)
])

model = pipeline.fit(data)
Let me walk you through what each stage does:
Step 1: SQLTransformer - Converts company names to lowercase. Simple but crucial for consistent matching!
Step 2: Tokenizer - Splits text into individual words. "Apple Inc" becomes ["Apple", "Inc"]
Step 3: StopWordsRemover - Removes common words like "and", "the", "inc" that don't help with similarity
Step 4: SQLTransformer - Rejoins the cleaned words back into a single string
Step 5: RegexTokenizer - Breaks the text into individual characters for n-gram generation
Step 6: NGram - Creates 4-character sequences. "Apple" becomes ["Appl", "pple"]. This helps catch typos and variations! (You need to experiment with this value for your use case. If you keep it too low, the time will increase exponentially. If it's too high, you might miss matches.)
Step 7: HashingTF - Converts n-grams into numerical vectors that algorithms can work with
Step 8: MinHashLSH - The magic sauce! Creates hash signatures for fast similarity comparisons
We have two Dataframes:
News data: Contains news articles with fields like title, organizations, and keywords.
Organization dataset: Includes fields such as organizations and keywords.
we compare both of them as below
news_data_tokenized = model.transform(news_data)
organization_data_tokenized = model.transform(organization_data)

# removing names lesser than size 4, ngrams was set to 4 above
news_data_tokenized = news_data_tokenized.filter(size(col("ngram")) > 0)
organization_data_tokenized = organization_data_tokenized.filter(size(col("ngram")) > 0)

# takes too long here😭, 0.5 is jaccard threshold get matches having score below 0.5 only
result: DataFrame = model.stages[-1].approxSimilarityJoin(
     tokenized_org_data, tokenized_companies, 0.5, "jaccardDist"
 )
Here are the run times we observed:
8,000 articles → 1 hour
25,000 articles → 4 hours
35,000 articles → 8 hours
At this point We weren’t scaling the system — the costs were scaling us. We were reaching $4000 a month.
The Game-Changer: Strategic Partitioning 🎯
The breakthrough came when we realized our data distribution was absolutely terrible.
We had two datasets:
News Data (news_data_tokenized) — 35,000 articles (becomes 3,50,000)
We open/explode the array in organizations in individual rows making the news data even bigger ~3,50,000
| id | title | organizations | keywords |
| 1 | "Apple launches new iPhone" | [Apple, Google, ….] | apple, iphone, launch |
| 2 | "Tesla invests in lithium mining" | [Tesla, Microsoft, …] | tesla, mining, lithium |
| 3 | "Infosys acquires consulting firm" | [Infosys, Microsoft, …] | infosys, acquisition, firm |
| ... | ... | ... | ... |
Organizations (org_df) — 3,000,000+ records
| id | organizations | keywords |
| 101 | Apple | apple, tech, mobile |
| 102 | Tesla | tesla, automotive, energy |
| 103 | Infosys | infosys, consulting, software |
| ... | ... | ... |
The Reality: Skew Hell
You’d expect a nice, even join. But what we got looked more like this:
Before Join Distribution:
| Partition | Records |
| P1 | 100 |
| P2 | 9,000 |
| P3 | 50 |
| P4 | 12,000 |
| P5 | 60 |
| … | … |
Some partitions had very few rows, while others had so many rows they could overload both a coffee machine and a Spark executor.
Why?
Because popular company names like "Apple", "Google", "Amazon" were everywhere — in thousands of articles, matched against tens of thousands of org entries with similar keywords.
In contrast, "Acme Solar Holdings West Pvt Ltd" showed up in one article and had one match.
We weren’t just joining two datasets —
we were creating a data pileup where a handful of companies accounted for 90% of the work.
It was like Spark said:
“Sure, I’ll distribute the work… to one unlucky executor.”
How did we fix it?
Two simple lines changed everything:
tokenized_org_data = tokenized_org_data.repartition(500, "organization")
tokenized_companies = broadcast(tokenized_companies).repartition(500, "organization")

# now this is fast
result: DataFrame = model.stages[-1].approxSimilarityJoin(
     tokenized_org_data, tokenized_companies, 0.5, "jaccardDist"
 )
Smart Partitioning Strategy:
Repartitioning by "organization" ensures related data lives on the same nodes
500 partitions gave us the sweet spot for parallelization without over-partitioning (you might need to experiment with different partition values to match your use case)
Broadcasting the smaller dataset eliminates expensive shuffles during joins (send the news dataframe to all the executors)
The key insight? Spark's default partitioning often doesn't align with your actual data access patterns. Take control!
The Lineage Graph Problem (Or Why Jobs Refuse to Start or take too long!) 😤
Problem 1: Huge Lineage Graphs 📊 Spark creates a "lineage graph," which is like a list of all the steps needed to get your final result. As your process gets more complicated, this list can become enormous. It can get so big that Spark's optimizer can't figure out the best way to run it! Your job doesn't even start; it just uses up cluster resources while trying to plan an impossible task.
Problem 2: Costly Recomputation 💸 Here's the problem: every time Spark needs a result it hasn't saved, it recalculates the entire lineage from the beginning! If you have a DataFrame used in 5 different places, without caching, Spark will redo that expensive operation 5 times. We were paying for the same calculation repeatedly!
Pro tip: To find out if recomputation is happening, you can check the SQL / DataFrame section on Spark UI. Look for queries that have almost the same run time and execution plan.
This recomputation problem gets much worse in complex setups. One DataFrame might rely on another, which relies on another, and so on. Before you know it, a simple action causes a chain of recomputations that can take hours!
The Magic of Checkpointing and Caching ✨
Here's where things get really interesting. Spark's lazy evaluation is usually awesome, but it can bite you when query plans get complex. Our solution was strategic checkpointing and caching:
# Process and checkpoint at strategic points
data, unresolved_companies, category_list = resolve_companies_for_news()
data = data.checkpoint(eager=True)
# Continue processing...
When we return data, unresolved_companies, category_list from the Python function, it will recompute the three DataFrames three times due to the checkpoint added to split the query execution plan for each, causing long run times.
What fixed it?
# Break the lineage to prevent recomputation
unresolved_companies = unresolved_companies.cache()
category_list = category_list.cache()
data = data.checkpoint(eager=True)
unresolved_companies = unresolved_companies.checkpoint(eager=True)
category_list = category_list.checkpoint(eager=True)
This combination of persist(), cache(), and checkpoint() solved multiple problems:
Prevented recomputation of expensive operations
Broke overly complex lineage graphs
Gave us explicit control over when computations happened
The Numbers Don't Lie
Before optimization:
8+ hour runtime
Massive cloud costs
Developer frustration through the roof
After optimization:
40-minute runtime
75% cost reduction ($4K → $1K)
Happy developers building cool stuff instead of waiting around

Key Lessons Learned
Partitioning Strategy Matters: Don't let Spark decide how to split your data. Plan based on how you access it and partition it accordingly.
Break Those Lineages: Complicated lineage graphs can slow things down before jobs even begin(you can view this in SQL queries section in sparkUI). Use strategic checkpointing to fix this.
Profile First, Optimize Second: Bottlenecks aren't always where you expect. Measure everything first.
Small Changes, Big Impact: Sometimes, just two lines of code can save hours of runtime and reduce cloud costs significantly.
The takeaway? Spark optimization isn't about fancy tricks—it's about understanding your data and how Spark works with it. Once you get that right, everything falls into place.
Now go and optimize those jobs! Your future self (and your cloud bill) will be grateful.
Pro Tip: Learn how to use SparkUI It provides lots of different information about the job. Use it wisely….
Sources I referred to while debugging:
Subscribe to my newsletter
Read articles from Aaron Jevil Nazareth directly inside your inbox. Subscribe to the newsletter, and don't miss out.
Written by
Aaron Jevil Nazareth
Aaron Jevil Nazareth
I am developer from India, Developed multiple websites using nextjs and typescript. Currently exploring the machine learning field . Would love to learn as much as possible, Also take up some freelancing gigs occasionally.