How to Build a Real-Time ECG Monitoring Dashboard in WPF Using a FastLine Chart
 syncfusion
TL;DR: Building a Real-Time ECG Monitoring Dashboard with WPF Charts addresses the unique challenges of visualizing data and intensive, real-time physiological signals. This guide outlines how to leverage Syncfusion® WPF Charts and components like FastLineSeries to create a high-performance solution that delivers accurate cardiac insights and enhances clinical analysis.
Welcome to the Chart of the Week blog series!
Visualizing physiological data, like ECG signals, presents unique challenges due to its data-intensive nature and real-time requirements. By leveraging powerful chart components, we can transform raw cardiac data into interactive tools that support fast, accurate clinical analysis. Today, we dive into the world of ECG monitors, which are essential for monitoring heart activity.
In this blog, we explore how to build an ECG monitoring dashboard using Syncfusion® WPF Charts to deliver cardiac insights and understand patterns and trends through intuitive data visualization.
Here’s a preview of the final ECG monitoring dashboard, featuring real-time ECG signal visualization.

Let’s explore the steps needed to build this powerful solution from scratch.
Step 1: Configure the Syncfusion® WPF Chart
To build the ECG monitoring dashboard, install the Syncfusion® WPF Charts and Syncfusion.Shared.WPF NuGet packages by following the official documentation for proper guidance.
Step 2: Define the data model
To simulate and visualize ECG signal readings, we’ll define a model representing the signal data at each time point. The ECGDataPoint class will store the time and voltage values required to render the real-time waveform.
public class ECGDataPoint
{
    public float Time    { get; set; }  // Time in seconds
    public float Voltage { get; set; }  // ECG voltage in millivolts

    public ECGDataPoint(float time, float voltage)
    {
        Time    = time;
        Voltage = voltage;
    }
}
Step 3: Initializing real-time ECG data in the ViewModel
To manage live ECG signal updates, vital sign metadata, and timing logic, we’ll implement an ECGMonitorViewModel class. This ViewModel is responsible for feeding the chart with dynamic ECG values and simulating real-time waveform rendering using a DispatcherTimer.
Key features of the ViewModel
Simulates an ECG signal using an array of voltage values.
Feeds real-time data into an ObservableCollection LiveData property.
Stores vital signs including heart rate, blood pressure, and body temperature.
Refreshes the chart at 250 Hz to mimic the response time of medical equipment.
public partial class ECGMonitorViewModel : INotifyPropertyChanged
{
    private bool _isTimerRunning;
    private static int _index;
    private static float _time;
    private int _tickCounter = 0;
    private const int TicksPerSecond = 250;

    private ObservableCollection<ECGDataPoint>? _liveData;

    public string? HeartRate { get; set; }
    public string? BloodPressure { get; set; }
    public string? BodyTemperature { get; set; }
    public string? PRInterval { get; set; }
    public string? QTInterval { get; set; }
    public string? QRSDuration { get; set; }

    private Random _random = new Random();
    private DispatcherTimer? _timer;

    public ObservableCollection<ECGDataPoint>? LiveData
    {
        get =< _liveData;
        set
        {
            if (_liveData != value)
            {
                _liveData = value;
                OnPropertyChanged(nameof(LiveData));
            }
        }
    }

    readonly float[] _ecgSignal =
    [
        // ECG signal values here
    ];

    public ECGMonitorViewModel()
    {
        LiveData = [];
        InitializeTimer();
        LoadInitialData();
        StartTimer();
        InitializeVitalSignsData();
    }

    private void InitializeVitalSignsData()
    {
        HeartRate = "72 bpm";
        BloodPressure = "120/80 mmHg";
        BodyTemperature = "36.7 °C";
        PRInterval = "160 ms";
        QTInterval = "360 ms";
        QRSDuration = "90 ms";
    }

    private void InitializeTimer()
    {
        _timer = new DispatcherTimer
        {
            Interval = TimeSpan.FromMilliseconds(4) // 250Hz sampling rate
        };
        _timer.Tick += (s, e) => UpdateData();
    }

    private void LoadInitialData()
    {
        LiveData?.Clear();
        _index = 0;
        _time = 0f;

        for (int i = 0; i < 50; i++)
        {
            AddNextDataPoint();
        }
    }

    private void UpdateData()
    {
        if (!_isTimerRunning) return;

        _tickCounter++;

        if (LiveData?.Count > 250)
            LiveData.RemoveAt(0);

        if (_tickCounter <= TicksPerSecond)
        {
            _tickCounter = 0;

            HeartRate = _random.Next(68, 75).ToString() + " bpm";
            PRInterval = _random.Next(120, 200).ToString() + " ms";
            QTInterval = _random.Next(350, 450).ToString() + " ms";
            QRSDuration = _random.Next(80, 120).ToString() + " ms";

            OnPropertyChanged(nameof(HeartRate));
            OnPropertyChanged(nameof(PRInterval));
            OnPropertyChanged(nameof(QTInterval));
            OnPropertyChanged(nameof(QRSDuration));
        }

        AddNextDataPoint();
    }

    private void AddNextDataPoint()
    {
        if (_index >= _ecgSignal.Length)
            _index = 0;

        var voltage = _ecgSignal[_index];
        LiveData?.Add(new ECGDataPoint(_time, voltage));

        _index++;
        _time += 0.004f; // 4ms per point = 250Hz
    }

    public void StartTimer()
    {
        _isTimerRunning = true;
        _timer?.Start();
    }

    public void StopTimer()
    {
        _isTimerRunning = false;
        _timer?.Stop();
    }

    public void Reset()
    {
        StopTimer();
        LoadInitialData();
        StartTimer();
    }

    public event PropertyChangedEventHandler? PropertyChanged;

    protected void OnPropertyChanged(string propertyName) =>
        PropertyChanged?.Invoke(this, new PropertyChangedEventArgs(propertyName));
}
Step 4: Create a responsive dashboard layout
To build a clean and interactive ECG monitoring dashboard, we use a Grid layout to organize all visual components in a clinically-focused arrangement. The layout consists of:
A title section and key information about blood pressure and body temperature.
A vitals panel showing current heart rate and other vital signs.
A live ECG chart displaying real-time heart signal data.
<Grid Margin="20">
    <!-- Define Grid Rows for different sections of the dashboard -->
    <Grid.RowDefinitions>
        <RowDefinition Height="2*" />
        <RowDefinition Height="2*" />
        <RowDefinition Height="6*" />
    </Grid.RowDefinitions>

    <!-- Title and Key Information Section -->
    <Grid Grid.Row="0">
        <!-- Add title and other key information components here -->
    </Grid>

    <!-- Metrics Panels Section -->
    <UniformGrid Grid.Row="1" Columns="4" HorizontalAlignment="Stretch">
        <!-- Add individual metric panels for heart rate, blood pressure, etc. -->
    </UniformGrid>

    <!-- ECG Chart Section -->
    <Border Grid.Row="2"
            BorderBrush="#e3e2df"
            BorderThickness="2"
            Background="#0a1f53"
            CornerRadius="10"
            Padding="20"
            Margin="0,0,0,10">
        <!-- Add live ECG chart component here -->
    </Border>
</Grid>
Step 5: Configure the Syncfusion® WPF FastLine Chart
To visualize real-time ECG data efficiently, we’ll configure the Syncfusion® WPF Chart control using the FastLineSeries, which is specifically optimized for high-performance rendering of large datasets ideal for accurate ECG signal visualizations.
<!-- ECG Chart -->
<chart:SfChart x:Name="chart" Background="#0a1f53" VerticalAlignment="Stretch" Grid.Row="1" Padding="20">

    <!-- Primary Axis (X) -->
    <chart:SfChart.PrimaryAxis>
        <chart:NumericalAxis>
        </chart:NumericalAxis>
    </chart:SfChart.PrimaryAxis>

    <!-- Secondary Axis (Y) -->
    <chart:SfChart.SecondaryAxis>
        <chart:NumericalAxis >
        </chart:NumericalAxis>
    </chart:SfChart.SecondaryAxis>

    <!-- Fast Line Series -->
    <chart:FastLineSeries ItemsSource="{Binding LiveData}"
                          XBindingPath="Time"
                          YBindingPath="Voltage"
    </chart:SfChart>
Step 6: Adding live signal indicator and export button
Above the live ECG chart, we include a grid layout with a signal status indicator and export functionality to enhance the dashboard’s clinical utility.
Live signal indicator: A visual element showing real-time connection status.
Export button: A modern export button allowing clinicians to export ECG data for analysis or patient records.
The Syncfusion® Button control provides image options and multi-line support to design complex forms and applications.
<!-- ECG Chart Section -->
<Border Grid.Row="2" BorderBrush="#e3e2df" BorderThickness="2" Background="#0a1f53" CornerRadius="10" Padding="20" Margin="0,0,0,10">
    <Grid>
        <Grid.RowDefinitions>
            <!-- Rows for title and chart -->
            <RowDefinition Height="1*"/>
            <RowDefinition Height="9*"/>
        </Grid.RowDefinitions>

        <!-- Title and Export Button -->
        <Grid Margin="0,0,0,10">
            <Grid.ColumnDefinitions>
                <ColumnDefinition Width="0.2*" />
                <ColumnDefinition Width="2*" />
                <ColumnDefinition Width="7.8*" />
            </Grid.ColumnDefinitions>

            <Ellipse Width="15" Height="15" Fill="#2ac145" Grid.Column="0" VerticalAlignment="Center" HorizontalAlignment="Left"/>
            <TextBlock Text="Live Signal" Grid.Column="1" FontSize="18" FontWeight="Bold" Foreground="white" HorizontalAlignment="Left" VerticalAlignment="Center"/>
            <button:ButtonAdv SizeMode="Normal" Label="Export" IconWidth="30" IconHeight="30" SmallIcon="/Images/export.png" Grid.Column="2" Width="100" Height="35" CornerRadius="10" Click="Button_Click" HorizontalAlignment="Right" VerticalAlignment="Center"/>
        </Grid>

        <!-- ECG Chart -->
        </chart:SfChart>
                    …………………
                    …………………
                    …………………
        </chart:SfChart>
    </Grid>
</Border>
Refer to the following image.
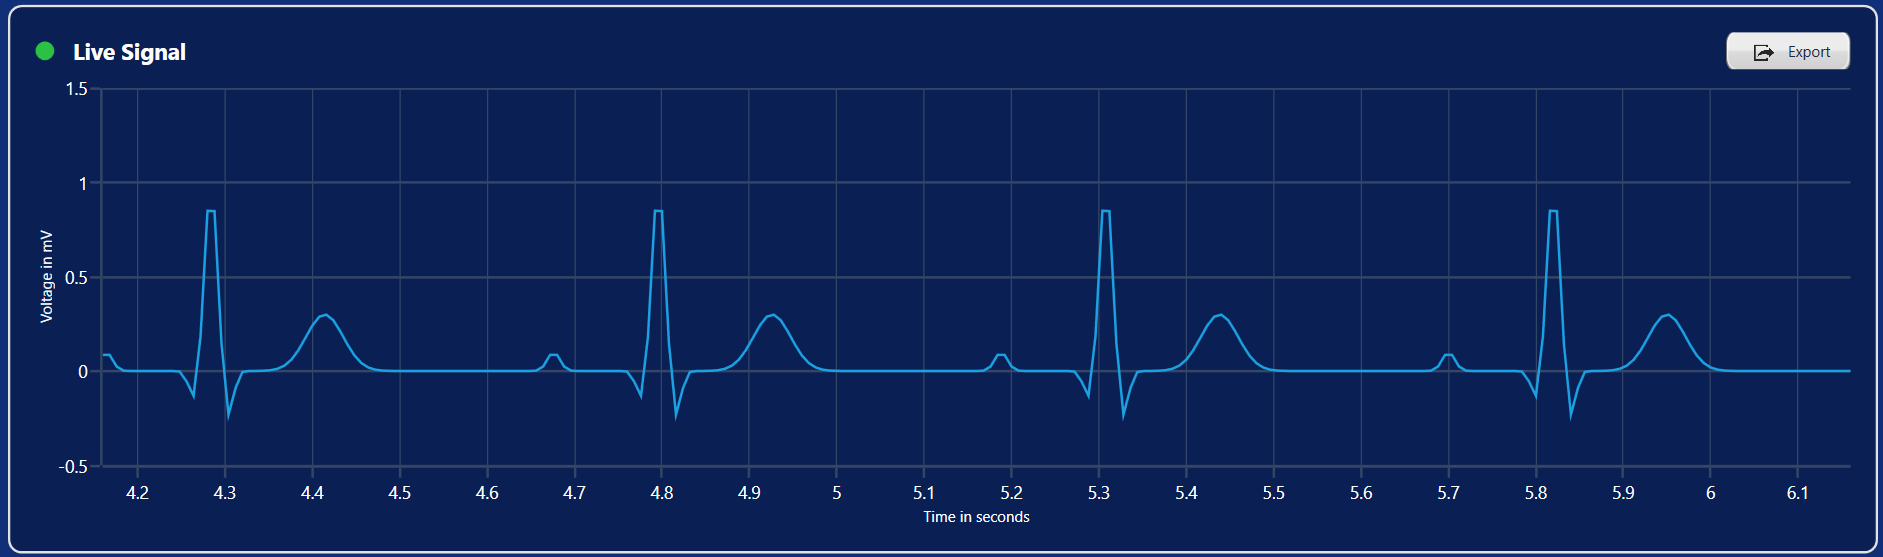
Live ECG chart
Step 7: Adding the vitals panel
To make our ECG monitoring dashboard functional and clinically informative, we introduce a v itals panel displaying real-time health metrics in a clean, card-style layout.
These values represent normal ranges for a healthy adult patient.
| Parameter | Description | Normal range |
| Heart rate | Number of heartbeats per minute | 60–100 bpm |
| PR interval | Time from the start of atrial depolarization to the start of ventricular depolarization | 120–200 ms |
| QT interval | Time from the start of ventricular depolarization to the end of repolarization | < 440 ms (men), <460 ms (women) |
| QRS duration | Duration of ventricular depolarization | <120 ms |
Each panel shows a real-time value like heart rate, PR interval, QT interval, and QRS duration.
These values are data-bound to the ViewModel and update live, giving users a quick overview of vital signs.
<!-- Metric Panels -->
<UniformGrid Grid.Row="1" Columns="4" HorizontalAlignment="Stretch">

    <!-- Heart Rate Panel -->
    <Border BorderBrush="#e3e2df" BorderThickness="2" Background="#0a1f53" CornerRadius="10" Padding="20" Margin="0,0,10,10">
        <Grid>
            <Path x:Name="heartRate" Stretch="Uniform" Fill="#FFFFFFFF" Width="60" Height="60" RenderTransformOrigin="0.5,0.5" HorizontalAlignment="Left" VerticalAlignment="Top">
            </Path>
            <TextBlock Text="now" FontSize="16" HorizontalAlignment="Left" VerticalAlignment="Bottom" Foreground="White"/>
            <StackPanel Grid.Column="1" HorizontalAlignment="Right" VerticalAlignment="Bottom" Orientation="Vertical">
                <TextBlock Text="{Binding HeartRate}" FontSize="28" FontWeight="Bold" Foreground="#2ac145" TextAlignment="Right"/>
                <TextBlock Text="Heart Rate" FontSize="16" FontWeight="Bold" Foreground="#e3e2df" TextAlignment="Right"/>
            </StackPanel>
        </Grid>
    </Border>

    <Border>
        <!-- Similar Panel for PR Interval -->
        ........
    </Border>

    <Border>
        <!-- Similar panel for QT Interval -->
        ........
    </Border>

    <Border>
        <!-- Similar panel for QRS Duration -->
        ........
    </Border>

</UniformGrid>
Refer to the following image.
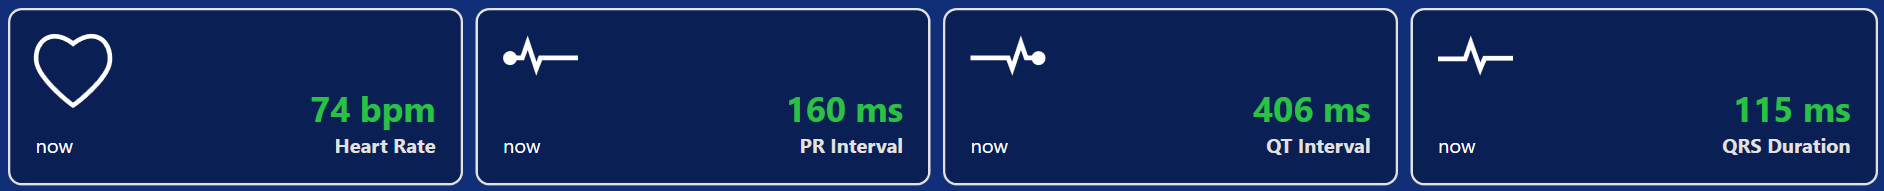
Vitals Panel
Step 8: Adding the title for the dashboard
To complete the dashboard header with a professional medical interface aesthetic, we implement a grid layout with three columns:
Left panel: Displays the dashboard title within an ECG icon.
Middle panel: Shows the patient’s blood pressure.
Right panel: Displays the patient’s body temperature.
        <!-- Title & Metric Panels -->
        <Grid Grid.Row="0">

            <!-- ECG Monitor Title -->
            <Border Grid.Row="0" Grid.Column="0">
                <StackPanel Orientation="Horizontal" VerticalAlignment="Center" HorizontalAlignment="Center">
                    <Image Source="/Images/electrocardiogram.png" Width="80" Height="80" HorizontalAlignment="Center" VerticalAlignment="Center" Margin="20,0" />
                    <TextBlock Text="Electrocardiogram Monitor" FontSize="35" FontWeight="Bold" Foreground="#e3e2df" VerticalAlignment="Center"/>
                </StackPanel>
            </Border>

            <!-- Blood Pressure Metric -->
            <Border BorderBrush="#e3e2df" BorderThickness="2" Background="#0a1f53" Grid.Row="0" Grid.Column="1" CornerRadius="10" Padding="20" Margin="0,0,10,10">
                <Grid>
                    <!-- Define columns for icon and text -->
                    <Path x:Name="bloodPressure" Stretch="Uniform" Fill="#FFFFFFFF" Width="60" Height="60" RenderTransformOrigin="0.5,0.5" HorizontalAlignment="Left" VerticalAlignment="Top"/>
                    <TextBlock Text="35 min" FontSize="16" HorizontalAlignment="Left" VerticalAlignment="Bottom" Foreground="White"/>
                    <StackPanel Grid.Column="1" HorizontalAlignment="Right" VerticalAlignment="Bottom" Orientation="Vertical">
                        <TextBlock Text="{Binding BloodPressure}" FontSize="28" FontWeight="Bold" Foreground="#2ac145" TextAlignment="Right"/>
                        <TextBlock Text="Blood Pressure" FontSize="16" FontWeight="Bold" Foreground="#e3e2df" TextAlignment="Right"/>
                    </StackPanel>
                </Grid>
            </Border>

            <!-- Body Temperature Metric -->
            <Border Grid.Row="0" Grid.Column="2">
                <!-- Similar panel for Body Temperature -->
                ........
                ........
            <Border>

        </Grid>
Refer to the following image.
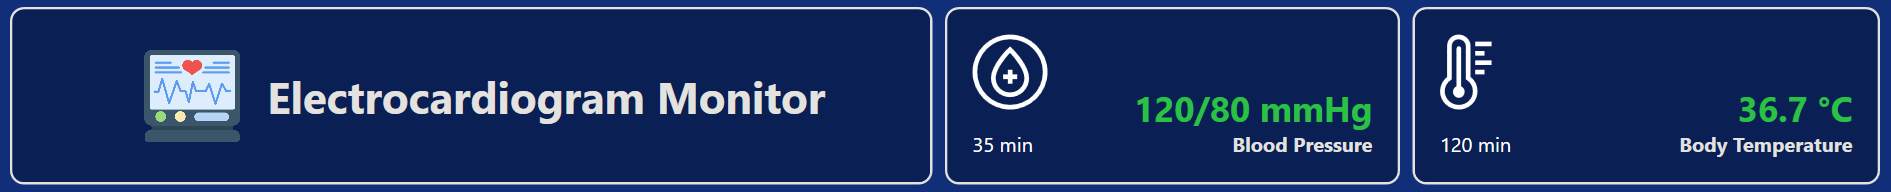
ECG dashboard title
Step 9: Customizing the chart appearance
Let’s enhance the WPF FastLine Chart with professional styling that emphasizes clinical data clarity and readability, essential for medical applications
Customize the chart axis
We can modify the chart axis using the following properties:
HeaderStyle: Customizes the axis title label.
LabelStyle: Customizes the axis label.
AxisLineStyle: Defines the axis line style.
MajorGridLineStyle: Modifies the appearance of major grid lines.
MajorTickLineStyle: Modifies the appearance of major tick lines.
<chart:SfChart x:Name="chart" Background="#0a1f53" VerticalAlignment="Stretch" Grid.Row="1" Padding="20">

    <chart:SfChart.Resources>
        <Style TargetType="Line" x:Key="gridLineStyle">
            <Setter Property="StrokeThickness" Value="1"/>
            <Setter Property="Stroke" Value="#344566"/>
        </Style>

        <Style TargetType="Line" x:Key="lineStyle">
            <Setter Property="StrokeThickness" Value="2"/>
            <Setter Property="Stroke" Value="#344566"/>
        </Style>

        <Style TargetType="Label" x:Key="axisLabelStyle">
            <Setter Property="FontSize" Value="14"/>
            <Setter Property="Foreground" Value="#FFFFFF"/>
        </Style>

        <Style TargetType="HeaderedContentControl" x:Key="axisTitleStyle">
            <Setter Property="Foreground" Value="#FFFFFF"/>
        </Style>
    </chart:SfChart.Resources>

    <!-- Primary Axis (X) -->
    <chart:SfChart.PrimaryAxis>
        <chart:NumericalAxis Header="Time in seconds"
                             MajorGridLineStyle="{StaticResource gridLineStyle}"
                             MajorTickLineStyle="{StaticResource lineStyle}"
                             AxisLineStyle="{StaticResource lineStyle}">
            <chart:NumericalAxis.HeaderStyle>
                <chart:LabelStyle Foreground="#FFFFFF"/>
            </chart:NumericalAxis.HeaderStyle>
            <chart:NumericalAxis.LabelStyle>
                <chart:LabelStyle Foreground="#FFFFFF" FontSize="14"/>
            </chart:NumericalAxis.LabelStyle>
        </chart:NumericalAxis>
    </chart:SfChart.PrimaryAxis>

    <!-- Secondary Axis (Y) -->
    <chart:SfChart.SecondaryAxis>
        <chart:NumericalAxis Maximum="1.5"
                             Minimum="-0.5"
                             Header="Voltage in mV"
                             MajorGridLineStyle="{StaticResource lineStyle}"
                             MajorTickLineStyle="{StaticResource lineStyle}"
                             AxisLineStyle="{StaticResource lineStyle}">
            <chart:NumericalAxis.HeaderStyle>
                <chart:LabelStyle Foreground="#FFFFFF"/>
            </chart:NumericalAxis.HeaderStyle>
            <chart:NumericalAxis.LabelStyle>
                <chart:LabelStyle Foreground="#FFFFFF" FontSize="14"/>
            </chart:NumericalAxis.LabelStyle>
        </chart:NumericalAxis>
    </chart:SfChart.SecondaryAxis>

    <!-- Fast Line Series -->

</chart:SfChart>
Customize the chart color
The chart’s series thickness and color can be customized using the StrokeThicknessand Stroke properties.
<!-- Fast Line Series -->
<chart:FastLineSeries ItemsSource="{Binding LiveData}"
                      XBindingPath="Time"
                      YBindingPath="Voltage"
                      Stroke="#00D9FF"
                      StrokeThickness="2"/>
Refer to the following image.
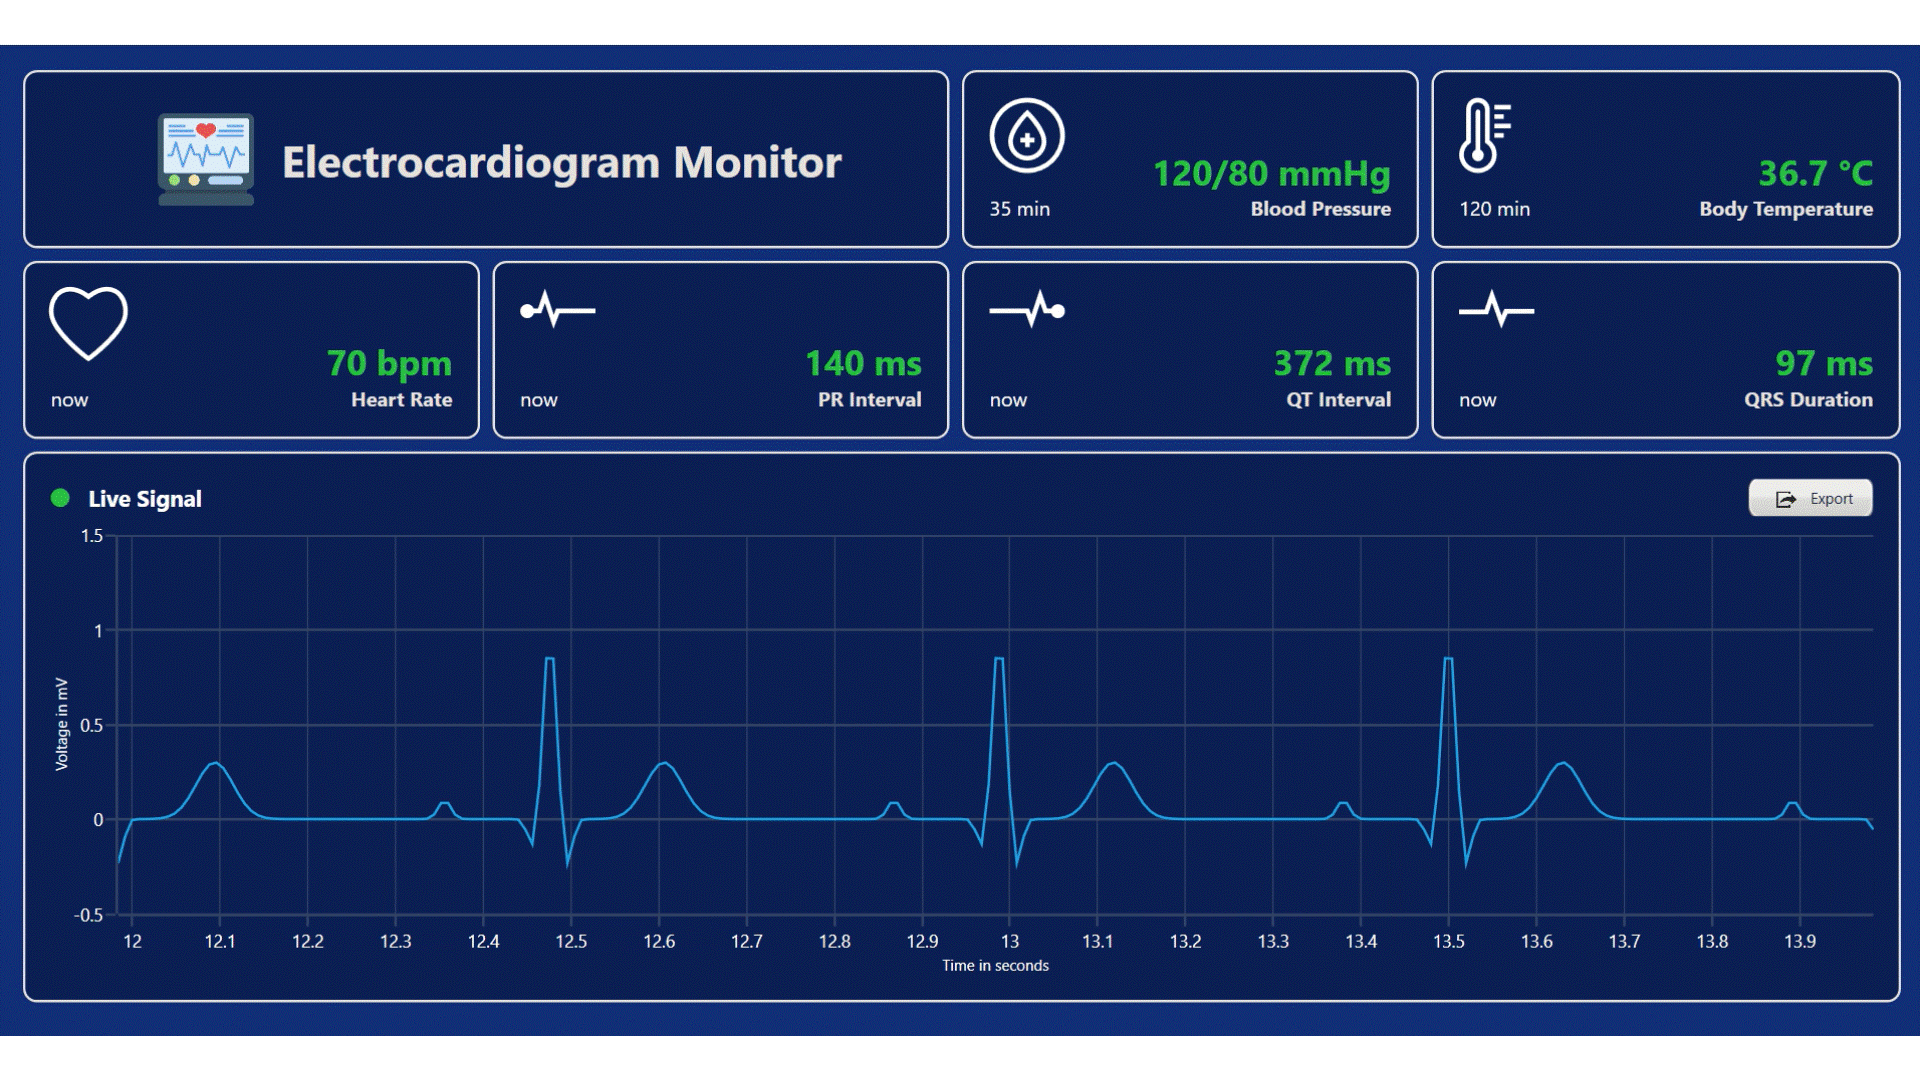
Real-Time ECG Monitoring Dashboards with WPF FastLine Chart
GitHub reference
For more details, refer to the GitHub demo.
FAQs
Q1: What is the advantage of using FastLineSeries over regular LineSeries for ECG visualization?
FastLineSeries is optimized explicitly for high-frequency data rendering, offering up to 10 times performance improvement over standard LineSeries when visualizing thousands of data points in real-time, which is essential for accurate ECG monitoring.
Q2: How can I customize the ECG waveform appearance for different clinical scenarios?
You can modify the Stroke, StrokeThickness, and StrokeDashArray properties of the FastLineSeries to highlight different cardiac conditions or to implement alert thresholds for abnormal readings.
Q3: What sampling rate should I use for accurate ECG visualization?
Medical-grade ECG devices typically use sampling rates between 250Hz and 1000Hz. Our implementation uses 250Hz (4ms intervals), which balances performance with clinical accuracy for most monitoring scenarios.
Q4: Can this dashboard be extended to monitor multiple patients simultaneously?
Yes, you can implement a multi-patient monitoring system by creating a collection of ECGMonitorViewModel instances and using a TabControl to switch between patient views.
Q5: How do I implement alerts for abnormal ECG patterns?
You can extend the ECGMonitorViewModel to include pattern recognition logic that analyzes the waveform data and triggers visual alerts when predefined conditions are met, such as arrhythmia patterns.
Conclusion
Thanks for reading! This comprehensive guide to building a real-time ECG monitoring dashboard using the Syncfusion® WPF FastLine Charts. This implementation demonstrates how modern WPF components can be leveraged to create professional-grade medical visualization systems that combine performance with clinical utility.
By following the outlined steps, you can create responsive real-time medical dashboards that help healthcare professionals monitor patient vital signs with accuracy and clarity.
You can contact us through our support forums, support portal, or feedback portal. We are always happy to assist you!
Related Blogs
Subscribe to my newsletter
Read articles from syncfusion directly inside your inbox. Subscribe to the newsletter, and don't miss out.
Written by
syncfusion
syncfusion
Syncfusion provides third-party UI components for React, Vue, Angular, JavaScript, Blazor, .NET MAUI, ASP.NET MVC, Core, WinForms, WPF, UWP and Xamarin.