How to OTel: Hands-On with the OpenTelemetry Demo
 Yash RV
Imagine you’re running a modern ecommerce application buzzing with services talking to each other, users add products to cart, checkout happens, payments get processed, orders get packed, shipments go out the door. It’s distributed. It’s messy. And that’s exactly what real-world systems look like today. The OpenTelemetry Demo drops you right into this story. It’s an Astronomy Shop which is a hands-on, microservice-based app that mirrors how modern systems work. Each service - checkout, payments, shipping - calls another, passing data and creating a tangle of requests that can be hard to untangle without good observability.
This demo doesn’t just show static examples, but a complex, real-world kind of setup - where microservices fail, recover, and talk across networks. It shows you how to instrument your services - no matter if they’re in Python, Java, Go, or Node.js - so you can capture traces, metrics, and logs that reveal what’s really happening. You learn to follow requests end-to-end, spot slow calls, and find what breaks under load. You don’t need a giant production cluster to try this out. You can spin everything up fast using Docker or Kubernetes.
Originally the application uses open source tools like Grafana and Jaeger that are built in to help you visualize the data flows. However, in this version, you’ll use SigNoz as the observability backend with some minor config changes. Think this demo as your playground for observability. You don’t just read about it. You see it, break it, fix it. So if you’re new to OTel, this is your launchpad. If you already know the basics, it’s a way to go deeper - test different languages, mess with configs, watch telemetry flow like a living map of your system.
OpenTelemetry Demo Overview
For running the OpenTelemetry Demo App, most people start with Docker Compose on their local machine. However, in real-world production environments, large applications are usually managed with tools like Kubernetes, not Docker Compose. For this beginner-friendly tutorial, we’ll stick with Docker Compose because it’s simple to set up and doesn’t require much heavy lifting and experience.
To start the demo locally, you must have Docker and Docker Compose installed. Then
Step 1: Clone the Demo repository:
git clone https://github.com/open-telemetry/opentelemetry-demo.git
cd opentelemetry-demo
Step 2: Configure the OpenTelemetry Collector to export telemetry data to SigNoz
Step 3: Start the demo application.
docker compose up -d

Once all the containers are started, we can see the web store: http://localhost:8080/
The application UI is as follows:

However, before moving on, let’s first try to understand how the different services in this demo work together.
Frontend Service (TypeScript): The user lands here first. It generates session IDs, serves the UI, and collects user actions, calls product catalog, Cart, Advertisement and Recommendation Services.
Product Catalog Service (Go): It provides product listings and search results when the user browses the shop.
Advertisement Service (Java): It supplies contextual ads for upselling or cross-selling. The Frontend pulls these during browsing.
Cart Service (.NET): It stores and retrieves cart items as the user adds or removes products. Holds the state until checkout.
Recommendation Service (Python): It suggests additional items based on what’s in the cart. Called by the Frontend to show “You may also like…” suggestions.
Quote Service (PHP): It estimates shipping costs based on the cart contents and destination. Gives users cost visibility before they checkout.
Checkout Service (Go): It orchestrates the purchase flow when the user clicks “Place Order.” Pulls cart data, calls Currency to convert prices if needed, checks with Fraud Detection, charges via Payment Service, triggers Shipping and Email, and records the transaction in Accounting.
Currency Service (C++): It handles real-time currency conversion for multi-currency payments. Supports Checkout when orders use foreign currencies.
Fraud Detection Service (Kotlin): It verifies if the order looks suspicious before Payment runs. Adds a security layer.
Payment Service (JavaScript): It charges the customer’s card (mock implementation). Returns transaction ID to Checkout.
Shipping Service (Rust): It receives shipping details after successful payment. Estimates costs, generates mock shipment status, and closes the logistics loop.
Email Service (Ruby): It sends an order confirmation email once Checkout succeeds. Keeps the customer informed.
Accounting Service (.NET): Records the final transaction in the shop’s ledger. Supports financial reporting and auditing.
React Native App (TypeScript): It provides a mobile UI for users on Android and iOS devices to interact with the demo’s services. It is built with
Expoand it calls the same backend services for consistent user flows on mobile devices.
| Language | Tooling Requirements |
| .NET | .NET 8.0+ |
| Go | Go 1.19+, protoc-gen-go, protoc-gen-go-grpc |
| Java | JDK 17+, Gradle 7+ |
| JavaScript | Node.js 16+ |
| PHP | PHP 8.1+, Composer 2.4+ |
| Python | Python 3.10, grpcio-tools 1.48+ |
| Ruby | Ruby 3.1+ |
| Rust | Rust 1.61+, protoc 3.21+, protobuf-dev |
Load Generator (Locust): This simulates real traffic, sends realistic browsing and checkout requests to stress test the system.
Kafka (Message Queue)
It works as the message broker between services. When the Checkout Service finishes an order, it publishes events to Kafka. Both the Accounting and Fraud Detection Service consume these events to update ledgers or run fraud checks asynchronously. The Kafka is instrumented with the OTel Java agent. It uses the JMX Metric Insight Module to capture broker metrics and exports them via OTLP.
How This Flow Works Together

All these services are instrumented with OpenTelemetry, that communicates over HTTP or gRPC. Usually each request starts at the Frontend, React Native App or Load Generator. From there, calls ripple out to Product Catalog, Ads, Cart, and Recommendations. A quote check shows shipping costs. Checkout ties it all together, talking to Currency, Fraud Detection, Payment, Shipping, Email, and Accounting in turn. All services then push traces, metrics, and logs to an observability backend through OpenTelemetry collector.
Moreover, like any other modern apps that often use feature flags to toggle functionality without redeploying code. The OTel demo includes this too. It uses flagd, a feature flag service that supports OpenFeature. You can manage flags through a web UI in real time at http://localhost:8080/feature while the demo is running. This makes it easy to simulate new features, partial rollouts, or failures. Combined with the observability stack, you can watch how flag changes ripple through your traces, metrics, and logs.
Instrumenting Application Code
For this blog, we will focus on two services: Python based RecommendationService and JavaScript based PaymentService. But before looking at how these services use OpenTelemetry, it’s important to understand a few key concepts.
In order to observe your system, it first needs to emit telemetry signals. That’s what instrumentation enables. It is the process of preparing your application to generate telemetry like traces, metrics, and logs. Without it, there is usually no data to collect and no insights to analyze. OpenTelemetry facilitates two main instrumentation solutions: Zero-code (automatic instrumentation) and Code-based (manual instrumentation).
In Zero-code instrumentation, as the name suggests, you get useful telemetry data with almost no code changes. Usually, it is a good place to start as you do not need to add tracing, metrics, or logging related code, except where explicitly required. Instead, you run your application with a wrapper, like
opentelemetry-instrumentfor Python. This wrapper loads instrumentation plugins that automatically patch popular libraries such as Flask, Requests, or SQLAlchemy.However, it is limited to what the plugins provide. You do not have fine control over what gets traced or how attributes are added. On the other hand, Coded instrumentation means you explicitly add OpenTelemetry code to your application. You decide where to create spans, which attributes to attach, which metrics to record, and how to export logs. Manual instrumentation gives you full control and lets you capture custom business logic, but it does require more effort to set up.

The telemetry data that the application emits is usually sent to an OpenTelemetry Collector, which acts as an agent sitting between the application and the vendor backend. The Collector receives telemetry data from one or more services, processes or transforms it if needed (for example, by filtering or batching), and then forwards it for analysis to the vendor of your choice. The Collector makes it easier to change where your data goes without modifying every application. This is the general pattern:
Application Telemetry → OpenTelemetry Collector → Observability Backend.Recommendation Service (Python)
Now with that foundation, let’s look at how the service works in practice. It starts by importing the necessary OpenTelemetry SDK modules for tracing, metrics, and logs. In its main block, it configures environment variables to set the service name and to point to the flagd server for feature flagging. Using OpenFeature with
FlagdProvider, it hooks feature flag evaluations into OpenTelemetry tracing so you can see when flags were evaluated during requests.import os import random from concurrent import futures import grpc # OpenTelemetry APIs from opentelemetry import trace, metrics from opentelemetry._logs import set_logger_provider from opentelemetry.exporter.otlp.proto.grpc._log_exporter import OTLPLogExporter from opentelemetry.sdk._logs import LoggerProvider, LoggingHandler from opentelemetry.sdk._logs.export import BatchLogRecordProcessor from opentelemetry.sdk.resources import Resource # OpenFeature for feature flags from openfeature import api from openfeature.contrib.provider.flagd import FlagdProvider from openfeature.contrib.hook.opentelemetry import TracingHookThen it initializes a tracer, a meter, and a logger provider. The tracer is used to create spans that mark operations in your code, like retrieving product lists. The meter is used to record numerical metrics - for example, how many recommendations were returned in a request. The logger provider, paired with an
OTLPLogExporter, sends logs in the OpenTelemetry format to a collector endpoint.This way, all three signals - traces, metrics, and logs are exported consistently. The
ListRecommendationscallsget_product_list(defined next) manually fetches the current span so it can attach extra metadata: how many products were recommended. It logs that the request was handled and creates the gRPC response, adds product IDs, and returns it, and then some health checks.class RecommendationService(demo_pb2_grpc.RecommendationServiceServicer): def ListRecommendations(self, request, context): prod_list = get_product_list(request.product_ids) span = trace.get_current_span() span.set_attribute("app.products_recommended.count", len(prod_list)) logger.info(f"Receive ListRecommendations for product ids:{prod_list}") response = demo_pb2.ListRecommendationsResponse() response.product_ids.extend(prod_list) rec_svc_metrics["app_recommendations_counter"].add(len(prod_list), {'recommendation.type': 'catalog'}) return response # gRPC health checks def Check(self, request, context): return health_pb2.HealthCheckResponse( status=health_pb2.HealthCheckResponse.SERVING) def Watch(self, request, context): return health_pb2.HealthCheckResponse( status=health_pb2.HealthCheckResponse.UNIMPLEMENTED)When a
ListRecommendationsrequest comes in, the method callsget_product_list, it is where the recommendation logic and custom span live. Here’s what happens:The function starts a new span for this operation and gets a fresh product list from the Product Catalog.
If the feature flag
recommendationCacheFailureis on, it randomly simulates a cache hit or miss and logs that. When it “misses,” it leaks more IDs into a local cache, growing over time - this is a way to test observability of cache failures.It records multiple attributes into the span so you can see details in your trace view and filters out any product IDs already requested and samples up to 5 recommendations to return.
    def get_product_list(request_product_ids):
        global first_run
        global cached_ids
        with tracer.start_as_current_span("get_product_list") as span:
            max_responses = 5

            request_product_ids_str = ''.join(request_product_ids)
            request_product_ids = request_product_ids_str.split(',')

            if check_feature_flag("recommendationCacheFailure"):
                span.set_attribute("app.recommendation.cache_enabled", True)
                if random.random() < 0.5 or first_run:
                    first_run = False
                    span.set_attribute("app.cache_hit", False)
                    logger.info("get_product_list: cache miss")
                    cat_response = product_catalog_stub.ListProducts(demo_pb2.Empty())
                    response_ids = [x.id for x in cat_response.products]
                    cached_ids = cached_ids + response_ids
                    cached_ids = cached_ids + cached_ids[:len(cached_ids) // 4]
                    product_ids = cached_ids
                else:
                    span.set_attribute("app.cache_hit", True)
                    logger.info("get_product_list: cache hit")
                    product_ids = cached_ids
            else:
                span.set_attribute("app.recommendation.cache_enabled", False)
                cat_response = product_catalog_stub.ListProducts(demo_pb2.Empty())
                product_ids = [x.id for x in cat_response.products]

            span.set_attribute("app.products.count", len(product_ids))

            filtered_products = list(set(product_ids) - set(request_product_ids))
            num_products = len(filtered_products)
            span.set_attribute("app.filtered_products.count", num_products)
            num_return = min(max_responses, num_products)

            indices = random.sample(range(num_products), num_return)
            prod_list = [filtered_products[i] for i in indices]

            span.set_attribute("app.filtered_products.list", prod_list)

            return prod_list
Finally, in the main block everything gets wired up:
    if __name__ == "__main__":
        service_name = must_map_env('OTEL_SERVICE_NAME')

        # Feature flags setup
        api.set_provider(FlagdProvider(host=os.environ.get('FLAGD_HOST', 'flagd'), port=os.environ.get('FLAGD_PORT', 8013)))
        api.add_hooks([TracingHook()])

        # Tracing and Metrics setup
        tracer = trace.get_tracer_provider().get_tracer(service_name)
        meter = metrics.get_meter_provider().get_meter(service_name)
        rec_svc_metrics = init_metrics(meter)

        # Logging setup
        logger_provider = LoggerProvider(
            resource=Resource.create({'service.name': service_name})
        )
        set_logger_provider(logger_provider)
        log_exporter = OTLPLogExporter(insecure=True)
        logger_provider.add_log_record_processor(BatchLogRecordProcessor(log_exporter))
        handler = LoggingHandler(level=logging.NOTSET, logger_provider=logger_provider)

        logger = logging.getLogger('main')
        logger.addHandler(handler)

        # Connect to Product Catalog
        catalog_addr = must_map_env('PRODUCT_CATALOG_ADDR')
        pc_channel = grpc.insecure_channel(catalog_addr)
        product_catalog_stub = demo_pb2_grpc.ProductCatalogServiceStub(pc_channel)

        # Start gRPC server
        server = grpc.server(futures.ThreadPoolExecutor(max_workers=10))
        service = RecommendationService()
        demo_pb2_grpc.add_RecommendationServiceServicer_to_server(service, server)
        health_pb2_grpc.add_HealthServicer_to_server(service, server)

        port = must_map_env('RECOMMENDATION_PORT')
        server.add_insecure_port(f'[::]:{port}')
        server.start()
        logger.info(f'Recommendation service started, listening on port {port}')
        server.wait_for_termination()
In summary, you see exactly how tracer, meter and logger are initialized with custom spans, attributes, and structured logs and used directly in the code. This works hand in hand with the typical OpenTelemetry pipeline, where your data flows to the collector, and finally to your storage and analysis backends.
Payment Service (JavaScript)
This JavaScript based PaymentService process credit card payments while establishing communication with several other service concurrently. The service is written in NodeJS that uses both Zero-code instrumentation, via the OpenTelemetry Node SDK and plugins, and Coded instrumentation, to add custom spans, attributes, baggage, and metrics related to payment logic. The service logic works in the follows:
- When you run the Payment Service container, the entry point is not just
index.js, butopentelemetry.jsruns first. Because in Node.js, you must load OpenTelemetry before your app, so that the auto or zero-code instrumentation can patch modules as they load.
node -r ./opentelemetry.js index.js
Inside opentelemetry.js:
const opentelemetry = require('@opentelemetry/sdk-node');
const { getNodeAutoInstrumentations } = require('@opentelemetry/auto-instrumentations-node');
const { OTLPTraceExporter } = require('@opentelemetry/exporter-trace-otlp-grpc');
const { OTLPMetricExporter } = require('@opentelemetry/exporter-metrics-otlp-grpc');
It does 3 things before the app logic runs:
Auto-instrumentation: Hooks HTTP, gRPC, fs, and runtime libraries.
Exporters: Connects to the OpenTelemetry Collector via OTLP.
Resource detection: Captures metadata (cloud, host, container).
Then the SDK starts and now, the app’s gRPC server will run inside this observability context.
sdk.start();
- Then your microservice client calls the
Chargemethod in thePaymentService
const grpc = require('@grpc/grpc-js');
const protoLoader = require('@grpc/proto-loader');
const otelDemoPackage = grpc.loadPackageDefinition(protoLoader.loadSync('demo.proto'));
const server = new grpc.Server();

server.addService(otelDemoPackage.oteldemo.PaymentService.service, {
  charge: chargeServiceHandler
});
As gRPC is auto-instrumented by OpenTelemetry: a root span for the gRPC call is created automatically and records details like method name, status code, timing.
The
chargeServiceHandlerhandles the requestInside
index.js:
async function chargeServiceHandler(call, callback) {
  const span = opentelemetry.trace.getActiveSpan();
  ...
}
getActiveSpan() grabs the auto-instrumented span for this RPC. Then, the handler:
Adds attributes to the span:
  span?.setAttributes({
    'app.payment.amount': parseFloat(`${amount.units}.${amount.nanos}`)
      .toFixed(2)
  });
Logs that the request was received.
Passes the request to
charge.charge(...)to do the actual business logic.
If an error happens:
span?.recordException(err);
span?.setStatus({ code: opentelemetry.SpanStatusCode.ERROR });
callback(err);
So, exceptions are linked to the trace, and you’ll see them in Jaeger or your observability backend.
4. The request flows to charge.js: the business logic
charge.js is where the real work and manual instrumentation happens.
const tracer = trace.getTracer('payment');
const span = tracer.startSpan('charge');
This creates a new child span named charge under the active span.
Now you have:
chargeServiceHandler→ auto spancharge→ manual child span
This nested span shows the detailed steps in tracing UIs.
5. Feature flag is checked
The service uses OpenFeature to see if this payment should randomly fail, simulating real-world conditions.
const numberVariant = await OpenFeature.getClient().getNumberValue("paymentFailure", 0);
if (Math.random() < numberVariant) {
  span.setAttributes({ 'app.loyalty.level': 'gold' });
  throw new Error('Payment request failed.');
}
This sets span attributes you can see later, so you know why it failed.
6. Credit card is validated
The span adds more attributes:
span.setAttributes({
  'app.payment.card_type': cardType,
  'app.payment.card_valid': valid,
  'app.loyalty.level': loyalty_level
});
If the card is invalid or expired:
An error is thrown.
The exception is linked to the trace.
7. Baggage is checked
If the request is from a synthetic load generator, it sets app.payment.charged accordingly. This means test traffic is visible in traces but doesn’t pollute real payment data.
const baggage = propagation.getBaggage(context.active());
if (baggage?.getEntry('synthetic_request')?.value === 'true') {
  span.setAttribute('app.payment.charged', false);
} else {
  span.setAttribute('app.payment.charged', true);
}
8. Metrics are recorded
transactionsCounter.add(1, { 'app.payment.currency': currencyCode });
At the end, this updates a custom counter metric, which flows to Prometheus (or any backend you hook up via the Collector).
9. Logging happens
The service logs with pino, adding service.name automatically.
logger.info({ transactionId, ... }, 'Transaction complete.');
So you have: Trace for request flow. Logs for debug details. Metrics for performance trends. All correlated via the trace ID.
10. Telemetry exported
The NodeSDK you bootstrapped, periodically exports traces & metrics over OTLP → to the OpenTelemetry Collector. The Collector can then send telemetry to the observability backend.
So, overall in the payment service, you get auto-instrumentation for common protocols without writing custom code, and manual instrumentation for domain-specific data: amounts, card type, feature flags, and baggage. All signals flow together, so you can slice & dice the data by customer, region, or flag version.

Exporting Telemetry Data
At first when you look at the OpenTelemetry Collector configurations for this demo, we see two files: otelcol-config.yml and otelcol-config-extras.yml
The base or otelcol-config.yml acts as the canonical base configuration, defining the default receivers, processors, and exporters required for the demo’s microservices to generate and process telemetry data correctly.
Receivers, define where to get telemetry data from.
otlp: accepts data in OTLP format over gRPC and HTTP.httpcheck/frontend-proxy,nginx,docker_stats,redis: scrape metrics from services or containers.hostmetrics: collects system metrics (CPU, memory, disk, network, processes) from the host.
Processors, transform or control data flow.
batch: batches data for better performance.memory_limiter: prevents the collector from using too much memory.transform: rewrites span names to standardize traces.redaction: sanitize PII or any sensitive data at the collector level.
Exporters:
Sections under exporters send data to backends.
debug: logs data for debugging.otlp: sends traces to Jaeger.otlphttp/prometheus: sends metrics to Prometheus.opensearch: sends logs to OpenSearch.
Connectors:
spanmetrics: generates metrics from traces.
Service pipelines:
The service section wires everything together:
traces: collects traces fromotlpreceiver, processes them, and exports tootlp(Jaeger),debug, andspanmetrics.metrics: collects metrics from all receivers, processes, and exports to Prometheus anddebug.logs: collects logs fromotlp, processes, and exports to OpenSearch anddebug.
# otelcol-config.yml

receivers:
  otlp:
    protocols:
      grpc:
        endpoint: ${env:OTEL_COLLECTOR_HOST}:${env:OTEL_COLLECTOR_PORT_GRPC}
      http:
        endpoint: ${env:OTEL_COLLECTOR_HOST}:${env:OTEL_COLLECTOR_PORT_HTTP}
        cors:
          allowed_origins:
            - "http://*"
            - "https://*"
  httpcheck/frontend-proxy:
    targets:
      - endpoint: http://${env:FRONTEND_PROXY_ADDR}
  nginx:
    endpoint: http://${env:IMAGE_PROVIDER_HOST}:${env:IMAGE_PROVIDER_PORT}/status
    collection_interval: 10s
  docker_stats:
    endpoint: unix:///var/run/docker.sock
  redis:
    endpoint: "valkey-cart:6379"
    username: "valkey"
    collection_interval: 10s
  # Host metrics
  hostmetrics:
    root_path: /hostfs
    scrapers:
      cpu:
        metrics:
          system.cpu.utilization:
            enabled: true
      disk:
      load:
      filesystem:
        exclude_mount_points:
          mount_points:
            - /dev/*
            - /proc/*
            - /sys/*
            - /run/k3s/containerd/*
            - /var/lib/docker/*
            - /var/lib/kubelet/*
            - /snap/*
          match_type: regexp
        exclude_fs_types:
          fs_types:
            - autofs
            - binfmt_misc
            - bpf
            - cgroup2
            - configfs
            - debugfs
            - devpts
            - devtmpfs
            - fusectl
            - hugetlbfs
            - iso9660
            - mqueue
            - nsfs
            - overlay
            - proc
            - procfs
            - pstore
            - rpc_pipefs
            - securityfs
            - selinuxfs
            - squashfs
            - sysfs
            - tracefs
          match_type: strict
      memory:
        metrics:
          system.memory.utilization:
            enabled: true
      network:
      paging:
      processes:
      process:
        mute_process_exe_error: true
        mute_process_io_error: true
        mute_process_user_error: true

exporters:
  debug:
  otlp:
    endpoint: "jaeger:4317"
    tls:
      insecure: true
  otlphttp/prometheus:
    endpoint: "http://prometheus:9090/api/v1/otlp"
    tls:
      insecure: true
  opensearch:
    logs_index: otel
    http:
      endpoint: "http://opensearch:9200"
      tls:
        insecure: true

processors:
  batch:
  memory_limiter:
    check_interval: 5s
    limit_percentage: 80
    spike_limit_percentage: 25
  transform:
    error_mode: ignore
    trace_statements:
      - context: span
        statements:
          # could be removed when https://github.com/vercel/next.js/pull/64852 is fixed upstream
          - replace_pattern(name, "\\?.*", "")
          - replace_match(name, "GET /api/products/*", "GET /api/products/{productId}")

connectors:
  spanmetrics:

service:
  pipelines:
    traces:
      receivers: [otlp]
      processors: [memory_limiter, transform, batch]
      exporters: [otlp, debug, spanmetrics]
    metrics:
      receivers: [docker_stats, httpcheck/frontend-proxy, hostmetrics, nginx, otlp, redis, spanmetrics]
      processors: [memory_limiter, batch]
      exporters: [otlphttp/prometheus, debug]
    logs:
      receivers: [otlp]
      processors: [memory_limiter, batch]
      exporters: [opensearch, debug]
  telemetry:
    metrics:
      level: detailed
      readers:
        - periodic:
            interval: 10000
            timeout: 5000
            exporter:
              otlp:
                protocol: http/protobuf
                endpoint: ${env:OTEL_COLLECTOR_HOST}:${env:OTEL_COLLECTOR_PORT_HTTP}
- However, to support extensibility without introducing configuration drift, the demo uses otelcol-config-extras.yml as an overlay file. This pattern helps to inject custom pipeline elements, such as additional exporters for routing data to an external backend like SigNoz, without modifying the base configuration.
# otelcol-config-extras.yml

exporters:
  otlp:
    endpoint: "https://ingest.{your-region}.signoz.cloud:443"
    tls:
      insecure: false
    headers:
      signoz-ingestion-key: <SIGNOZ-INGESTIONKEY>
  debug:
    verbosity: detailed

service:
  pipelines:
    metrics:
      exporters: [otlp]
    traces:
      exporters: [spanmetrics, otlp]
    logs:
      exporters: [otlp]
During runtime, the Collector’s entrypoint merges the base and extras files, ensuring the default pipelines remain intact while appending user-defined components. This separation keeps environment-specific or developer-specific changes isolated, reducing merge conflicts when updating the demo or reusing its configuration across environments. By adopting this layered configuration approach, engineers can manage custom pipelines and backend integrations in a reproducible, version-controlled manner that aligns with configuration-as-code best practices.
Redacting Sensitive Data in OTel Collector
In real-world systems, it’s not unusual for traces, logs, or even metrics to carry bits of information that you never meant to expose. Think of things like user emails, API tokens, auth credentials or even credit card information. These can show up in places you might sometime overlook - a trace might capture a full HTTP URL with a user’s email in the query string, or a log might print an entire request payload that includes a bearer token. HTTP headers are another common spot where sensitive values can sneak in unnoticed. If you don’t catch this early, these details may flow unchecked through your observability pipeline and land in third-party storage, which could break compliance rules or put your users at risk.
That’s why it’s critical to sanitize sensitive data at the source whenever you can. Usually instrumentation code should avoid capturing confidential fields, or redact them before they ever leave your app. But no one gets this perfect every time, which is why the OpenTelemetry Collector is so valuable as a second layer of protection. So lets add processors that automatically clean up any sensative data before it’s exported elsewhere. Let’s walk through how you can do this, with real configuration examples you can adapt for your own system.
Handling Known Fields with the Attributes Processor
When you know exactly which attribute keys hold sensitive information, the attributes processor gives you simple, direct control. You can replace, remove, or hash fields in traces, logs, or metrics. For example, suppose your telemetry sometimes includes
user.emailorauth.tokenattributes. Here’s how you’d handle this in yourotelcol-config-extras.ymlprocessors: attributes/clean_fields: actions: - key: user.email value: "[REDACTED]" action: update - pattern: auth.* action: delete - key: client.ip action: hashHow this works:
user.emailis replaced with[REDACTED]so the actual address never leaves your Collector.Any attribute matching
auth.*— such asauth.tokenorauth.header— is dropped entirely.client.ipis hashed, so you can still analyze unique IPs for traffic patterns without storing raw addresses.
Then, wire this processor into all your pipelines:
    service:
      pipelines:
        traces:
          processors: [attributes/clean_fields]
        metrics:
          processors: [attributes/clean_fields]
        logs:
          processors: [attributes/clean_fields]
This approach is perfect when you can identify your risky fields ahead of time.
Using the Redaction Processor for Dynamic or Unknown Data
Sometimes, you can’t predict which keys might leak sensitive details — especially in systems with dynamic payloads or third-party libraries that add extra fields. The redaction processor helps here by letting you enforce strong allowlists or pattern-based masking.
- Enforce an allowlist: Say you trust
http.method,http.url, andhttp.status_code— but you want to drop every other attribute. Everything else is discarded by default, which makes this approach strong for high-compliance environments.
- Enforce an allowlist: Say you trust
    processors:
      redaction/strict_allowlist:
        allow_all_keys: false
        allowed_keys:
          - http.method
          - http.url
          - http.status_code
Mask by pattern: Suppose your logs might contain a password field or API keys under different names. You can block or mask them by matching keys or value patterns.
  processors:
    redaction/mask_patterns:
      allow_all_keys: true
      blocked_key_patterns:
        - .*token.*
        - .*password.*
      blocked_values:
        - "[a-zA-Z0-9._%+-]+@[a-zA-Z0-9.-]+\\.[a-zA-Z]{2,}" # Email pattern
        - "[0-9]{16}" # Credit card number pattern
This means:
Keep all other keys.
Mask any keys that look like tokens or passwords.
Mask values that match an email or credit card number.
You can also choose to hash instead of mask, keeping cardinality without revealing raw data:
    processors:
      redaction/mask_patterns:
        hash_function: sha256
Add this to each pipeline:
    service:
      pipelines:
        traces:
          processors: [redaction/mask_patterns]
        logs:
          processors: [redaction/mask_patterns]
Advanced Redaction with the Transform Processor
For the most flexible scenarios, when you need to redact fields based on conditions, run multiple steps, or sanitize data inside string values, the transform processor is your best tool. It uses the OpenTelemetry Transformation Language (OTTL) to let you write custom logic. For example, if your URLs might contain an email as a query parameter:
  processors:
    transform/sanitize_query:
      error_mode: ignore
      trace_statements:
        - keep_keys(span.attributes, ["http.url", "http.method"])
        - replace_pattern(span.attributes["http.url"], "email=[^&]+", "email=[REDACTED]")
Or you might hash the email instead:
  processors:
    transform/sanitize_query:
      trace_statements:
        - replace_pattern(span.attributes["http.url"], "email=([^&]+)", Concat(["email=", SHA256("$1")], ""))
You can also drop fields only under certain conditions — like removing large request bodies for debug-level logs:
  processors:
    transform/conditional_redact:
      log_statements:
        - delete_key(log.attributes, "req.body") where log.severity_number < 17
The transform processor is powerful but requires careful testing — which brings us to the next point.
Viewing in SigNoz.
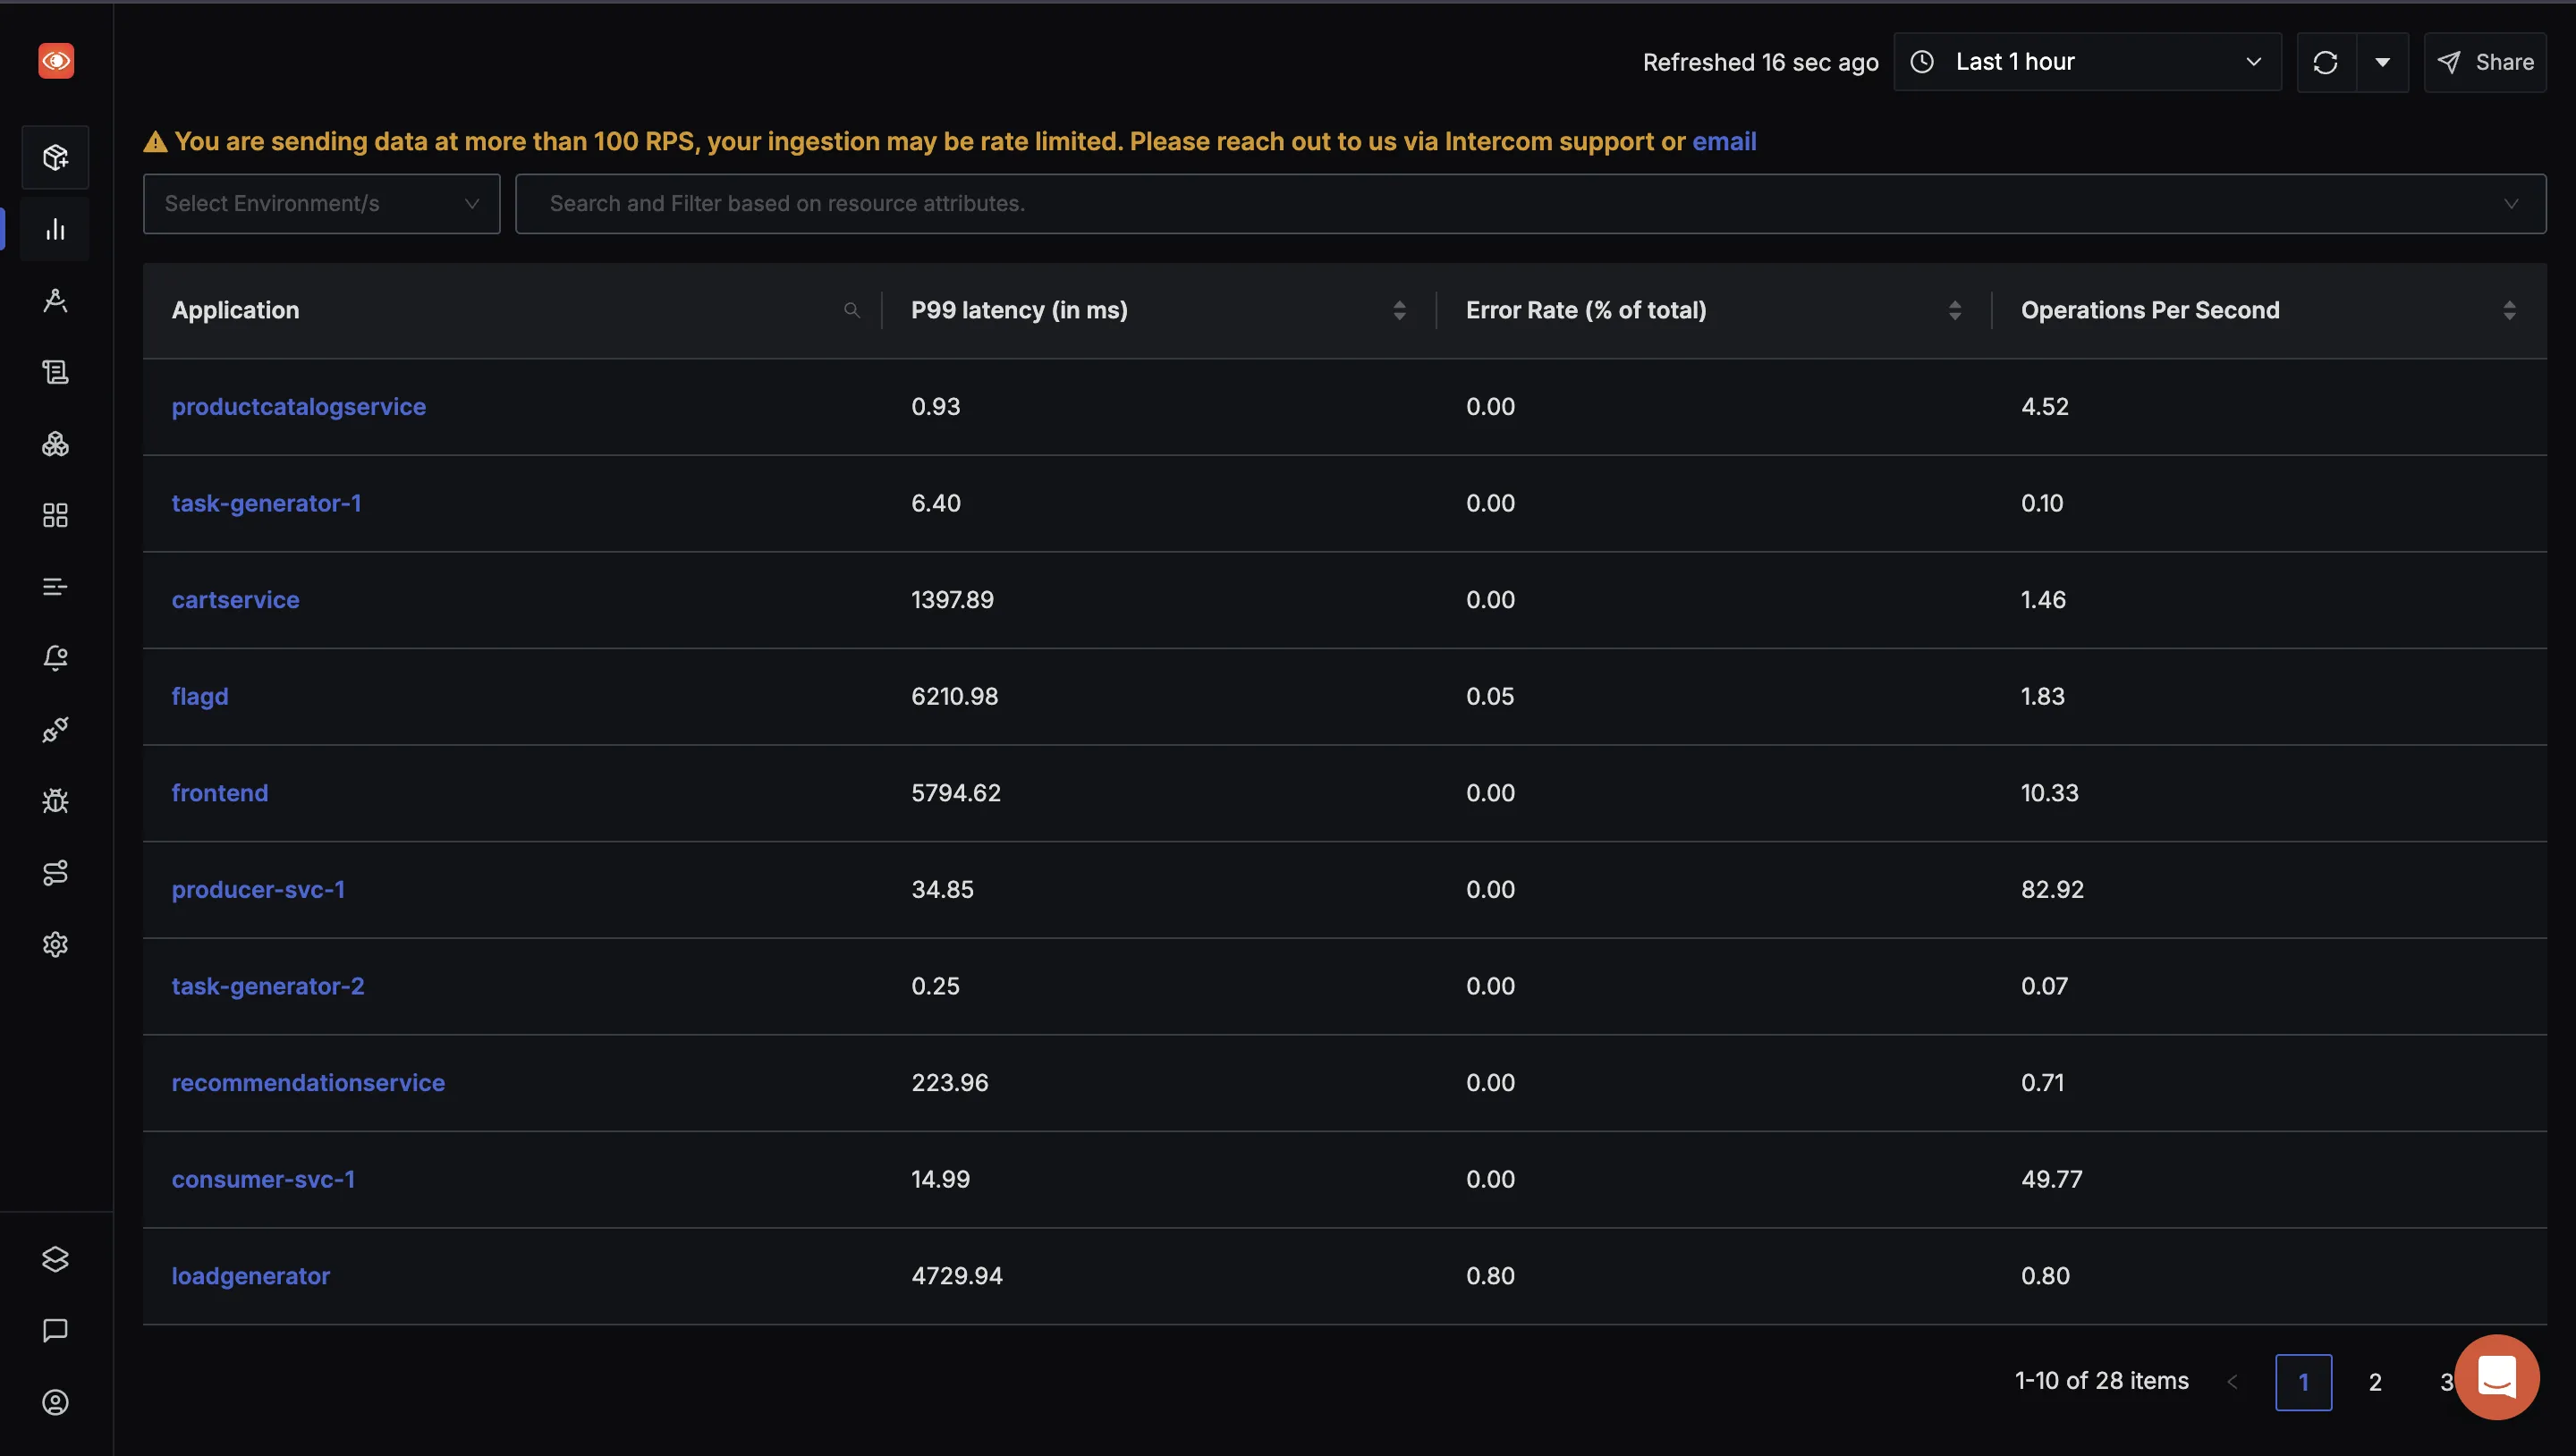
SigNoz automatically generates an architecture view of your application in its Service Map tab.

Let’s walk through some common failure scenarios. We’ll use the OTel Demo App with SigNoz to simulate real issues. Go to http://localhost:8080/feature (it should look like the snapshot below). Enable the right flags as we go to trigger each error.
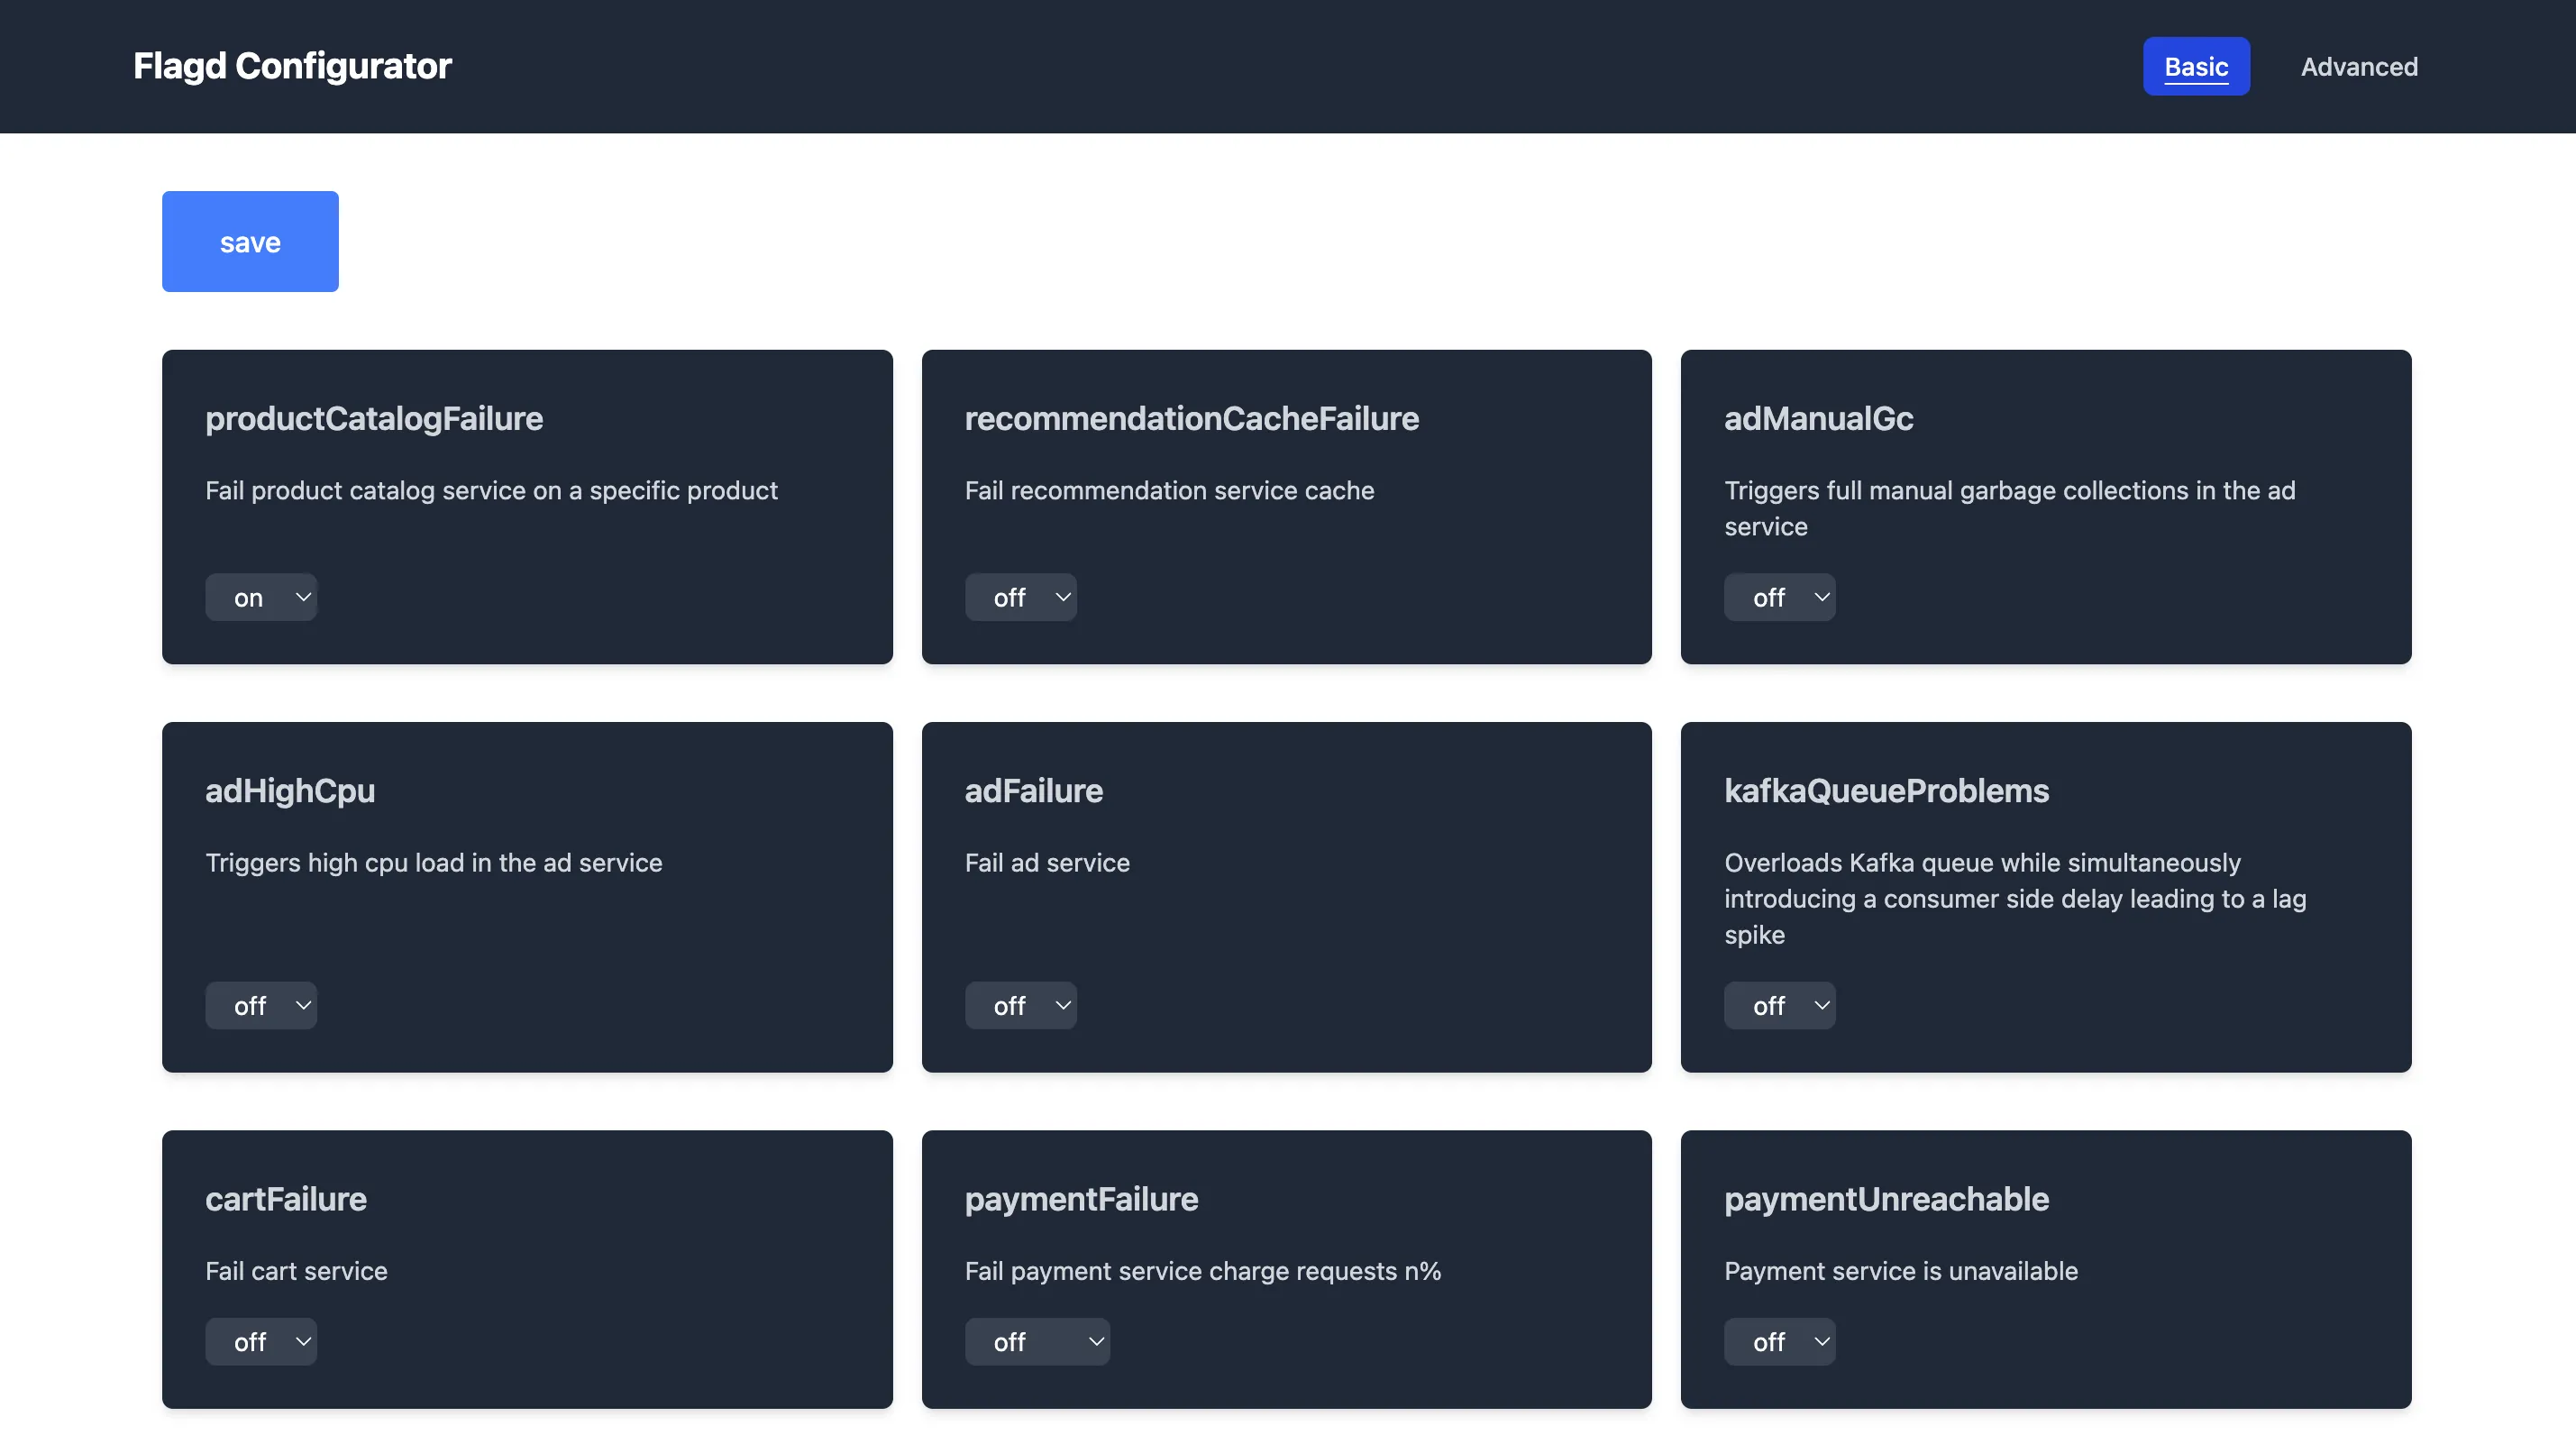
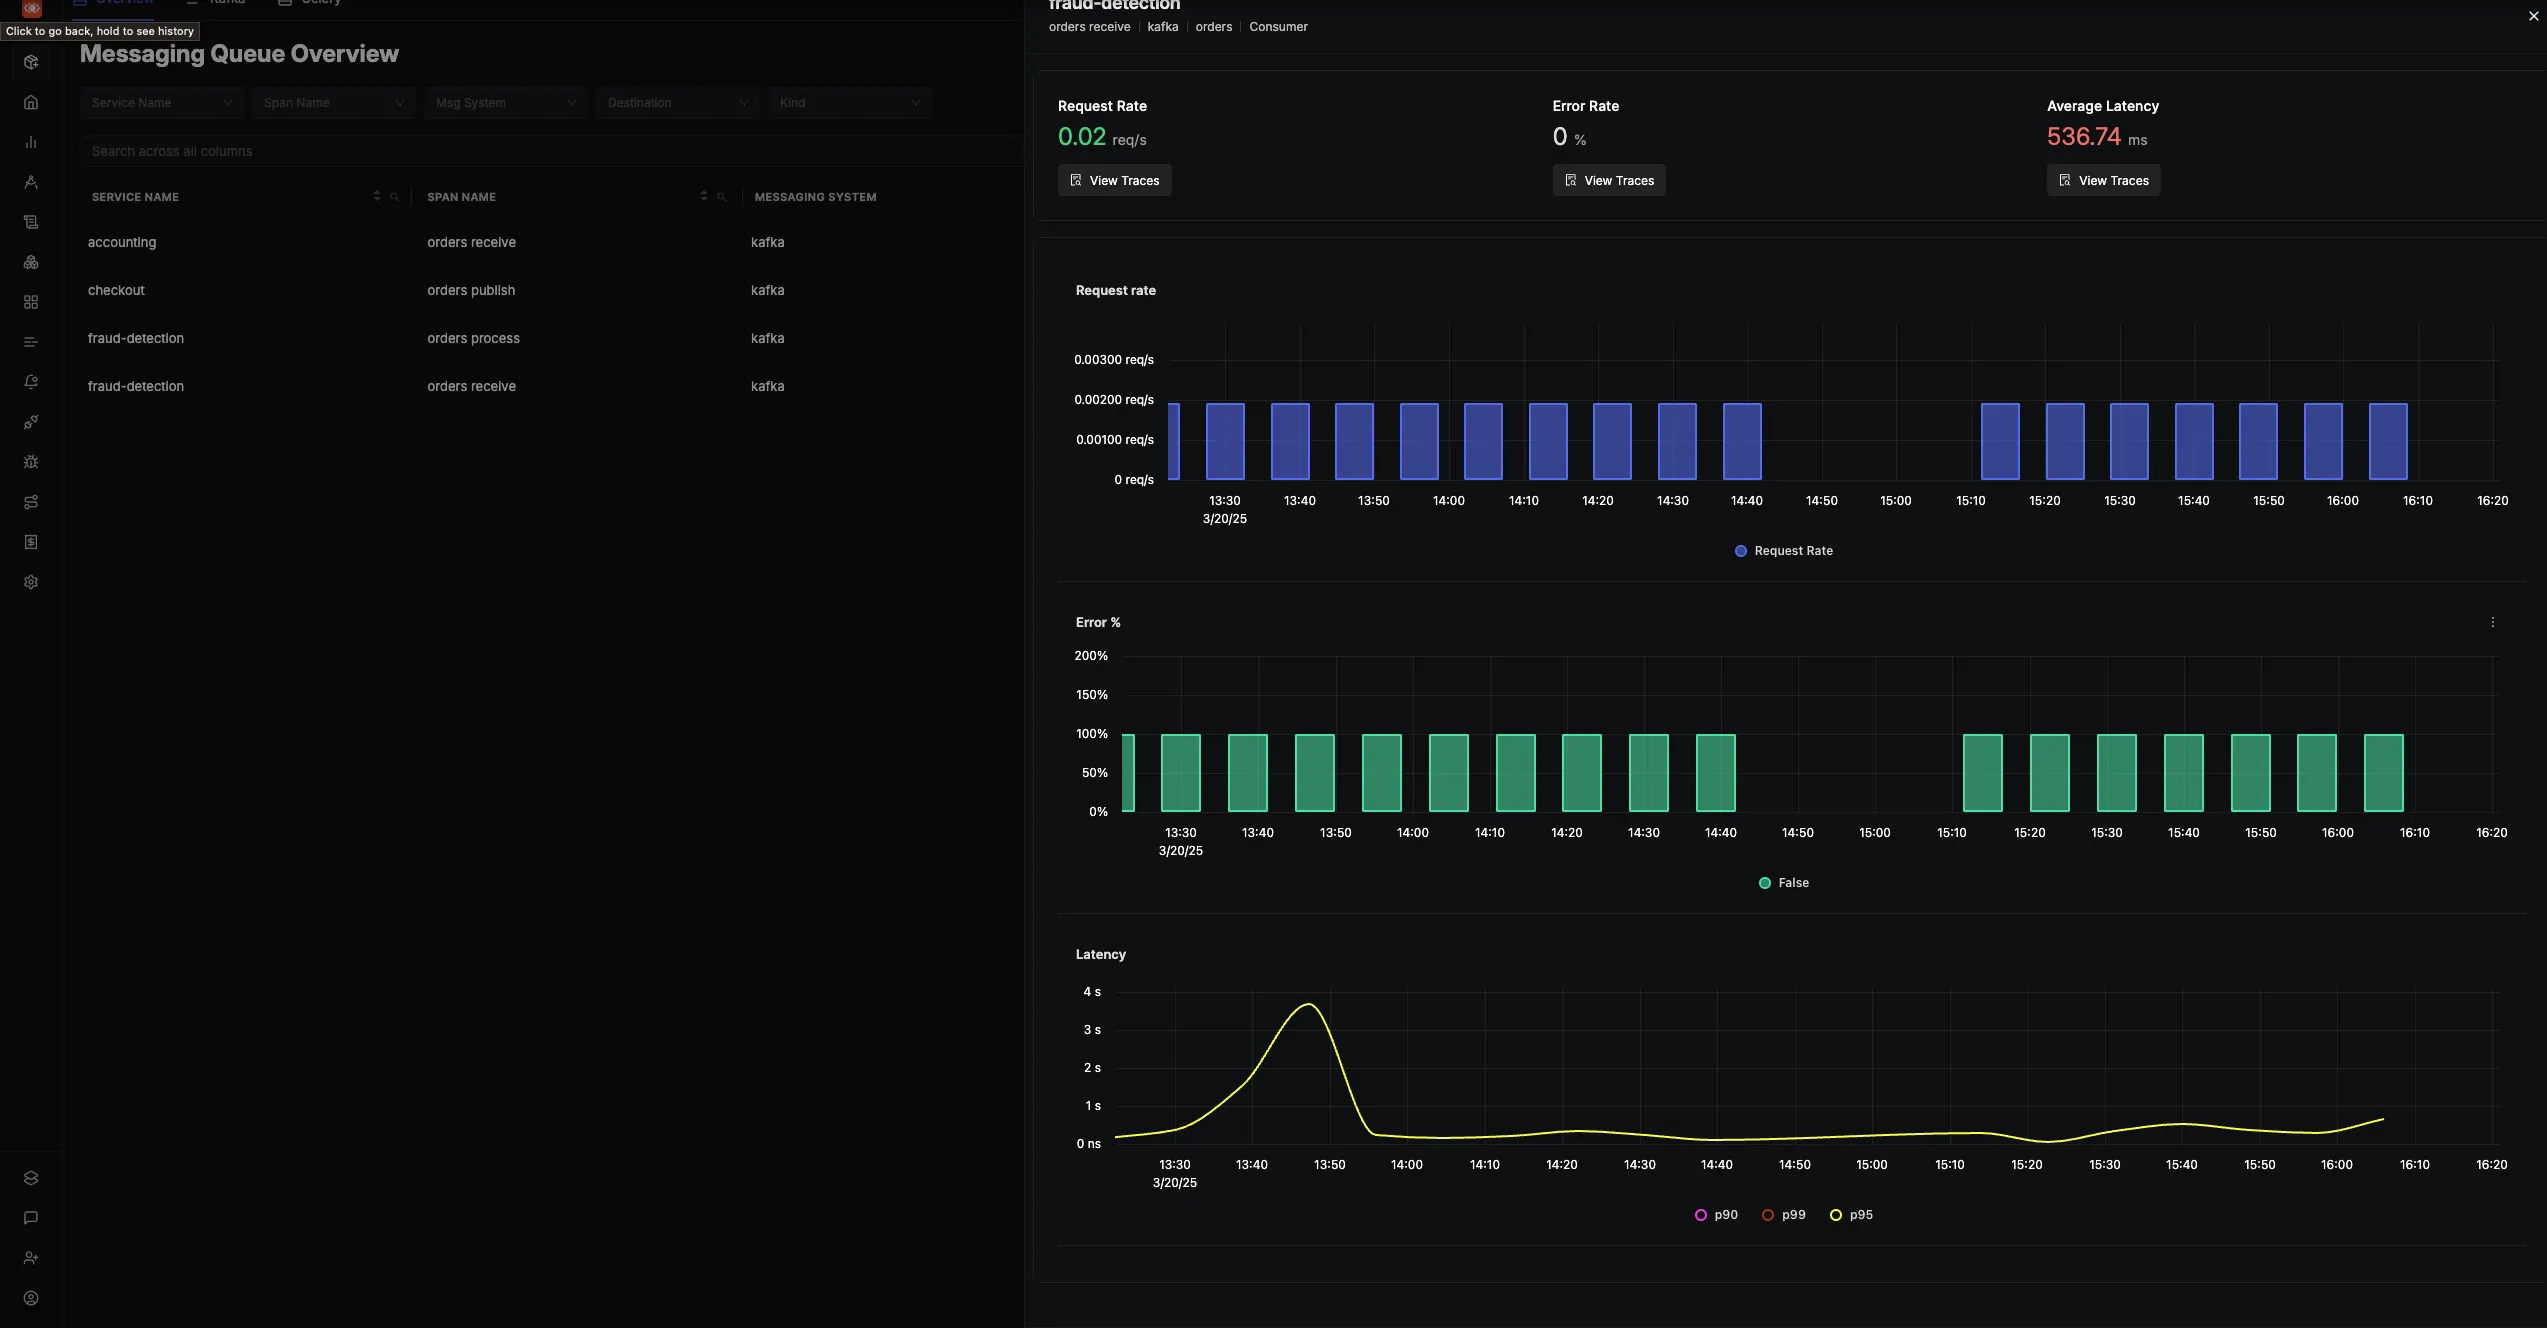
If you need eyes on your Kafka consumers? SigNoz has you covered with a Messaging Queues tab. Watch how your topics are consumed and keep tabs on performance without digging through another dashboard.
Subscribe to my newsletter
Read articles from Yash RV directly inside your inbox. Subscribe to the newsletter, and don't miss out.
Written by
Yash RV
Yash RV
Yash is passionate about Distributed Systems and Observability, and creates content covering topics such as DevOps, and Cloud Native technologies.