I Built My Own Uptime Monitoring Platform — Here’s Why and How
 Naga Satya Dheeraj Anumala
INTRODUCTION
Most developers rely on services like UptimeRobot, Pingdom, or BetterStack to monitor their websites or APIs. But as I was building personal projects, I kept running into limits — either in features, pricing, or customization.
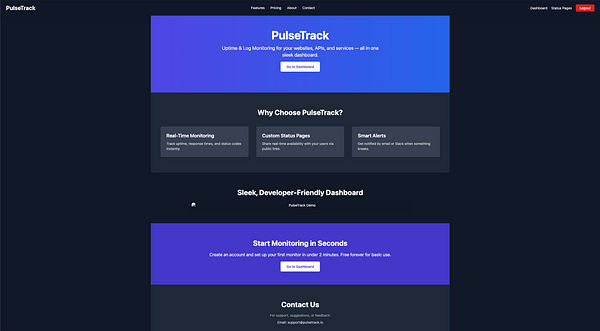
That’s when I decided to build PulseTrack, my uptime and log monitoring service, tailored for developers, startups, and side projects.
In this article, I’ll walk you through:
What PulseTrack is and why I built it
The tech stack I used (Java, Spring Boot, MySQL, React)
Features like retries, alerting, and status pages
Lessons learned building a full-stack monitoring product
Why I Built PulseTrack
Existing tools are great — but here’s what I wanted and couldn’t get (easily or affordably):
Retry logic before alerts (to reduce false positives)
Slack + Email alerts on failure
Public status pages without branding
Logs I could query or export
An open backend I could hack on
So I built PulseTrack — a fully custom monitoring tool that:
Sends periodic pings to your URLs
Logs every result (status code, response time)
Alerts you only when something really fails
Shares public status pages
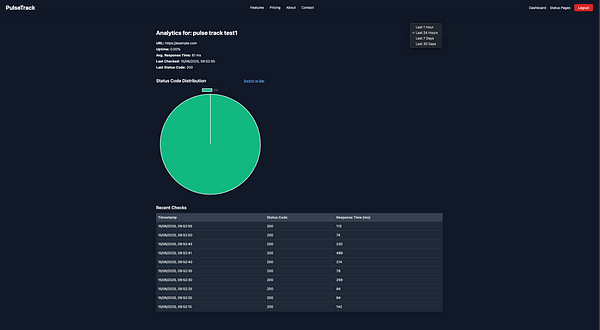
Shows uptime% and average response time
How It Works (Backend)
The backend is built in Java + Spring Boot, with:
JWT-based authentication
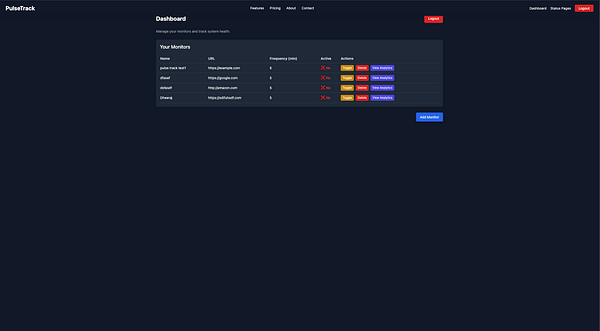
RESTful APIs to manage monitors
A scheduler that checks URLs every X minutes
Retry mechanism: If a check fails, it retries 3 times
Alerts are sent via Email and Slack when failure is confirmed
Logs saved in MySQL, with timestamps and status codes
I used:
@Scheduled or ScheduledExecutorService
RestTemplate for HTTP pings
JavaMailSender for email
Webhook POST for Slack alerts
Frontend & Status Pages
The frontend (in progress) is built with:
React + Tailwind
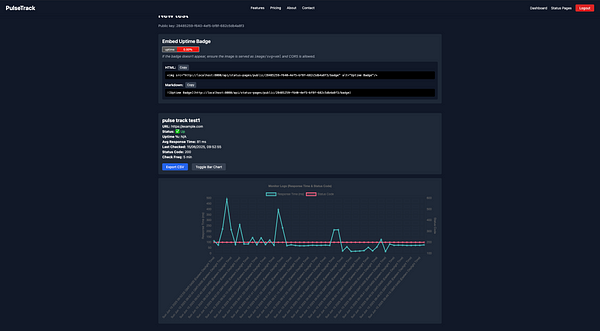
Status pages with uptime %, last checked timestamp, and status code
Toggle between line/bar charts
Export logs as CSV
Public page with a unique publicKey
Here’s a screenshot of what it looks like:
What Makes PulseTrack Special
Feature -> Why It Matters
Retry Logic -> No false alarms at 2 AM
Open-source -> Host it yourself, customize freely
Slack + Email Alerts -> Fast notification on real failure
Public Status Pages -> Share reliability with your clients
Developer-first Design -> RESTful APIs, JWT auth, full control
Lessons Learned
You don’t need a massive team to build a monitoring tool.
Simple retry logic + good alerts go a long way.
Developer UX matters — don’t force dashboards if APIs are a better solution.
Working with logs, time series, and uptime% is a good intro to real SRE work.
What’s Next
WebSocket support for real-time dashboards
Filtering logs by time/status
Rate limiting and caching for public endpoints
Hosted demo & Docker deploy
Try It or Contribute
Check out the repo 👉 [GitHub link]
Want to use PulseTrack? DM me — I’m happy to help you set it up.
Closing Thoughts
Building PulseTrack helped me understand what goes into real observability tools — from backend scheduling to alerting logic and status page design.
If you’re a developer tired of hitting limits with other tools, maybe it’s time you built your own. Or fork mine 😊
Let’s connect → nagasatyadheerajanumala
Subscribe to my newsletter
Read articles from Naga Satya Dheeraj Anumala directly inside your inbox. Subscribe to the newsletter, and don't miss out.
Written by