Query run fast from MySQL CLI but very slow on R2dbcTemplate Code
 Gabriella Barajas
Question:
Currently, I having a query
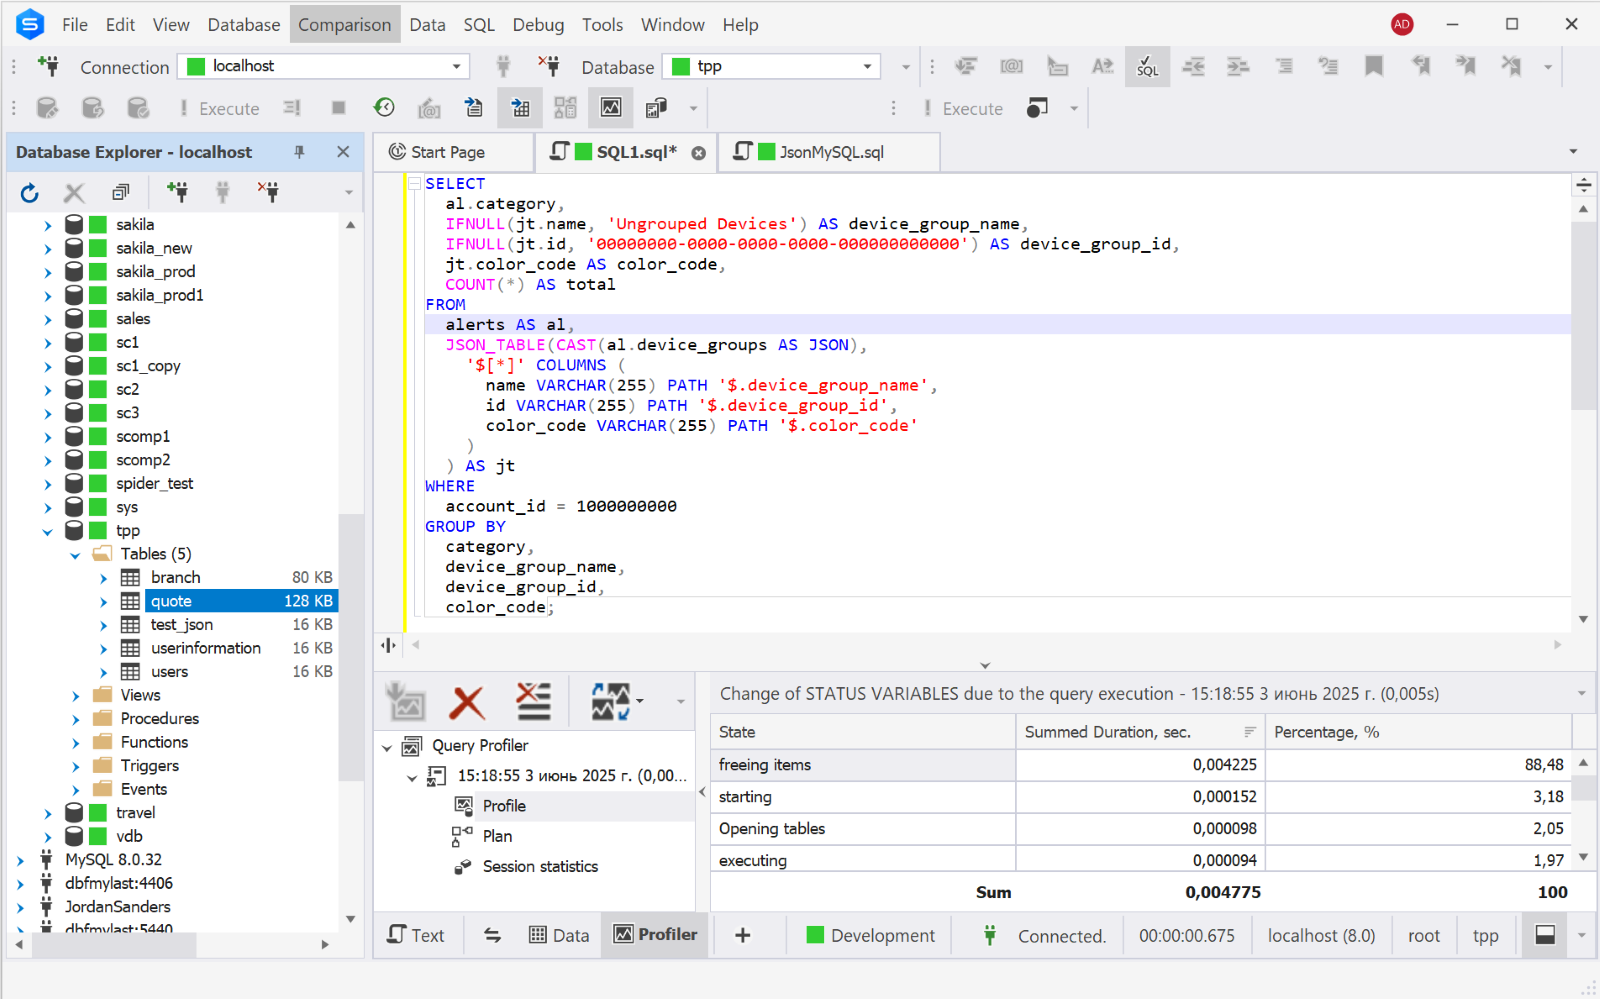
SELECT
  al.category,
  IFNULL(jt.name, 'Ungrouped Devices') AS device_group_name,
  IFNULL(jt.id, '00000000-0000-0000-0000-000000000000') AS device_group_id,
  jt.color_code AS color_code,
  COUNT(*) AS total
FROM
  alerts AS al,
  JSON_TABLE( CAST(al.device_groups AS JSON),
    '$[*]' COLUMNS ( name VARCHAR(255) PATH '$.device_group_name',
      id VARCHAR(255) PATH '$.device_group_id',
      color_code VARCHAR(255) PATH '$.color_code' ) ) AS jt
WHERE
  account_id = 1000000000
GROUP BY
  category,
  device_group_name,
  device_group_id,
  color_code
When I run the query from mysql cli give execution path
+---------------------------------------------------------------------------------------------------------------------------------------------------------------------------------------------------------------------------------------------------------------------------------------------------------------------------------------------------------------------------------------------------------------------------------------------------------------------------------------------------------------------------------------------------------------------------------------------------------------------------------------------------------------------------------------------------------------------------------------------------------------------------------------------------+
| -> Table scan on <temporary>  (actual time=41540.274..41554.003 rows=1956 loops=1)
    -> Aggregate using temporary table  (actual time=41540.265..41540.265 rows=1956 loops=1)
        -> Nested loop inner join  (actual time=0.192..15244.892 rows=676934 loops=1)
            -> Filter: ((al.alert_type_id <> 40) and (al.alert_type_id <> 90) and (al.event_time >= TIMESTAMP'2024-11-22 00:00:00') and (al.event_time < TIMESTAMP'2025-02-20 00:00:00'))  (cost=7946.96 rows=75045) (actual time=0.034..6171.038 rows=676934 loops=1)
                -> Index lookup on al using PRIMARY (account_id=1091000508)  (cost=7946.96 rows=216200) (actual time=0.031..4714.982 rows=676934 loops=1)
            -> Materialize table function  (actual time=0.012..0.013 rows=1 loops=676934)
 |
+---------------------------------------------------------------------------------------------------------------------------------------------------------------------------------------------------------------------------------------------------------------------------------------------------------------------------------------------------------------------------------------------------------------------------------------------------------------------------------------------------------------------------------------------------------------------------------------------------------------------------------------------------------------------------------------------------------------------------------------------------------------------------------------------------+
1 row in set (41.90 sec)
However, when I run the same query in code
    template
        .getDatabaseClient()
        .sql(sql)
        .map(EVENT_CATEGORY_METRIC_ROW_MAPPER)
        .all();
which takes more than 5 mins.
I try to rerun the query from DBeaver client which give result (query run more than 5 mins same as from code).
-> Table scan on <temporary>  (actual time=355837.677..355838.448 rows=1956 loops=1)
    -> Aggregate using temporary table  (actual time=355837.668..355837.668 rows=1956 loops=1)
        -> Nested loop inner join  (actual time=0.120..7819.864 rows=676934 loops=1)
            -> Filter: ((al.alert_type_id <> 40) and (al.alert_type_id <> 90) and (al.event_time >= TIMESTAMP'2024-11-22 00:00:00') and (al.event_time < TIMESTAMP'2025-02-20 00:00:00'))  (cost=7207.37 rows=67649) (actual time=0.050..3442.970 rows=676934 loops=1)
                -> Index lookup on al using PRIMARY (account_id=1091000508)  (cost=7207.37 rows=216200) (actual time=0.043..2399.595 rows=676934 loops=1)
            -> Materialize table function  (actual time=0.006..0.006 rows=1 loops=676934)
Note the cli and code run in a same host. It seem that execution paths are the same. Why would the query from cli run much faster than the one from other code?
Answer:
The difference in query execution time between the MySQL CLI and other clients like DBeaver or your application code often stems from how each client handles query results and interacts with the database. While the server executes the same query plan, client-side factors such as result fetching methods, network overhead, buffering, and session-specific settings can greatly impact overall performance. Additionally, differences in caching, connection configurations, and driver behavior may cause the query to appear much faster in one client compared to another, even when running on the same host.
Check the following with SQL to diagnose the performance difference:
-- Session variables comparison:
SHOW VARIABLES WHERE Variable_name IN ( 'max_allowed_packet', 'net_buffer_length', 'group_concat_max_len', 'tmp_table_size', 'max_heap_table_size', 'optimizer_switch' );
-- Current settings per session:
SHOW SESSION VARIABLES LIKE 'sql_mode';
SHOW SESSION VARIABLES LIKE 'autocommit';
SHOW SESSION VARIABLES LIKE 'wait_timeout';
-- Query cache status:
SHOW STATUS LIKE 'Qcache%';
--Check InnoDB buffer pool usage:
SHOW STATUS LIKE 'Innodb_buffer_pool%';
-- Verify index usage on the alerts table:
EXPLAIN SELECT * FROM alerts WHERE account_id = 1000000000 LIMIT 10;
Compare query plans using EXPLAIN ANALYZE for slow and fast runs by other MySQL GUI like dbForge:
Subscribe to my newsletter
Read articles from Gabriella Barajas directly inside your inbox. Subscribe to the newsletter, and don't miss out.
Written by
Gabriella Barajas
Gabriella Barajas
A database Q&A blog for those who’d rather debug queries than read documentation. Practical answers to real questions — mostly SQL Server and MySQL, with a pinch of sarcasm and a love for clean code.