Introduction to Geospatial Technology: A Beginner’s Technical Guide
 Aishwarya
Table of contents
- Introduction to Geospatial Technology
- 🧭 What Is Geospatial Technology?
- 🧱 What Is a Geographic Information System (GIS)?
- 💡 Real-World Applications of GIS
- 🌐 Understanding the Earth’s Surface: Geoid, Ellipsoid, and Datum
- 🗺️ Map Projections: Flattening the Globe
- 🔢 Coordinate Systems
- 📊 Geographic Data Models
- 🛰️ Remote Sensing and Satellite Data
- 🛠️ Tools for Geospatial Analysis
- 📌 Real-World Project Preview: Tam Dao National Park
- 📚 Conclusion
- References:

Introduction to Geospatial Technology
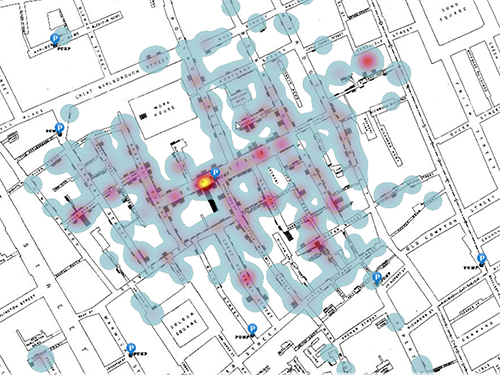
In 1854, London was struck by a significant cholera outbreak that killed over 600 people within weeks. While many physicians speculated wildly about its causes—ranging from miasma (bad air) to divine punishment—it was physician John Snow who mapped the outbreak, pinpointed clusters, and traced the source to a contaminated water pump on Broad Street.
This moment marked one of the earliest known applications of spatial analysis, now a key function of Geospatial Technology.
🧭 What Is Geospatial Technology?
Geospatial technology refers to the tools and methods used to collect, visualize, analyze, and interpret data related to Earth’s surface. This includes:
GIS (Geographic Information Systems)
GPS (Global Positioning Systems)
Remote Sensing
Cartography & Geodesy
Spatial Databases
These technologies allow governments, businesses, and scientists to make location-based decisions, whether it’s managing forests, planning cities, or responding to natural disasters.
🧱 What Is a Geographic Information System (GIS)?
A Geographic Information System (GIS) is a software framework for capturing, storing, analyzing, and visualizing spatial and geographic data.
GIS allows users to answer location-related questions like:
Where is something located?
What exists around it?
What has changed over time?
🧩 The Three Core Components of GIS:
Geographic Data – Vector (points, lines, polygons), Raster (imagery, elevation)
Hardware & Software – Computers, GPS receivers, QGIS, ArcGIS, etc.
Human Expertise – Knowledge to ask the right questions and interpret results
💡 Real-World Applications of GIS
GIS is used in virtually every industry:
Urban Planning: Land zoning, transportation networks
Emergency Management: Disaster response, evacuation routes
Environmental Monitoring: Deforestation, habitat loss
Military & Intelligence: Surveillance, strategic planning
Logistics: Taxi fleets, supply chain optimization
Media & Entertainment: Map-based storytelling (e.g., American Manhunt: Osama Bin Laden)
As seen in my previous articles, even Hollywood uses GIS principles to create realistic flight simulations in movies like Top Gun: Maverick.
🌐 Understanding the Earth’s Surface: Geoid, Ellipsoid, and Datum
Before working with spatial data, we need to model the Earth mathematically. But Earth isn’t a perfect sphere—it’s bumpy, rotating, and irregular. So we simplify it using:
📉 Geoid
A model of mean sea level, considering Earth’s gravity variations.
Used in vertical measurements (e.g., elevation).
Looks like a wavy potato-shaped surface.
🪐 Ellipsoid
A smooth, mathematically defined surface approximating the Earth’s shape.
Used in horizontal positioning.
Examples: WGS84, GRS80
📌 Datum
Defines the relationship between a geoid and an ellipsoid.
Includes both horizontal (X/Y) and vertical (Z) reference systems.
Examples: NAD83, WGS84 (EPSG:4326)
Flattening equation = (a-b)/a
a = semi-major (equatorial) axis
b = semi-minor (polar) axis

🗺️ Map Projections: Flattening the Globe
Since maps are flat, but Earth is elliptical, we need map projections to convert 3D space into 2D. This introduces distortion in area, shape, distance, or direction.
Common projections:
Plane (Azimuthal)
Cone (Conic)
Cylinder (Cylindrical) – e.g., Mercator, UTM
🔢 Coordinate Systems
Coordinate systems allow us to pinpoint any location on Earth using numbers.
📌 Cartesian Coordinate System
Uses X, Y, and Z axes
Common in engineering, 3D modeling
🌍 Geographic Coordinate System (GCS)
Uses latitude and longitude (spherical)
Reference: WGS84 (used in GPS)
📦 Projected Coordinate Systems
Converts the sphere to a plane
Example: UTM (Universal Transverse Mercator) divides Earth into zones
🗺️ MGRS (Military Grid Reference System)
Combines UTM and military notation
Breaks UTM zones into 100 km² grids
Used for field navigation and military operations
📊 Geographic Data Models
Spatial data can be structured in two primary models:
1. Vector Model
Represents discrete features: points, lines, and polygons
Examples: cities (points), roads (lines), lakes (polygons)
Stored as:
Spaghetti Model: Raw, unconnected geometries
Topological Model: Includes spatial relationships (e.g., shared borders, adjacency)
2. Raster Model
Represents continuous data as a grid of pixels
Examples: elevation, temperature, satellite imagery
Each cell holds a single value (e.g., NDVI, elevation in meters)
🛰️ Remote Sensing and Satellite Data
Remote sensing is the science of gathering information from a distance—typically from satellites or drones.
Key concepts:
Spectral Bands: Different wavelengths of light (e.g., near-infrared for vegetation)
NDVI: A vegetation index derived from Red and NIR bands
DEM (Digital Elevation Models): Rasters showing terrain height
Common data sources:
Sentinel-2 (ESA): High-res multispectral imagery
Landsat 8 (NASA/USGS): Great for environmental change
SRTM/ASTER: Elevation data
🛠️ Tools for Geospatial Analysis
🔧 QGIS
Free and open-source GIS software
Supports spatial joins, raster analysis, terrain modeling
Plugins like SCP for remote sensing, and DB Manager for databases
📊 R for Spatial Analysis
R has a rich ecosystem for geospatial work:
| Task | Package |
| Vector Data | sf, sp |
| Raster Data | terra, raster |
| Mapping | tmap, ggplot2, leaflet |
| Spatial Stats | spdep, gstat |
| Interactivity | mapview, shiny |
📌 Real-World Project Preview: Tam Dao National Park
To solidify these concepts, we’ll walk through a case study using Tam Dao National Park in Vietnam. You can find this course on Udemy, ‘Become Proficient In Spatial Data Analysis Using R & QGIS By Working On A Real Project - Get A Job In Spatial Data!’
Using QGIS and R, we’ll:
Apply what you’ve learned about vector and raster data, coordinate systems, and spatial relationships using real data.
Perform spatial analysis using both QGIS (a free, open-source GIS application) and R (a powerful statistical language with spatial packages).
Learn the types of questions spatial analysis can answer, and how these insights can influence environmental and terrain planning.
Stay tuned for the step-by-step guide in the next part of this series.
📚 Conclusion
Geospatial technology blends geography, data science, and computer modeling into a powerful toolkit for solving real-world problems.
By understanding foundational terms like geoid, datum, vector vs raster, and coordinate systems, you’re now equipped to take the next step: start working with real data using tools like QGIS and R.
💌 Interested in Geospatial Tech?
If this post helped you grasp the basics of GIS and spatial analysis, follow me here on Hashnode.
I share beginner-friendly tutorials, real-world use cases, and tips from my journey learning tools like QGIS and R—all grounded in practical geospatial applications.
Let’s explore and map the world together 🌍🛰️
~ Aishwarya
References:
1) GIS: The Geographic Language of Our Age 2nd Edition
by Anders C. Haavik-Nilsen (Editor), Knut Grinderud (Editor)
2) ‘Become Proficient In Spatial Data Analysis Using R & QGIS By Working On A Real Project - Get A Job In Spatial Data!’ - Udemy Course by Minerva Singh
**Disclaimer: The ideas and research presented in this article are my own. I used ChatGPT to help structure, clarify, and format the content to make it more accessible and understandable for readers.
Subscribe to my newsletter
Read articles from Aishwarya directly inside your inbox. Subscribe to the newsletter, and don't miss out.
Written by
Aishwarya
Aishwarya
Hey there! I’m Aishwarya — part engineer, part educator, part explorer. Also: geospatial specialist, ex-data engineer, and Developer Relations Lead at WomenDevsSG. From Python scripts to satellite maps—I turn data into stories and workflows into impact. Currently sharing, mentoring, and building in public. 🚀 Stick around for hands-on posts on automation, cloud, spatial data, and scaling knowledge through code. Let’s learn and grow together!