Getting Started with Prometheus on Azure AKS
 Poonam Parate
In today's cloud-native world, observability is crucial. As applications grow with microservices and containers, it's hard to understand system health and performance. This is where Prometheus, a powerful open-source monitoring and alerting toolkit, helps.
What is Prometheus?
Prometheus is an open-source systems monitoring and alerting toolkit, originally built at SoundCloud and now a CNCF graduated project. It is widely used to monitor Kubernetes clusters, applications, infrastructure, and more.
Prometheus collects metrics as time series data, stores them locally, and lets you query this data with a powerful query language called PromQL.
How does Prometheus work?
Prometheus primarily uses a pull model. It periodically scrapes metrics from configured HTTP endpoints (targets) that expose metrics in a simple text format (usually at /metrics).
For example, a Node Exporter running on a VM exposes system metrics, and Prometheus scrapes them.
It then stores this data in its time-series database, allowing you to run historical analysis and real-time queries.
Prometheus also supports push, indirectly, via the Pushgateway for short-lived jobs.
Prometheus Architecture & Components
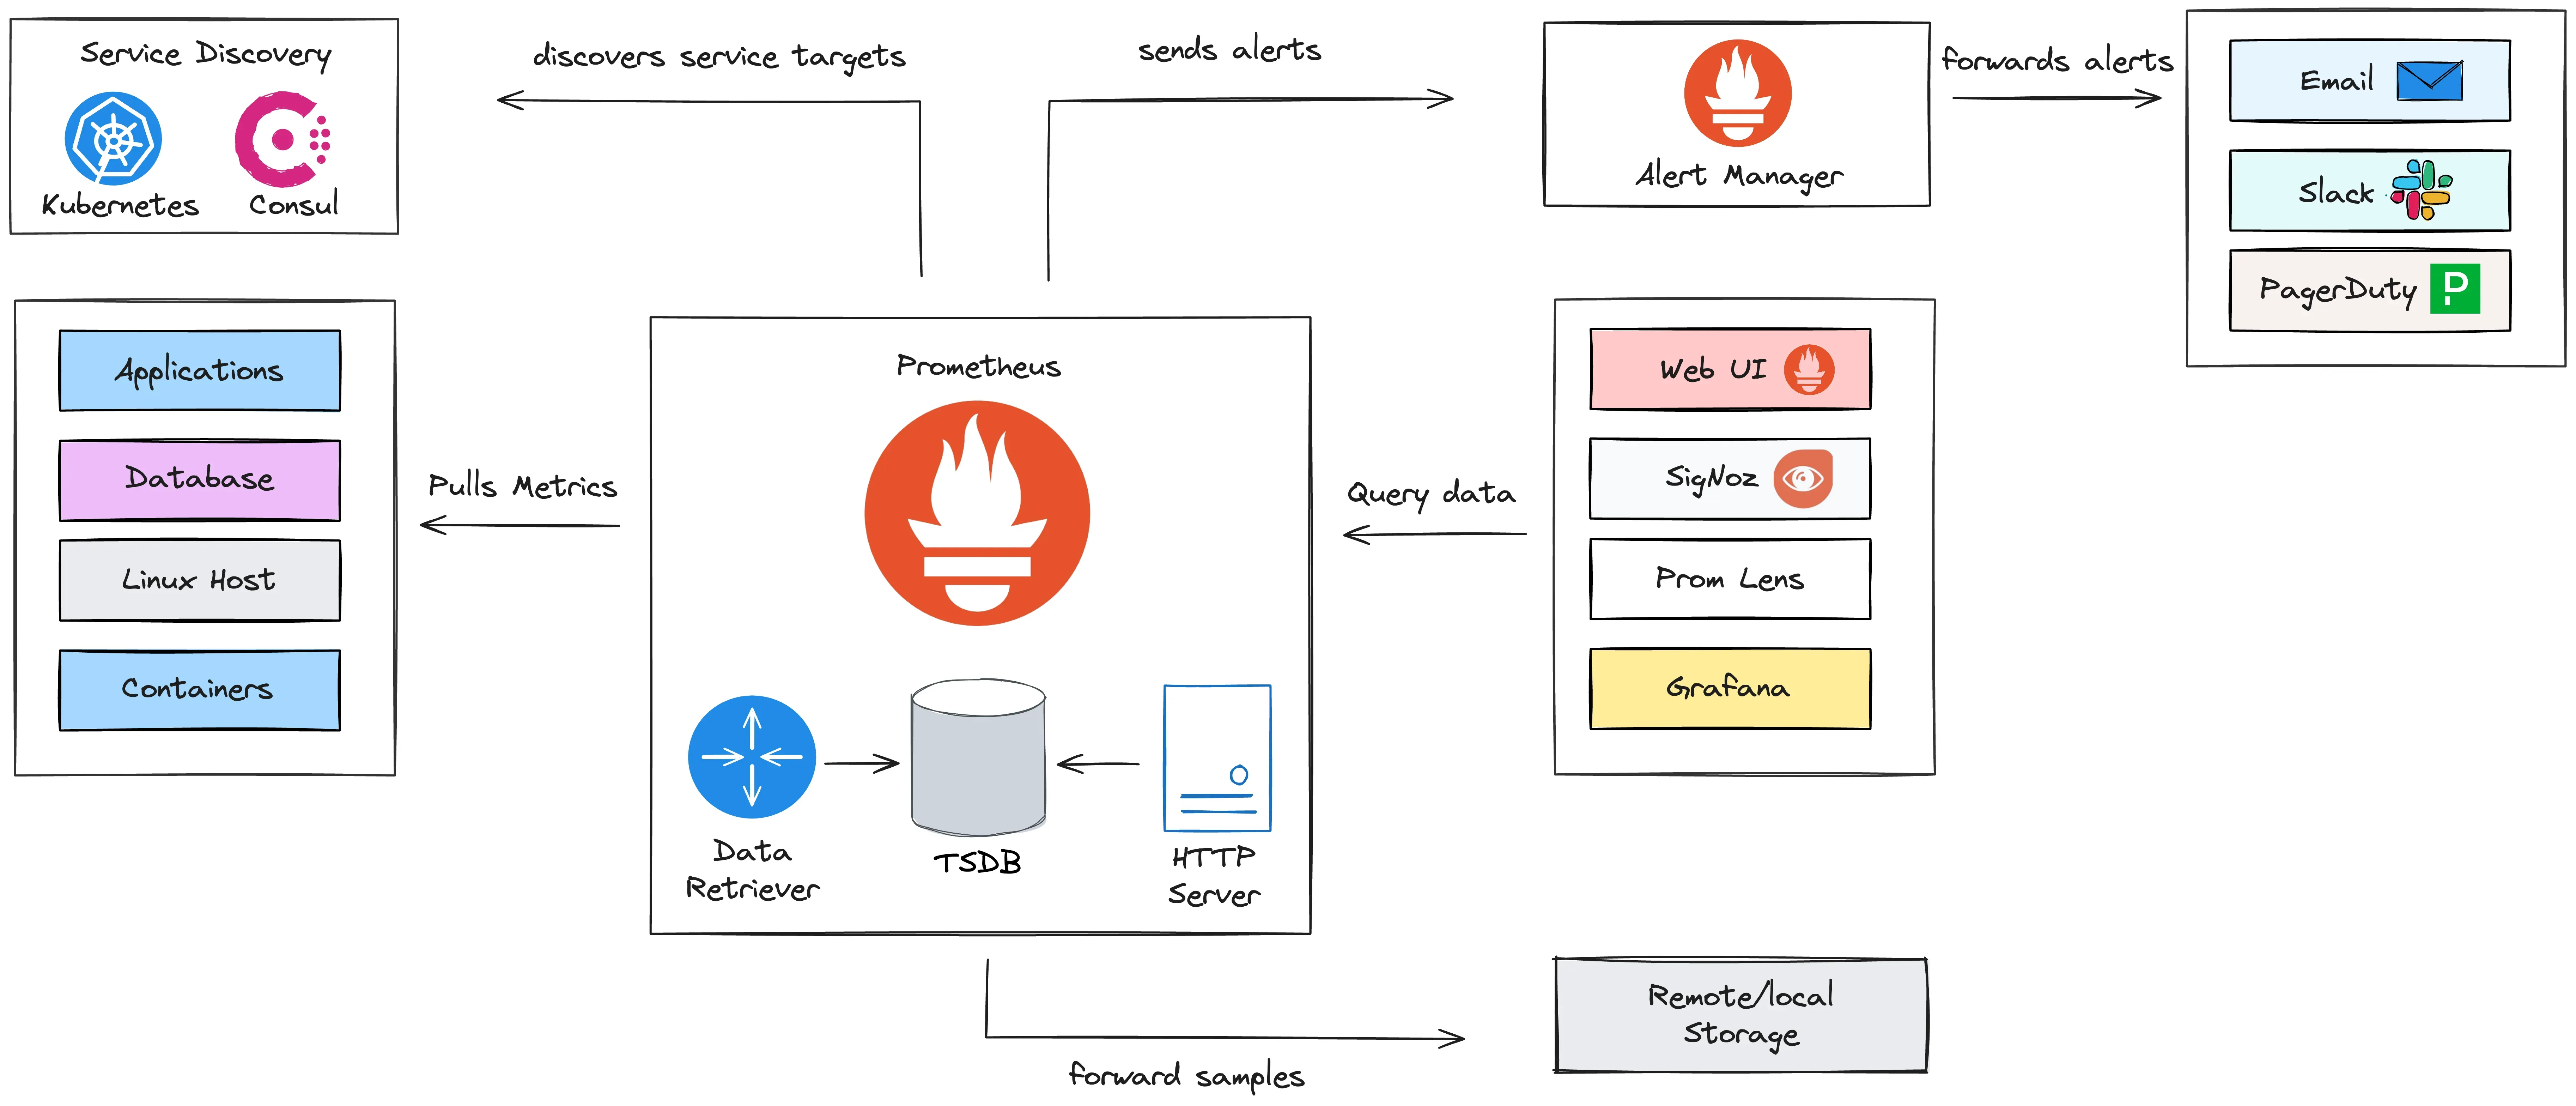
1. Prometheus Server
The core component of Prometheus.
Responsible for scraping metrics data from configured targets at given intervals.
Stores the scraped time-series data locally.
Executes PromQL queries to aggregate and retrieve data.
Evaluates alerting rules and forwards alerts to Alertmanager.
2. Pushgateway
Used when short-lived jobs (like batch jobs or cron jobs) need to expose metrics.
Since Prometheus normally pulls data, these jobs instead push metrics to the Pushgateway.
Prometheus then scrapes metrics from the Pushgateway.
3. Alertmanager
Handles alerts sent by the Prometheus server.
Manages deduplication, grouping, silencing, and inhibition of alerts.
Routes notifications to email, Slack, PagerDuty, OpsGenie, or other channels.
4. Prometheus Targets
The endpoints that Prometheus scrapes metrics from.
Typically expose metrics on HTTP endpoints like
/metrics.Examples: Node Exporter on a VM, a web app instrumented with Prometheus client libraries.
5. Client Libraries
Libraries for instrumenting your code to expose metrics.
Available for languages like Go, Java, Python, Ruby, .NET, and more.
Help you create custom application metrics (counters, gauges, histograms, summaries).
6. Prometheus Exporters
Tools that translate metrics from other systems into Prometheus format.
Examples:
Node Exporter: Exposes hardware & OS metrics.
Blackbox Exporter: Probes endpoints over HTTP, DNS, TCP, etc.
MySQL Exporter, Kafka Exporter, etc. for various technologies.
7. Service Discovery
Prometheus can automatically discover targets using service discovery integrations.
Supported platforms: Kubernetes, Consul, EC2, Azure, GCP, etc.
Ensures dynamic environments like Kubernetes are monitored without manual configuration.
Azure Managed Prometheus with AKS
Azure provides a fully managed Prometheus service via Azure Monitor, which reduces operational overhead. It integrates natively with AKS.
Why use Azure Managed Prometheus?
No need to install, upgrade, or scale Prometheus manually.
Azure manages storage and high availability.
Integrated with Azure Monitor and security (RBAC, workspaces).
How to set up Azure Managed Prometheus on AKS
Prerequisites
AKS cluster running
kubectl&azCLI installed and configured
Enable Monitoring
You can enable managed Prometheus directly when creating the AKS cluster or on an existing cluster.
bashCopyEditaz aks update -n <cluster-name> -g <resource-group> \
  --enable-managed-prometheus --enable-azure-monitor-metrics
Install Prometheus scraping rules
If your workloads expose metrics on /metrics, you can set up monitoring annotations.
For example, add these annotations to your Deployment or Pod:
yamlCopyEditannotations:
  prometheus.io/scrape: "true"
  prometheus.io/path: /metrics
  prometheus.io/port: "8080"
Verify metrics scraping
Use:
bashCopyEditkubectl get pods -n kube-system -l app.kubernetes.io/component=prometheus
Check that Prometheus pods are running.
Connect Prometheus to Grafana
Azure also provides a managed Grafana service. Or, you can use an external Grafana instance.
To connect:
In Azure Portal → navigate to your Managed Grafana instance → Data Sources → Add Prometheus.
For URL, use:
arduinoCopyEdithttps://prometheus.monitor.azure.com
Azure handles authentication behind the scenes. If using API tokens or service principals, configure them as per your access level.
- Once added, build dashboards using PromQL queries.
Conclusion
Prometheus gives you robust monitoring and alerting for modern cloud-native systems. Using Azure Managed Prometheus with AKS:
Saves time on installation, scaling, and maintenance.
Gives a seamless experience with Azure Monitor and Managed Grafana.
This lets your team focus on building applications, while Azure ensures your monitoring stack is secure, scalable, and always up.
Subscribe to my newsletter
Read articles from Poonam Parate directly inside your inbox. Subscribe to the newsletter, and don't miss out.
Written by
Poonam Parate
Poonam Parate
DevOps Engineer