Measuring LCP & Latency — Where’s My React App Slow?
 Himanshu Kumar Gola
Table of contents

TL;DR: If your React app feels slow, two key metrics to check are Latency and Largest Contentful Paint (LCP). In this post, I’ll show you how to measure them using tools like Lighthouse, Chrome DevTools, and GTmetrix.
As developers, we love to create software with our ideas that come to mind. That's how we work, right? Many times, we focus so much on optimising code : using the best algorithms, scalable libraries, or modern technologies, that we forget something critical: actual runtime performance.
Have you ever wondered, despite doing so much, your website is loads slow, it takes seconds as compared to others, which took a few milliseconds.
When I notice that a lot of questions came into my head, such as:
Do they do something extraordinary?
Do they know more than I?
Do they use some advanced techniques or libraries?
Then I researched it with my portfolio website and came up with two major issues: Latency and LCP. What are they? Let me explain to you:
Latency -: It’s the time a website takes for a user’s action (like clicking a link) to result in a response (like the server starting to send data).
Think of it as:
How long do I wait before the website starts responding after I do something?
Types of latency in web:
Network latency – Time taken for data to travel from browser to server and back.
Server latency – Time taken the server takes to process and respond.
Input latency – Delay between a user’s interaction and the browser’s response.
LCP (Largest Contentful Paint) -: LCP measures the time it takes for the largest visible element (like an image or text block) to appear on the screen after a page starts loading.
In simple words:
How fast can the user see the main content of the page? It reflects how quickly the user feels the page is useful, not just loaded, but visually complete.
Now you have a question about how to measure this, right? Ideal LCP value:
Good: Less than 2.5 seconds
Needs Improvement: Between 2.5s and 4s
Poor: More than 4s
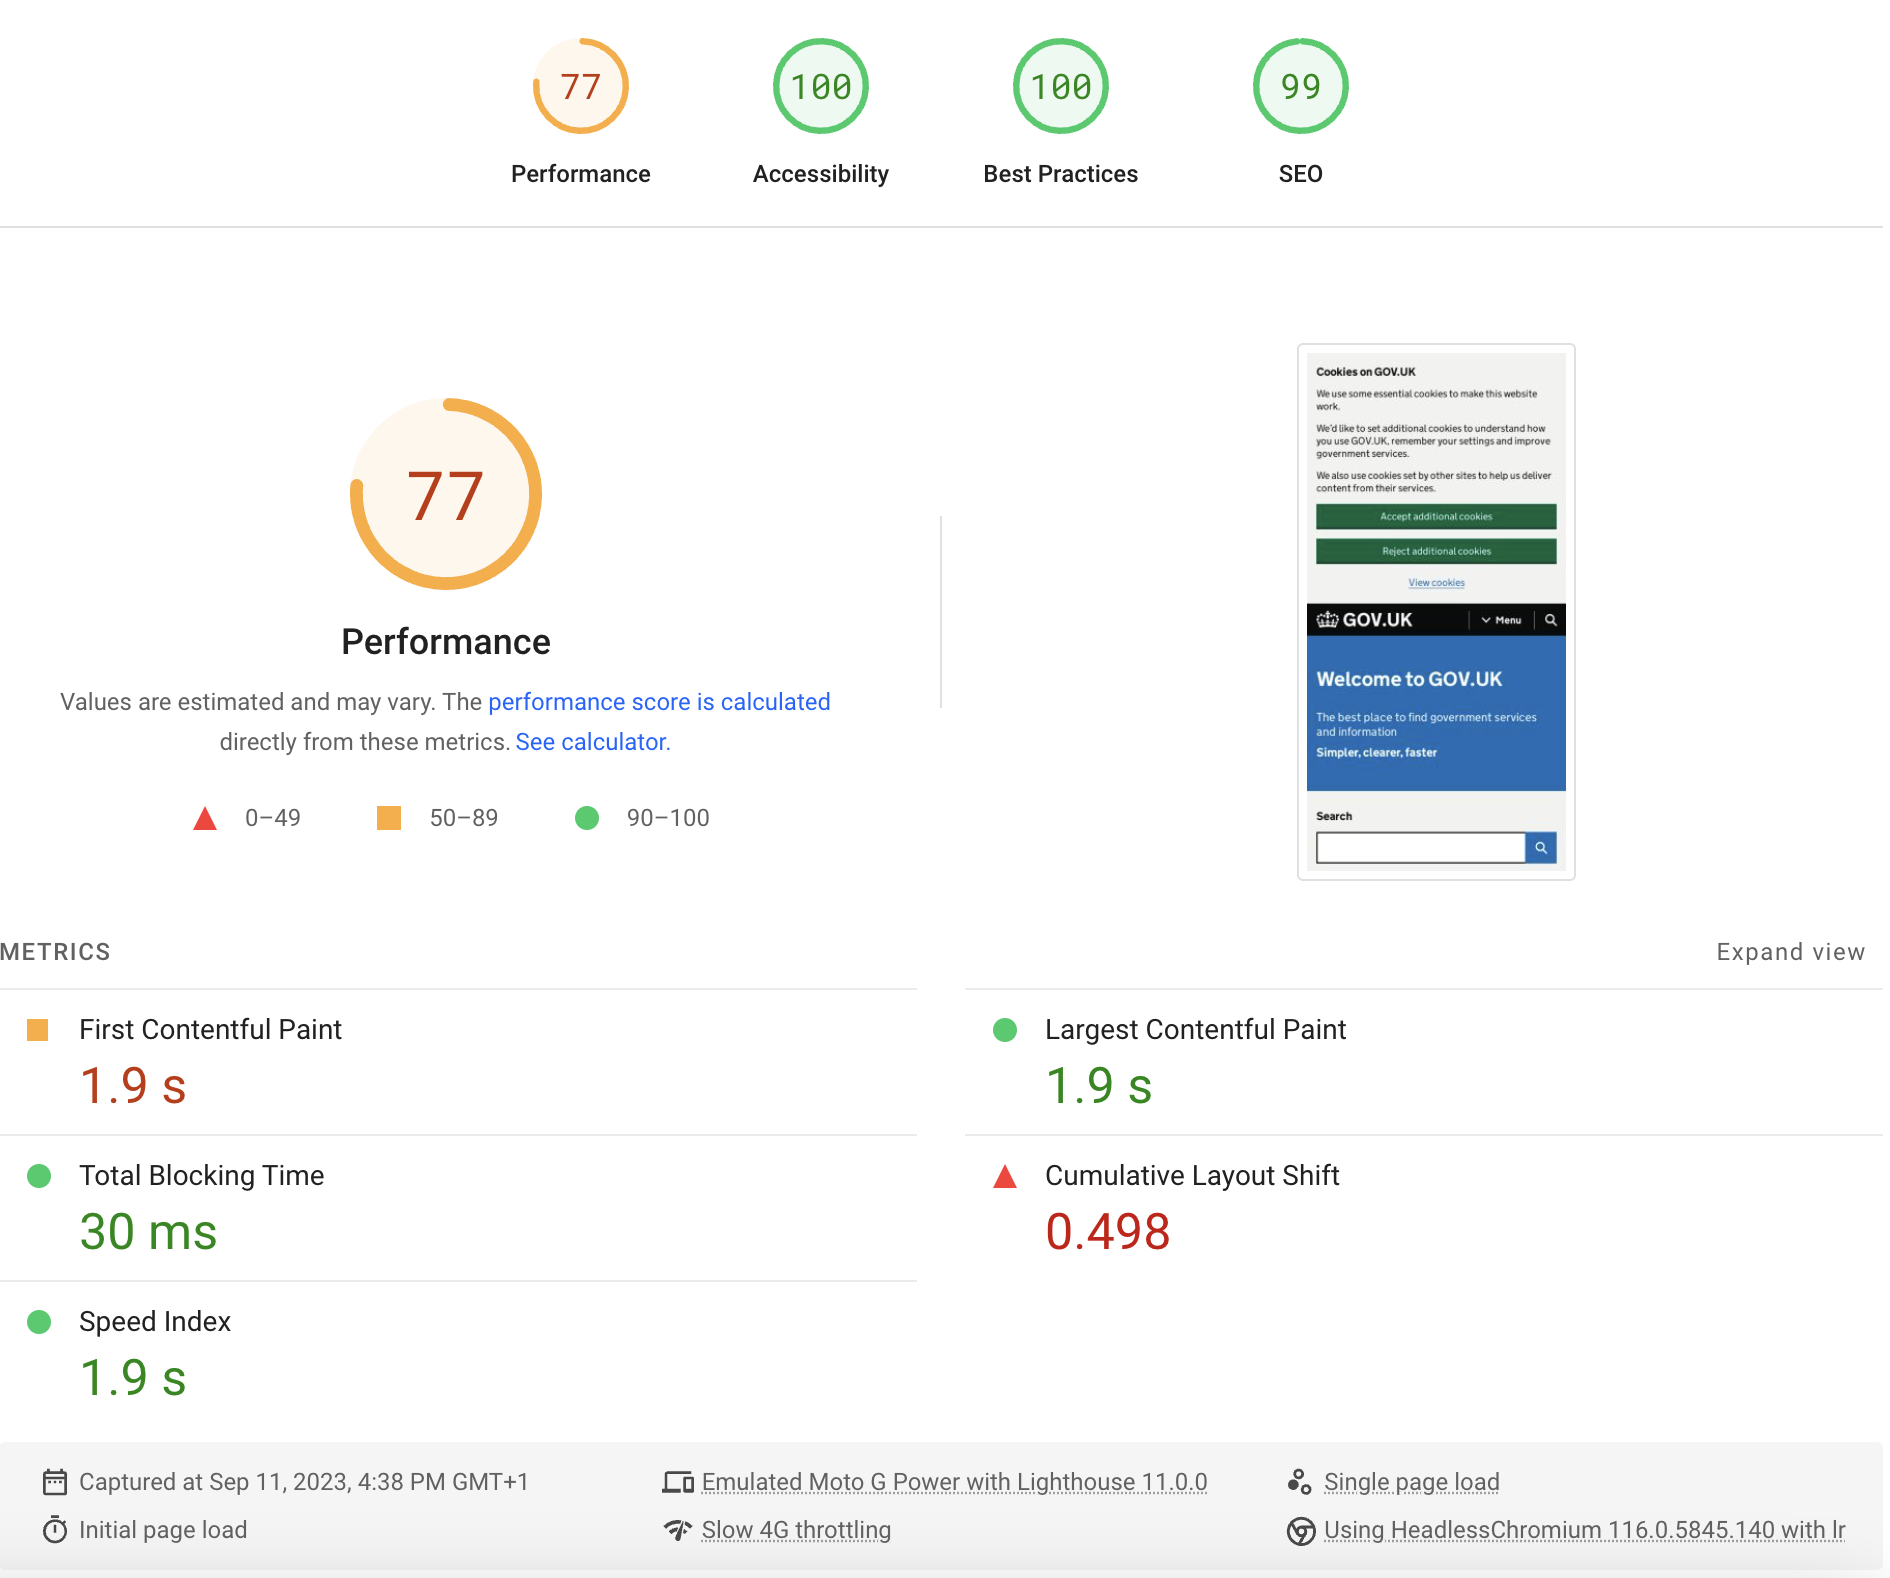
How to Measure Latency: 2. Lighthouse (in Chrome DevTools):
Open DevTools → Go to Lighthouse tab.
Run an audit (mobile/desktop).
You’ll get metrics like: - Time to First Byte (TTFB) (indicates server latency) - First Input Delay (FID) (interaction latency)
2. WebPageTest.org:
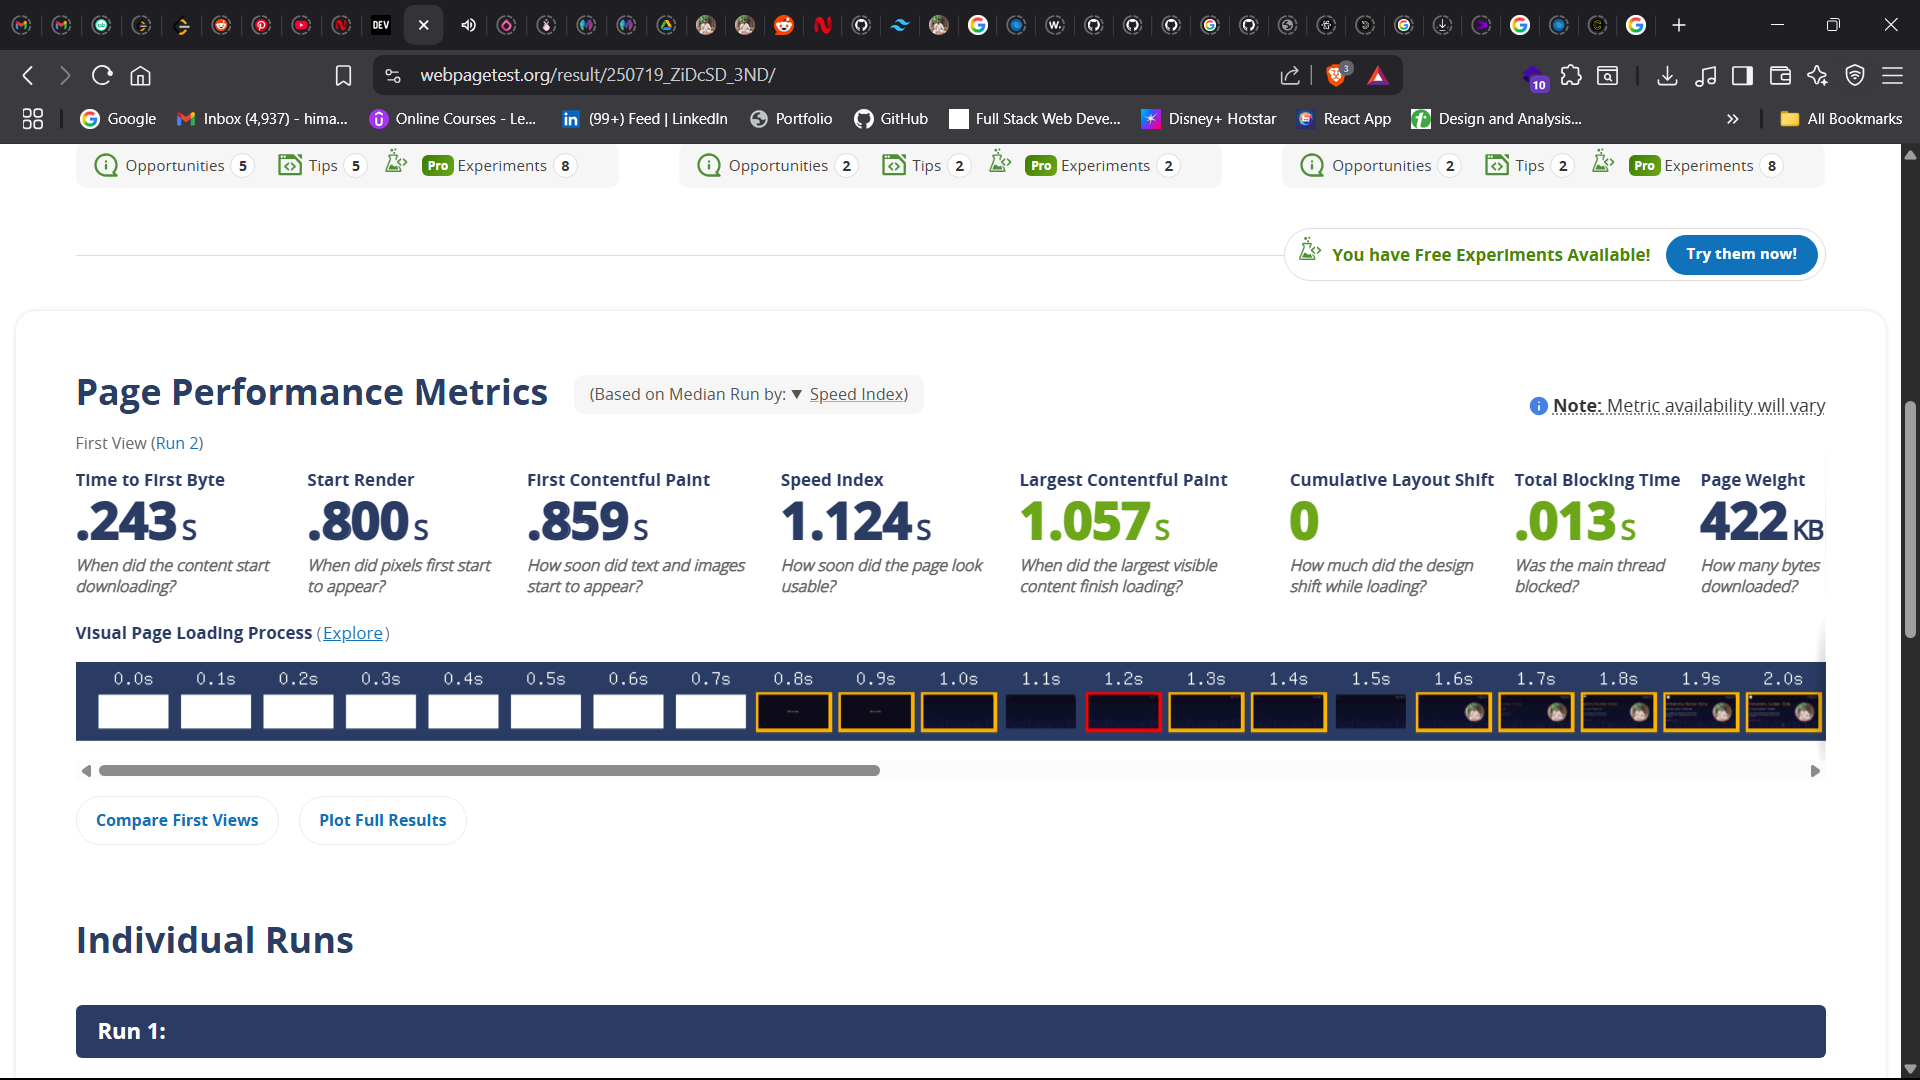
Enter your URL and run a test.
It will show detailed latency breakdowns, including TTFB, DNS time, and more.
How to Measure LCP (Largest Contentful Paint) :
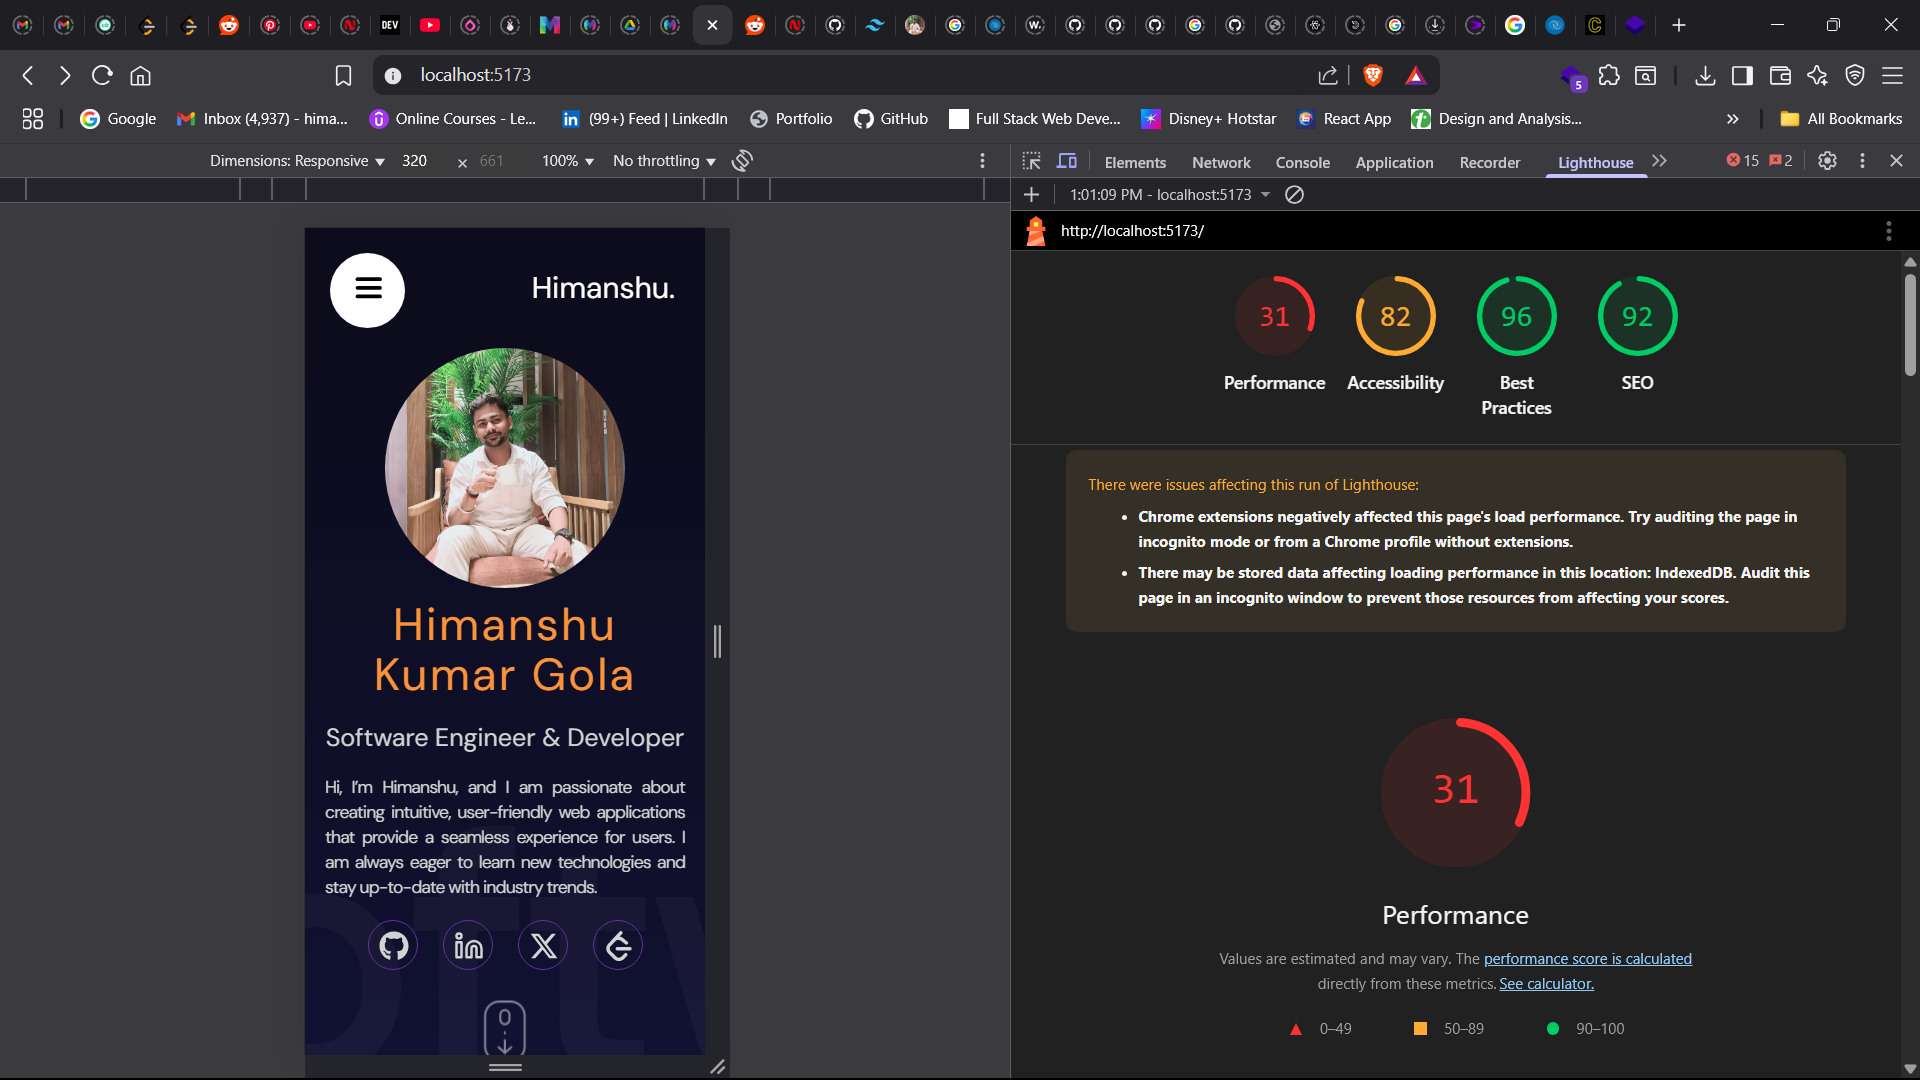
- Google Lighthouse (DevTools or PageSpeed Insights):
Open Chrome → DevTools → Lighthouse tab → Run audit. OR
Go to PageSpeed Insights
Enter your URL
You’ll get the LCP time and suggestions to improve it.
2.Chrome DevTools → Performance Tab:
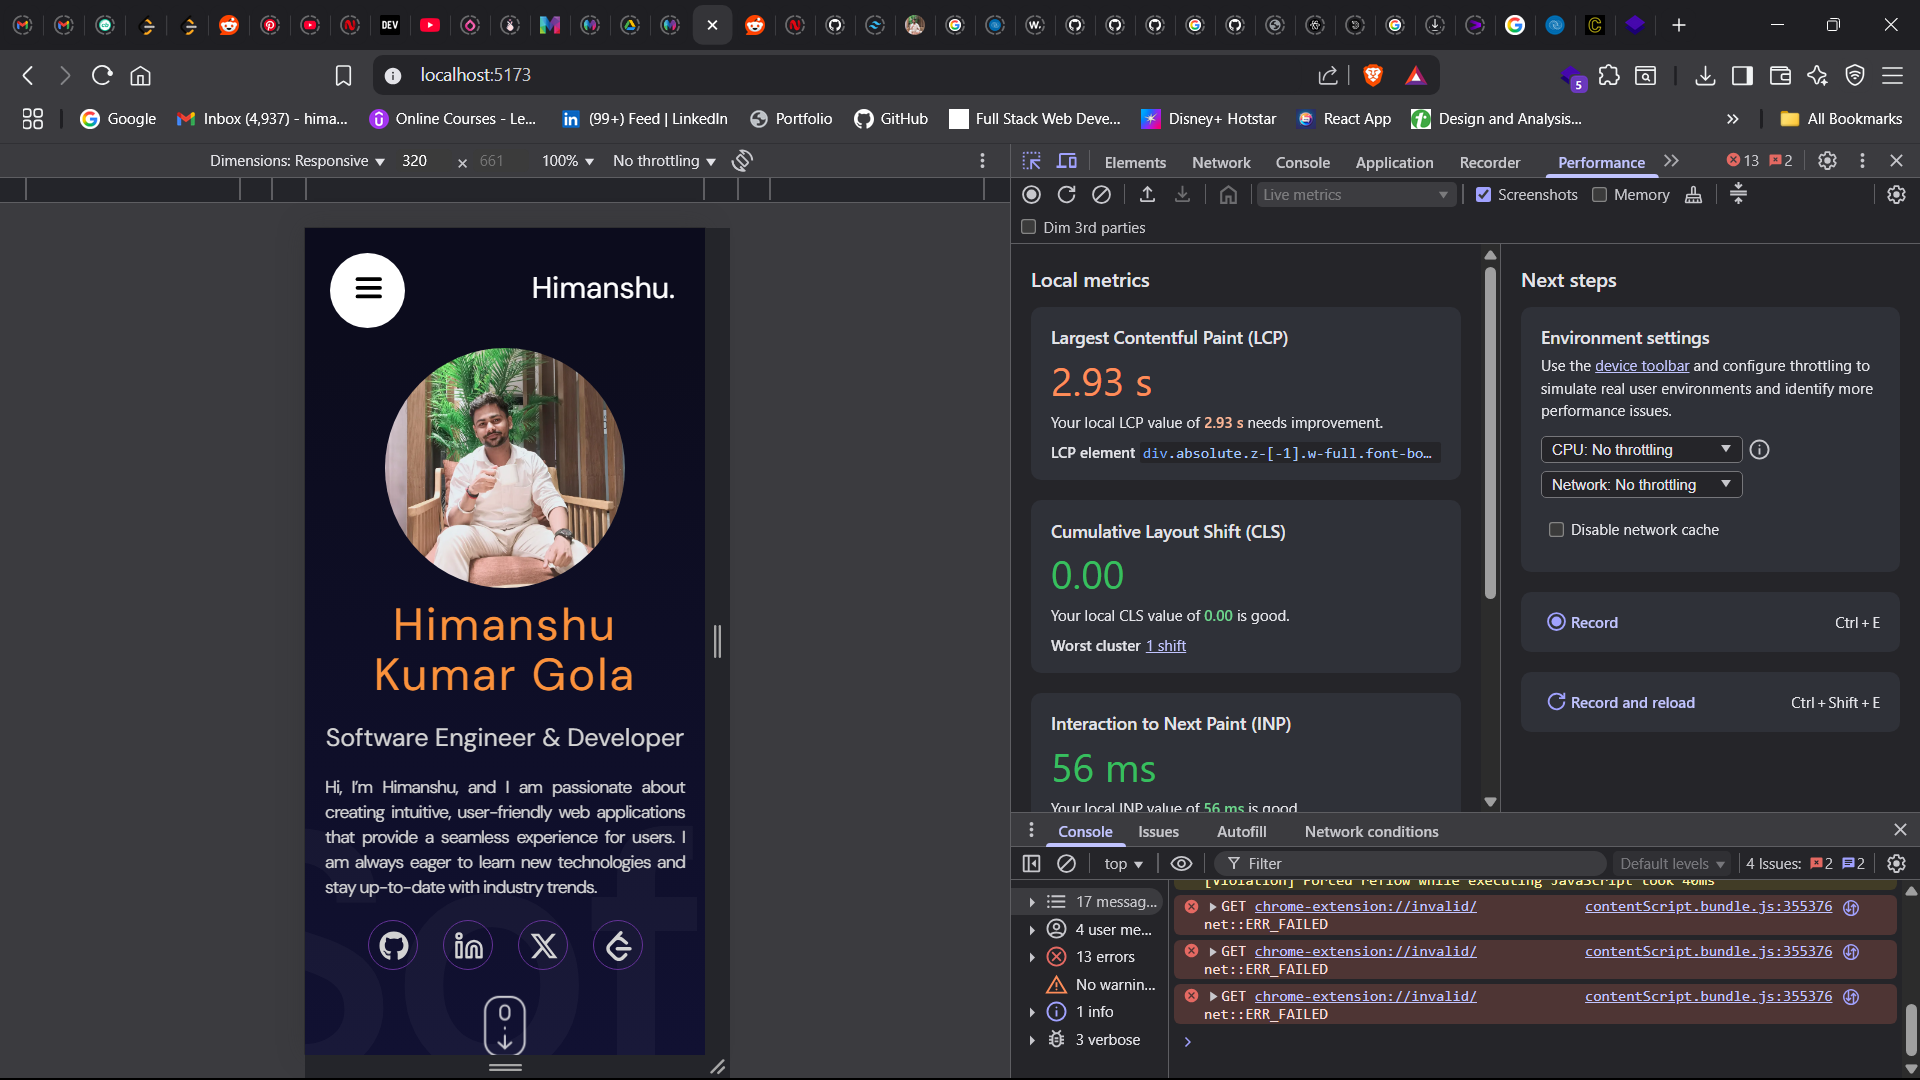
Open DevTools → Go to the Performance tab.
Click the Record button (top-left circle), then reload the page.
Stop recording after the page loads.
Hover over the LCP marker in the timeline to see what element was the LCP and how long it took.
If you don't want to do all this or Found this complex you can use a web tool called GTmetrix. GTmetrix is a great tool to measure both latency and LCP, along with many other web performance metrics. It’s beginner-friendly and free for basic use.
Steps -:
Go to GTmetrix.com
Enter your website URL in the input box.
Click on "Test your site" (you can create a free account to choose test location and browser).
Wait for the analysis to complete — takes 15–30 seconds.
What GTmetrix Shows: 1.Under the "Performance" tab:
LCP (Largest Contentful Paint):
Directly listed with a time (e.g., 1.8s)
Click on it to see what element caused the LCP.
- Under the "Timings" tab:
Time to First Byte (TTFB):
Indicates server latency
A high TTFB means your server is slow to respond.
Other useful timings: - First Contentful Paint (FCP) - DOMContentLoaded - Fully Loaded Time
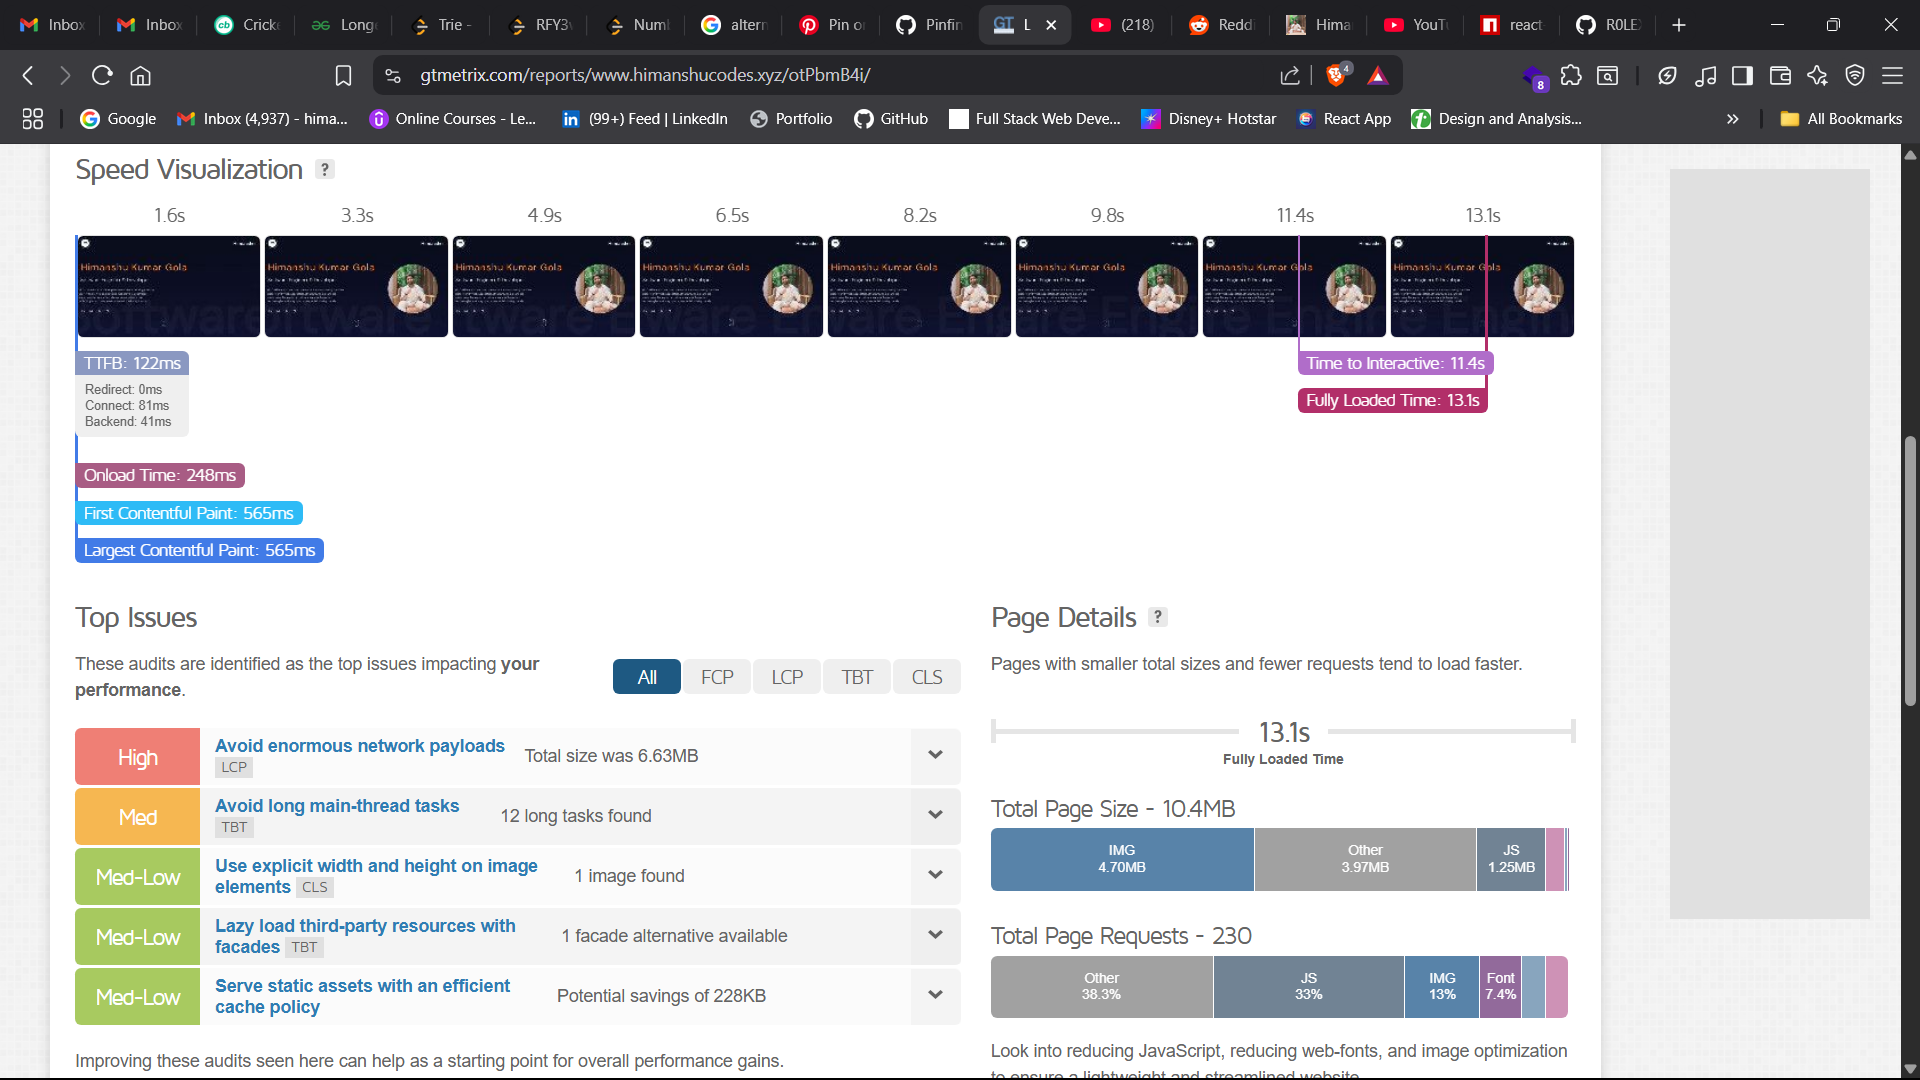
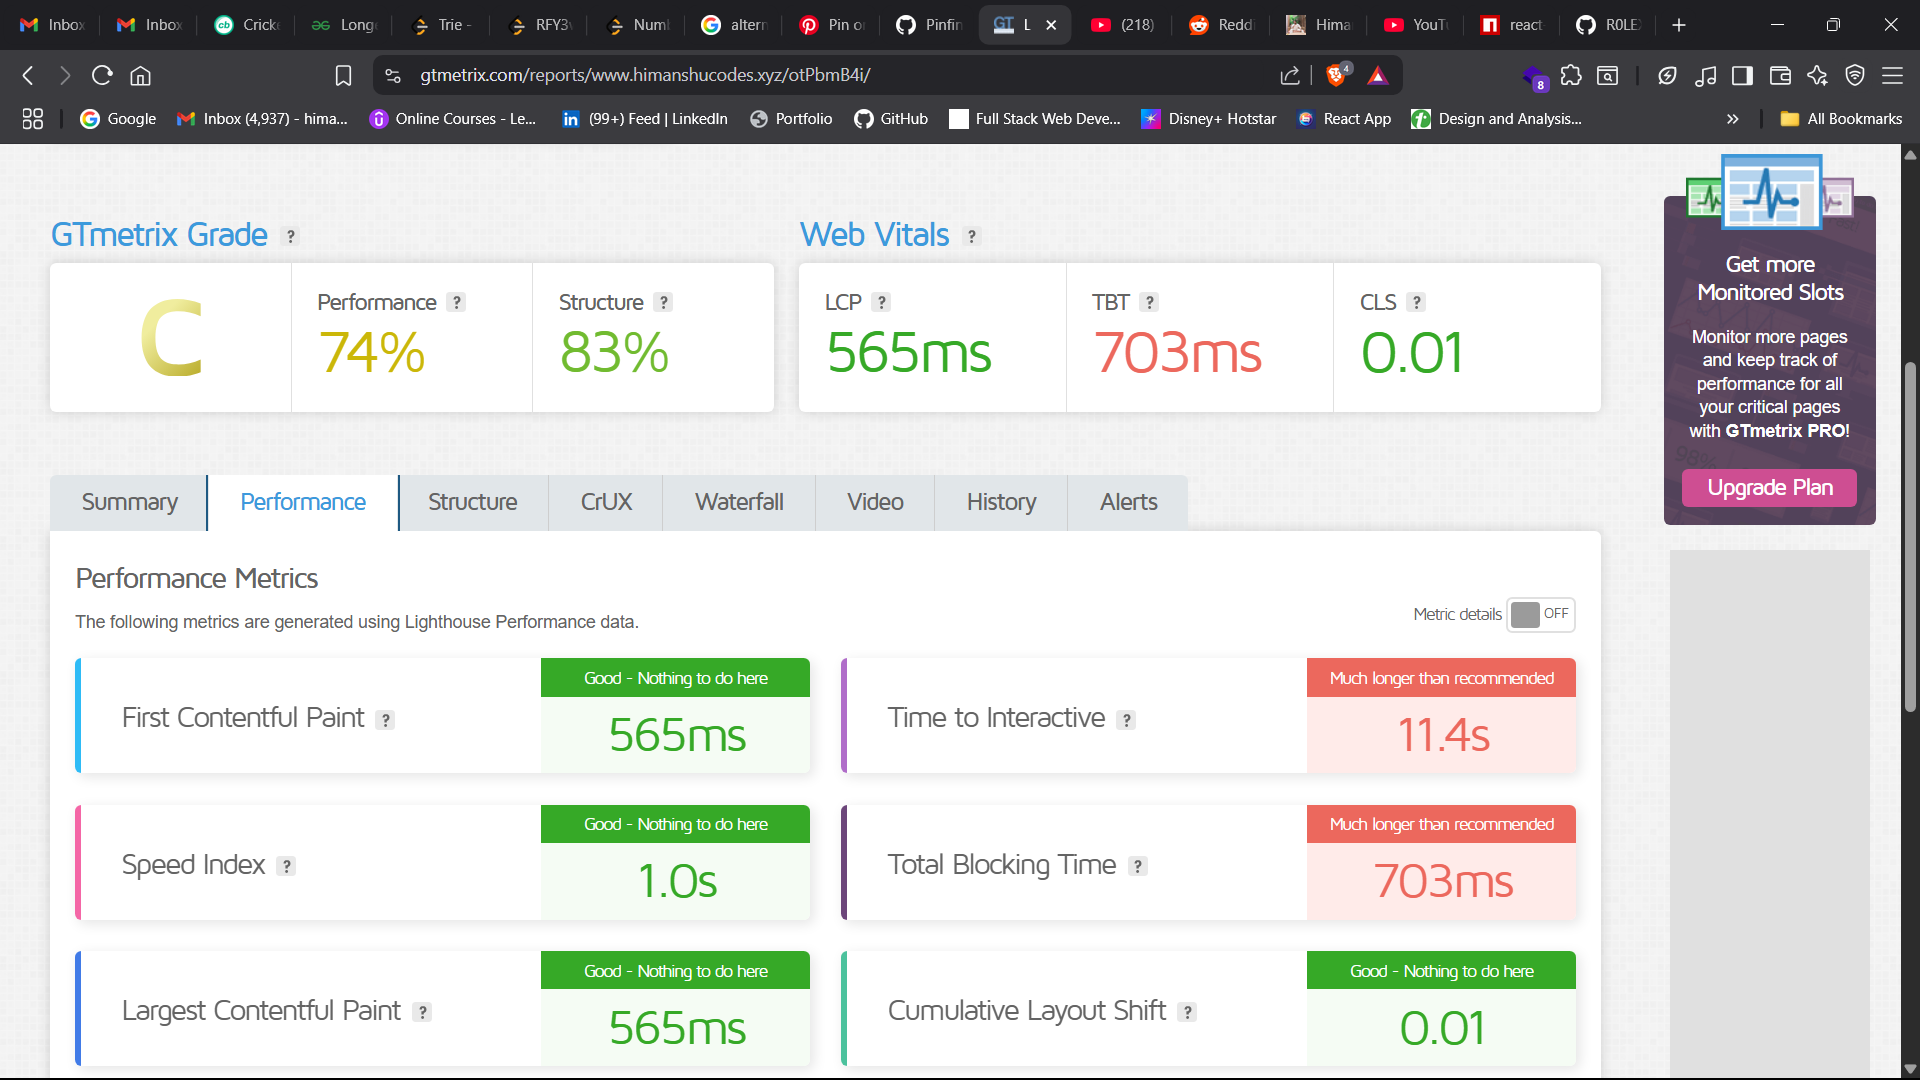
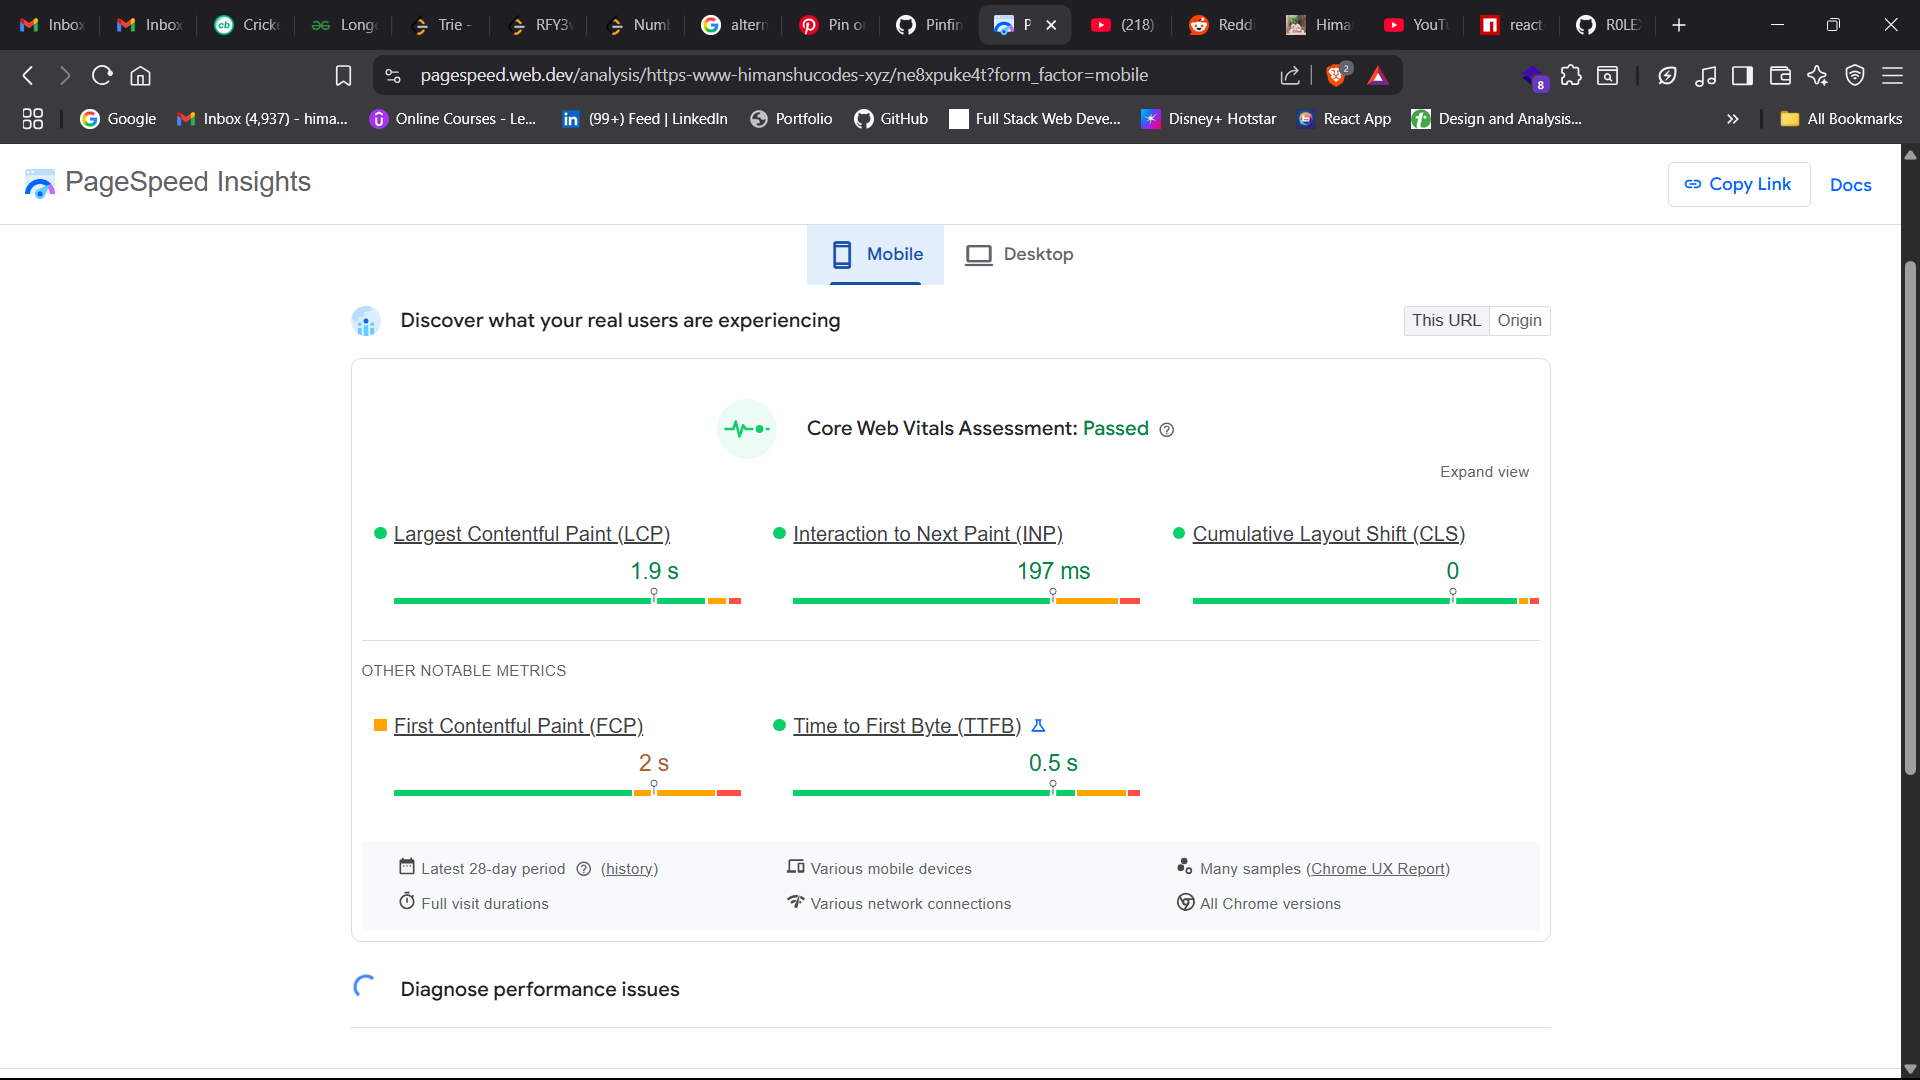
Fixing performance issues like Latency and LCP starts with one simple thing: knowing what’s slow and what the causes are. In this post, I shared how I investigated these two metrics in my React app and what tools helped me uncover the problems.
Whether you're working on a portfolio or a full-scale product, understanding how to measure performance is the first real step to improving it.
This was Part 1, where I focused on identifying the performance bottlenecks — specifically Latency and Largest Contentful Paint (LCP).
In Part 2, I’ll share the actual fixes that helped improve my metrics — from lazy loading, image optimization, to React-specific tweaks that made a real difference.
Stay tuned!
Subscribe to my newsletter
Read articles from Himanshu Kumar Gola directly inside your inbox. Subscribe to the newsletter, and don't miss out.
Written by
