The Ultimate Guide to Mastering Browser DevTools 🛠️
 AlgoAvengers 🚀
Welcome to your supercharged guide on DevTools—your all-in-one digital workbench built into every major browser! 🚀 Whether you're diving into web development or looking to perfect your debugging workflow, this comprehensive guide will energize your learning, sharpen your skills, and boost your confidence. Let’s unlock your DevTools superpowers together! 🌟
🚀 Quick Start: Security & Basics
DevTools is a safe, built-in browser feature designed for web development and debugging—never to compromise your security. Think phishing protection: never paste unknown code into the Console. Always understand what you're running! 🔒
DevTools attaches to specific browser tabs, letting you inspect and modify pages in real-time without affecting your source files (changes disappear on refresh unless you save them).
🏗️ How DevTools Works: Live, Not Source
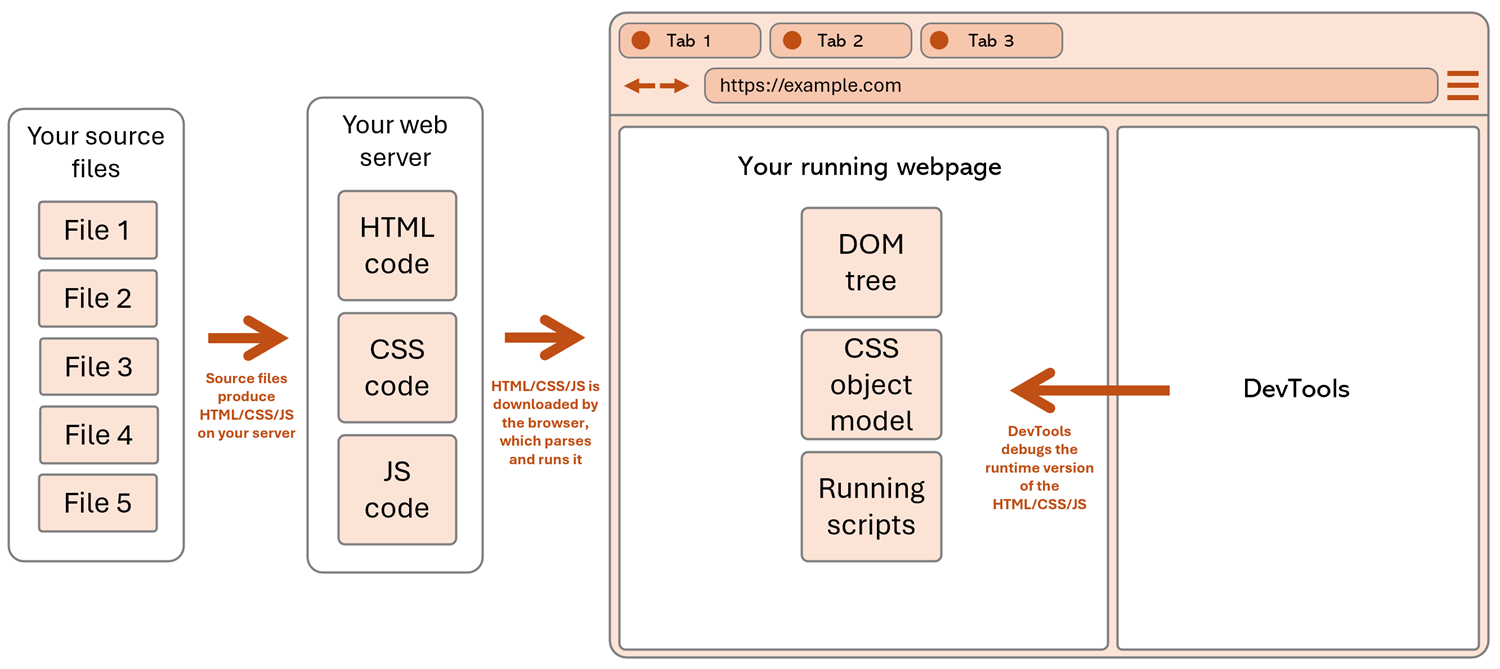
When you load a webpage, your browser transforms code into a dynamic runtime version (the DOM, updated styles, in-memory scripts). DevTools lets you edit this live version—not your original files.
🎨 Change styles live, instantly see visual changes.
🛠️ Edit content or run JavaScript for rapid experiments.
🔄 Temporary by default: Reload the page to undo all changes unless you update source files.
Pro tip: Chrome’s Workspaces or Overrides features can persist DevTools edits locally for advanced workflows.
🎨 Understanding the DevTools UI
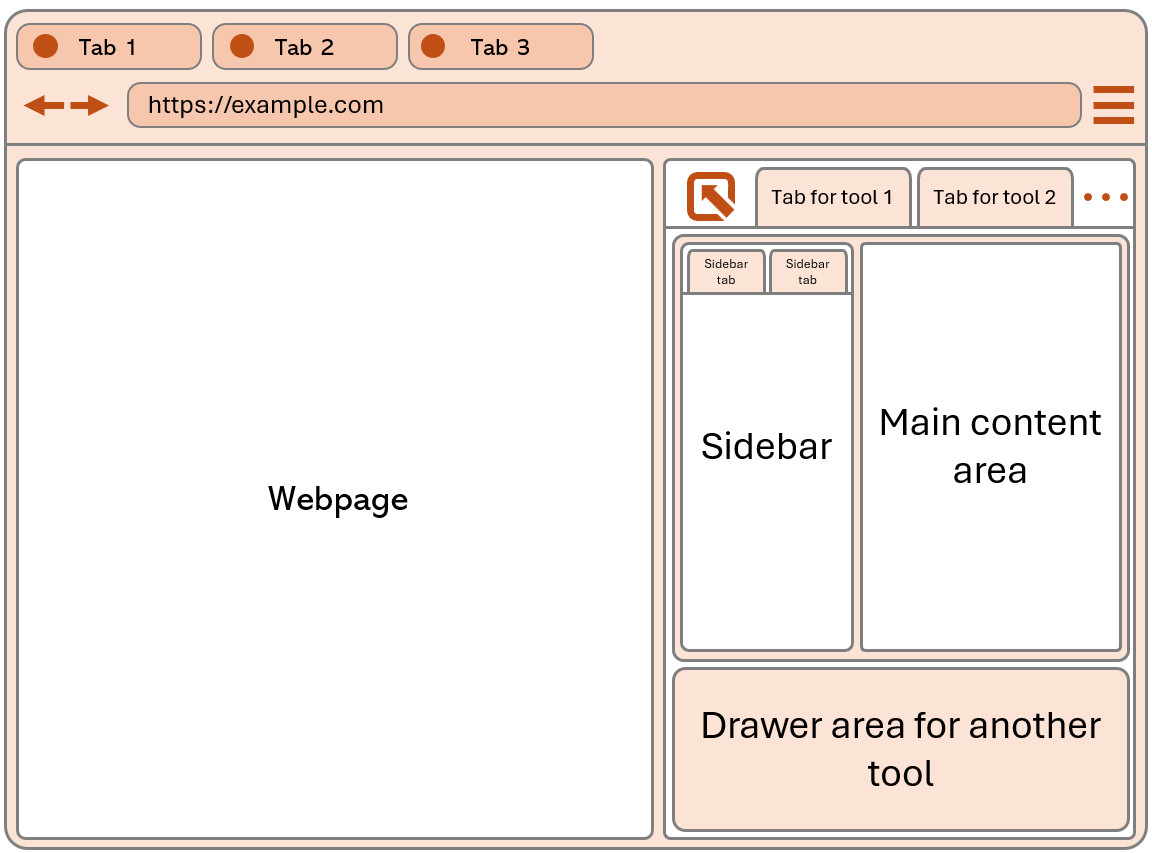
Key UI terms:
Toolbar: Switch between tools (e.g., Elements, Console, Network).
Tab/Panel: Each core feature like Elements or Network has its own dedicated panel.
Sidebar: Provides deeper, contextual settings or information within a selected panel.
Drawer: A collapsible area at the bottom that can host extra tools, most commonly the Console.
Layout: Dock DevTools right, bottom, or detach in a new window to fit your workflow!
🔄 The DevTools Workflow: Your Iterative Path to Perfection
Mastering DevTools isn't just about knowing each panel; it's about adopting an agile, iterative workflow that dramatically speeds up your development and debugging process. Think of it as a continuous cycle of discovery and refinement.
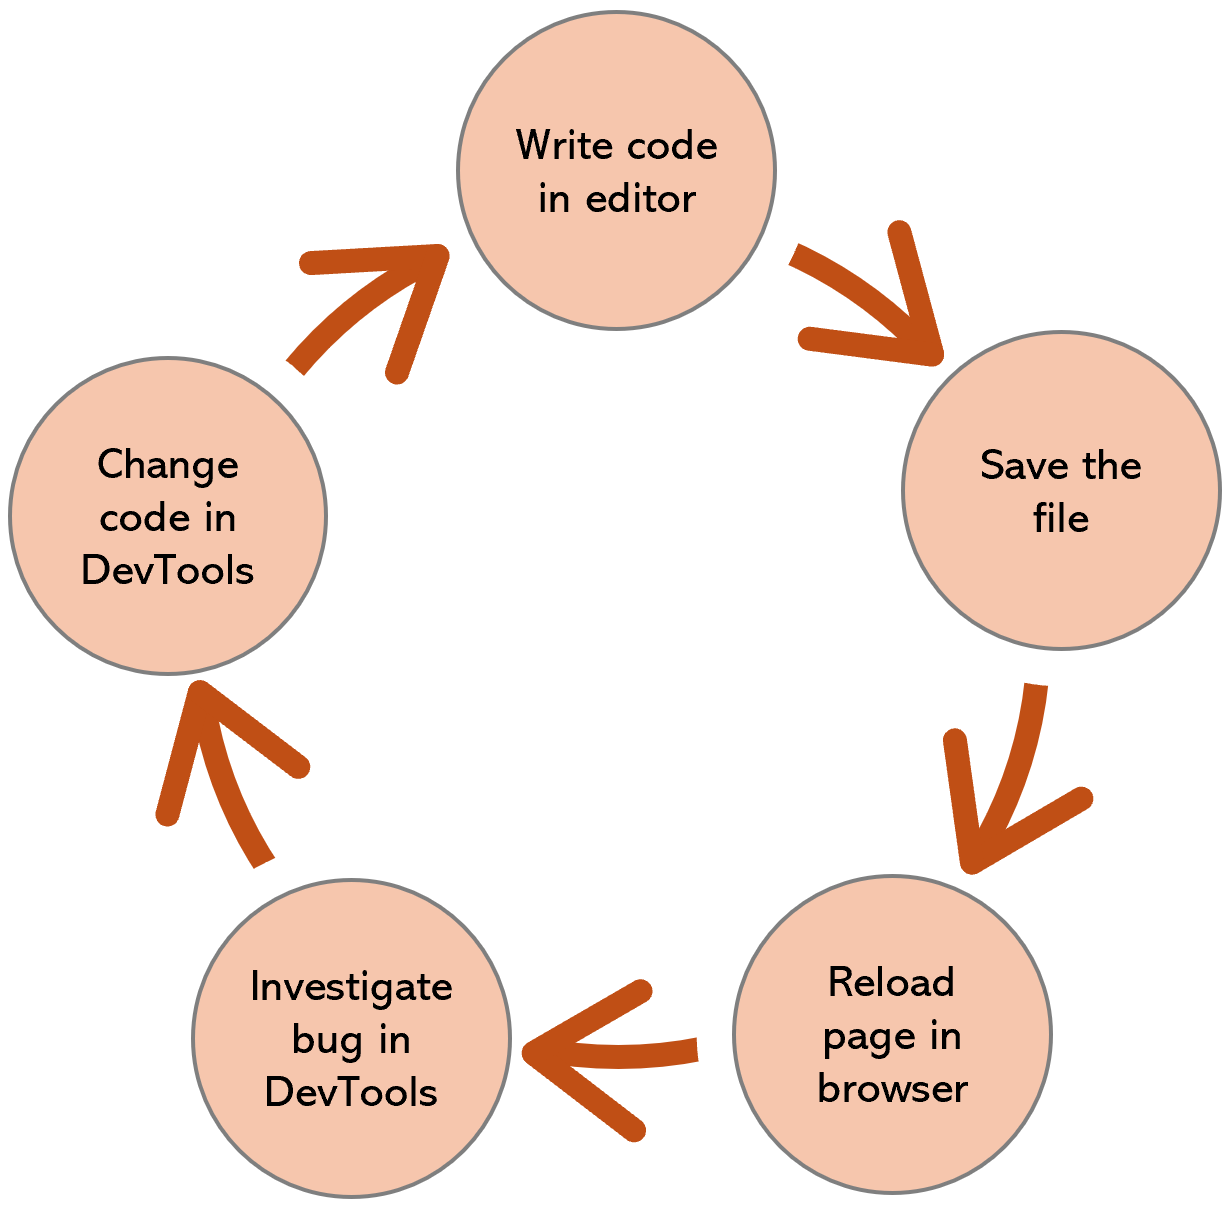
Here’s the powerful loop that turns you into a debugging dynamo:
Write Code in Editor: Your journey begins! Craft your HTML, CSS, or JavaScript locally in your favorite code editor.
Save the File: Commit your changes to your local file system.
Reload Page in Browser: See your latest code in action (or inaction!) by refreshing your browser tab.
Investigate Bug in DevTools: This is where DevTools shines! Dive into the Elements, Console, Network, or Sources panels to pinpoint issues, experiment with live tweaks, or profile performance.
Change Code in DevTools: Make quick, temporary adjustments directly in DevTools to test solutions on the fly, without needing to touch your local files.
Validate: Once you're satisfied with a DevTools-tested fix, update your local code files permanently to make those changes stick.
Repeat: And the cycle continues! Iterate, refine, and polish until your web project reaches perfection.
This agile approach minimizes context switching and maximizes your debugging efficiency, turning complex problems into solvable puzzles.
👑 The DevTools Pantheon – A Deep Dive into Power Panels!
Elements Panel 🌳
Your HTML/CSS manipulation headquarters.
Core Features:
DOM Tree Inspector: Navigate and edit HTML structure live. You can even drag and drop elements to change their order or parent.
Styles Panel: View, edit, and debug CSS with real-time updates. See which rules are applied, overridden, or inherited. Easily add new rules or toggle existing ones.
Computed Styles: See final calculated CSS values after inheritance and specificity. This shows the actual styles applied to an element.
Layout Debugger: Specialized tools for CSS Grid and Flexbox, allowing visual inspection of container and item alignments.
Event Listeners: View all JavaScript events (click, submit, scroll) attached to selected elements.
Accessibility Tree: Inspect ARIA labels and accessibility properties, crucial for inclusive design.
Practical Examples:
Debugging Layout Issues: If a footer overlaps main content, right-click the footer, inspect it, and then in the Styles panel, change
position: absolutetoposition: relativeor remove it entirely. Observe the instant fix and then copy the working CSS to your stylesheet.Color Debugging: If a blue heading won't turn red, inspect the
h1element. In the Styles panel, you might see your.title {color: red}rule crossed out. The Computed panel will reveal the actual color source and a higher specificity rule overriding yours, guiding you to adjust your CSS cascade.Responsive Design Testing: Toggle the Device Toolbar (
Ctrl+Shift+MorCmd+Shift+Mon Mac), select a device preset (e.g., iPhone 13, iPad), interact with responsive breakpoints, and test touch interactions/screen orientations.
Advanced Features:
Box Model Editor: Visual padding/margin/border adjustment.
Color Picker: Click any color value for advanced color tools (
Shift+click to cycle formats like HEX, RGBA, HSLA).Pseudo-class Toggles: Force
:hover,:focus,:active,:visitedstates to debug styling that only appears on interaction.Screenshot Node: Right-click an element → "Capture node screenshot" to save an image of that specific element.
Console Panel 📜
Your JavaScript command center and debugging companion.
Essential Console Methods:
console.log(): Basic output for general messages.console.error(): Red error messages, ideal for critical issues.console.warn(): Yellow warnings, good for non-critical alerts.console.table(): Tabular data display for arrays of objects.console.group()/console.groupEnd(): Collapsible message groups for organizing output.console.time()/console.timeEnd(): Performance timing for measuring code execution duration.console.trace(): Stack trace output to see how a function was called.
Practical Examples:
Advanced Debugging: Use
console.groupandconsole.tablefor structured output when debugging complex functions likecalculateTotal(items).function calculateTotal(items) { console.group('Order Calculation'); console.table(items); let total = 0; items.forEach((item, index) => { console.log(`Item ${index + 1}:`, item); total += item.price * item.quantity; }); console.time('Tax Calculation'); const tax = total * 0.08; console.timeEnd('Tax Calculation'); console.log('Final Total:', total + tax); console.groupEnd(); return total + tax; }Element Manipulation: Leverage Console shortcuts for quick DOM work:
$0: Currently selected element in Elements tab.$('button'): Equivalent todocument.querySelector('button').$$('div'): Equivalent todocument.querySelectorAll('div')as an array.$('body').style.filter = 'grayscale(100%)';// Make page grayscale$$('img').forEach(img => img.style.border = '3px solid red');// Outline all images
API Testing: Test API calls directly:
  fetch('/api/users')
    .then(response => response.json())
    .then(data => console.table(data))
    .catch(error => console.error('API Error:', error));
Monitor network events:
monitorEvents(document, 'click');(andunmonitorEventsto stop).
Pro Console Features:
Live Expressions: Pin variables to watch in real-time as your code runs.
Command History: Up/Down arrows cycle through previous commands.
Multi-line Editing:
Shift+Enterfor new lines, allowing you to write complex code blocks.Shortcuts:
Ctrl+Lclears the console.$_references the last evaluated expression.
Network Panel 📡
Monitor, debug, and optimize all HTTP/HTTPS requests. The network panel tells you what files are downloaded by the page. Many websites consist of hundreds of separate resources, like stylesheets, images, JavaScript code, or fonts.
Each row shows one resource that's been requested by Chrome while loading the page. You can click on each of the column headers to sort the list of requests, for example by file size. Larger files take longer to download.
Key Information Displayed:
Request Method: GET, POST, PUT, DELETE.
Status Codes: 200 (OK), 404 (Not Found), 500 (Server Error), etc.
Response Times: Time to First Byte (TTFB), download duration, total time.
File Sizes: Compressed vs uncompressed size.
Request/Response Headers: Authentication, caching, CORS details.
Waterfall Chart: Visual timeline of each request's phases (Queueing, Stalled, DNS Lookup, Initial Connection, SSL, Request Sent, Waiting, Content Download).
Timing: Breakdown of individual request timings when you click on a request.
DOMContentLoaded (DCL) & Load Events: Markers on the timeline indicating when the DOM is ready and when all resources have finished loading.
Practical Examples:
Debugging Failed API Calls: Before clicking a login button, open the Network tab. If the login fails, watch for a red failed request. Click it to see details like a
400 Bad Requeststatus and a response indicating a missing field, helping you fix form validation.Performance Optimization: Enable Network throttling ("Slow 3G") and reload the page. Sort requests by the "Size" column to identify bottlenecks (e.g., a 4.2MB hero image, a 2.1MB JavaScript bundle, 47 separate CSS files). Solutions might include image compression, code splitting, and CSS bundling.
CORS Debugging: If you encounter an "Access to fetch blocked by CORS policy" error, find the failed request. Check the Response Headers for
Access-Control-Allow-Origin(it might be missing or incorrect) and the Request Headers forOrigin. Fix your server to include proper CORS headers.
Advanced Network Features:
Request Blocking: Block specific domains/resources to test how your page behaves without them.
Response Overrides: Replace server responses locally to mock API data or error conditions.
HAR Export: Save all network data as a
.harfile for sharing or analysis in other tools.Network Conditions: Simulate offline mode or custom network speeds.
Request Replay: Right-click a request → "Replay XHR" to resend the request without reloading the page.
Sources Panel 🕵️♂️
Full-featured JavaScript debugger and code editor. This is where you set breakpoints, step through code, and inspect variables.
Main Components:
File Navigator: Browse all loaded scripts, stylesheets, images, and other assets.
Code Editor: View and temporarily edit source code. Changes are live but not persistent unless you use Overrides.
Debugger Sidebar: Manages breakpoints, displays the call stack, and shows the scope of variables at the current execution point.
Watch Panel: Monitor specific variables or expressions that are not currently in scope.
Snippets: Save and run reusable code blocks directly in DevTools.
Practical Examples:
Step-by-Step Debugging:
  // Problematic function:
  function calculateDiscount(price, couponCode) {
    let discount = 0;

    // Set breakpoint here by clicking line number
    if (couponCode === 'SAVE20') {
      discount = price * 0.2; // 20% off
    } else if (couponCode === 'SAVE10') {
      discount = price * 0.1; // 10% off
    }

    return price - discount; // Step through to here
  }
Set a breakpoint by clicking the line number. Call the function (e.g.,
calculateDiscount(100, 'SAVE20')) in the Console. Execution pauses at the breakpoint. Use step controls (F10for Step Over,F11for Step Into,Shift+F11for Step Out) to watch variables change in the Scope panel.Conditional Breakpoints: Right-click a line number and add a conditional breakpoint (e.g.,
i === 500) to pause execution only when a specific condition is true, avoiding pauses on every iteration of a loop.for (let i = 0; i < 1000; i++) { processItem(items[i]); // Right-click line number and add conditional breakpoint: i === 500 }Logpoints: Add a logpoint (instead of
console.log) directly in the Sources panel. It prints to the console without modifying your source code.function updateUserScore(userId, points) { // Logpoint: 'User {userId} gained {points} points' currentScore += points; return currentScore; }
Advanced Sources Features:
Workspaces: Sync DevTools changes with local files, allowing you to save changes made in DevTools directly to your project.
Local Overrides: Persist changes to any file across page reloads without modifying your source code.
Source Maps: Debug original TypeScript/CoffeeScript/etc., even if bundled and minified.
Pretty Print: Format minified code for readability by clicking the
{}icon at the bottom of the editor.Blackboxing: Hide library code from debugging to focus on your own application's code.
Performance Panel ⏱️
Profile and optimize runtime performance. This panel helps you identify and fix performance bottlenecks like slow JavaScript execution, layout shifts, and painting issues.
What It Measures:
CPU Usage: JavaScript execution, style recalculations, layout, and painting operations.
Memory Usage: Heap size, garbage collection, and potential memory leaks.
Frame Rate: Tracks frames per second (FPS); aims for a smooth 60fps.
Core Web Vitals: Provides insights into metrics like Largest Contentful Paint (LCP), Cumulative Layout Shift (CLS), and Interaction to Next Paint (INP).
Network Activity: Resource loading timeline during the recording.
User Interactions: Clicks, scrolls, keyboard events that occur during the recording.
Practical Examples:
Identifying Slow JavaScript: If your page becomes unresponsive, click "Record" in the Performance panel, trigger the slow operation, and then stop recording. The CPU chart will show long yellow bars (JavaScript), and the Main thread flame chart will pinpoint expensive functions (e.g.,
processLargeDataset()taking 3.2 seconds). Solution: Break work into chunks withsetTimeoutorrequestIdleCallback.Animation Performance: If a CSS animation is "janky," record it. The Performance panel can help identify if
leftis causing layout/paint, suggestingtransformfor smoother, compositor-only animations./* Bad: Triggers layout/paint, causing jank */ .sliding-menu { transition: left 0.3s ease; } /* Good: Uses compositor, smooth 60fps */ .sliding-menu { transition: transform 0.3s ease; will-change: transform; /* Hint to the browser for optimization */ }Memory Leak Detection: If the page gets slower over time, record performance while using the app. Check the Memory checkbox and observe if the JS Heap line trends upward. Take heap snapshots before/after actions to find detached DOM nodes and event listeners that are not being garbage collected. Fix: Ensure event listeners are removed and references are cleared when elements/components are destroyed.
Performance Optimization Workflow:
Record: Capture representative user interactions (e.g., page load, scroll, click a button).
Analyze: Look for red bars (dropped frames), long tasks (long yellow blocks on the CPU chart).
Identify: Dive into the flame chart to find the specific functions or operations causing bottlenecks.
Fix: Optimize expensive operations, defer non-critical tasks, or use
will-changefor animations.Verify: Record again after applying fixes to confirm improvements.
Application Panel 💾
Manage web storage, service workers, and PWA features. This panel is crucial for debugging client-side data, offline capabilities, and progressive web app functionality.
Storage Types:
Local Storage: Persistent key-value pairs that remain even after the browser is closed.
Session Storage: Key-value pairs that persist only for the duration of the browser session (tab).
Cookies: Small pieces of data sent by a web server to a user's web browser and stored there, used for session management, tracking, etc.
IndexedDB: A client-side database for storing large amounts of structured data.
Cache Storage: Used by Service Workers to cache network responses for offline access.
Web SQL: A deprecated but still visible client-side database technology.
Practical Examples:
Debugging Login Persistence: If users remain logged in after logout, navigate to Application > Local Storage. Look for authentication tokens (e.g.,
authToken) or session flags. After clicking logout, refresh the storage view. If tokens persist, the bug is found. Fix the logout function to clear storage (localStorage.removeItem('authToken'); sessionStorage.clear();).Cookie Debugging: If a GDPR consent banner keeps appearing, go to Application > Cookies > your-domain.com. Find the relevant cookie (e.g.,
gdpr_consent) and verify its value. Delete it to re-test the consent flow.Service Worker Cache Management: Inspect PWA caches under Application > Service Workers (check status,
Update on reloadfor development). Then, explore Application > Cache Storage to view and manage cached assets like HTML, CSS, JS, images, and API responses. You can manually delete cached entries.
PWA Development Features:
Manifest: Validate your
web app manifest.jsonfor installability criteria.Service Workers: Debug registration, lifecycle (activating, updating, skipping waiting), and message passing.
Offline Simulation: Test app behavior without network by ticking the "Offline" checkbox in the Service Worker tab.
Push Notifications: Debug notification permissions and payloads.
Security Panel 🔒
Your insight into page security. This panel helps ensure your website is secure and trustworthy.
SSL/TLS Certificate Details: Verify if your site is loading securely via HTTPS and if the certificate is valid, current, and issued by a trusted authority.
Connection Status: Understand the specific connection protocol (e.g., TLS 1.3), cipher suite used, and the certificate chain.
Mixed Content Warnings: Quickly identify and fix insecure HTTP resources (images, scripts, stylesheets) loaded on an HTTPS page, which can lead to "Not Secure" warnings in the browser.
🎯 Top 20 Practical DevTools Workflows
CSS & Design
Responsive Breakpoint Testing: Use the Device toolbar to test multiple screen sizes simultaneously.
Color Accessibility: Inspect text in Elements and check the contrast ratio in the color picker.
Layout Debugging: Use the Layout tab in Elements to toggle Grid/Flexbox overlays.
Font Investigation: Check the Computed tab in Elements for final
font-familyvalues.Animation Timing: Adjust keyframes and timing in the Animations tab.
JavaScript & Logic
Error Tracking: Click error links in the Console to jump to the problematic source code.
Performance Bottlenecks: Set breakpoints in Sources and profile slow functions.
Memory Leaks: Track heap size over time using the Memory checkbox in Performance.
Event Debugging: View all attached handlers in the Event Listeners tab within Elements.
Ajax Failures: Filter XHR in the Network panel and inspect failed API calls.
Network & Loading
Image Optimization: Sort by size in Network to identify oversized assets.
Caching Issues: Disable cache in Network to test fresh loading behavior.
CORS Problems: For failed requests in Network, check response headers.
Slow Connections: Simulate "Slow 3G" using Network throttling.
Resource Blocking: Use Network's request blocking to simulate blocking ads/trackers.
Storage & State
Login Debugging: Check tokens and session data in Application > Storage.
Cookie Management: Debug tracking and consent by inspecting cookies in Application.
Cache Inspection: Verify PWA offline assets in Application > Cache Storage.
Database Queries: Inspect client-side data in Application > IndexedDB.
Service Worker Issues: Debug offline functionality and lifecycle in Application > Service Workers.
⚡ Power User Tips & Shortcuts
Universal Shortcuts
F12: Open DevTools.Ctrl + Shift + C(Cmd + Shift + Con Mac): Inspect element mode.Ctrl + Shift + I(Cmd + Shift + Ion Mac): Toggle DevTools.Ctrl + Shift + M(Cmd + Shift + Mon Mac): Device mode.Ctrl + Shift + P(Cmd + Shift + Pon Mac): Command palette (search for any DevTools command).
Console Power Commands
// Element shortcuts
$0 // Last selected element in Elements panel
$1 // Second-to-last selected element
$('selector') // document.querySelector
$$('selector') // document.querySelectorAll as array

// Monitoring
monitor(functionName) // Log all calls to a specific function
unmonitor(functionName) // Stop monitoring that function
monitorEvents(element, 'click') // Track specific events on an element
copy(object) // Copy any object or value to clipboard

// Debugging utilities
debug(functionName) // Set an auto-breakpoint on a function call
undebug(functionName) // Remove that auto-breakpoint
table(arrayOfObjects) // Display an array of objects as a sortable table
dir(object) // Show object properties in an interactive list
Advanced Techniques
Local Overrides: Replace any server file with a local version for persistent debugging.
Snippets: Save reusable code blocks in the Sources panel for quick execution.
Live Expressions: Pin variables for real-time monitoring in the Console drawer.
Conditional Breakpoints: Only pause when conditions are met, useful in loops.
Logpoints: Print to console without altering your source code.
📚 Learning Resources & Next Steps
Official Documentation:
Chrome DevTools - Comprehensive guides and references 🌐
Firefox Developer Tools - MDN's detailed documentation 🦊
Safari Web Inspector - Apple's developer guide 🍎
Practice Recommendations:
Start Small: Use the Elements panel to modify existing websites.
Daily Debugging: Replace
console.logwith proper breakpoints and console APIs.Performance Audits: Profile your own projects regularly to identify and fix bottlenecks.
Cross-Browser Testing: Try the same debugging tasks in different browsers to understand their nuances.
Community Learning: Join developer communities, share DevTools discoveries, and ask questions.
🎉 Conclusion
DevTools transforms web development from guesswork into systematic problem-solving. Whether you're fixing CSS layouts, optimizing JavaScript performance, or debugging network issues, these built-in browser tools provide everything needed for professional web development.
Start with the basics—inspect elements, use the console, monitor network requests—then gradually explore advanced features like performance profiling and application storage management. With consistent practice, DevTools becomes an extension of your development workflow, making you a more efficient and effective web developer.
Remember: DevTools changes are temporary by default. Always update your source code to make fixes permanent. Happy debugging! 🐞✨
Guide compiled from official browser documentation and real-world development experience | Last updated: July 2025
Subscribe to my newsletter
Read articles from AlgoAvengers 🚀 directly inside your inbox. Subscribe to the newsletter, and don't miss out.
Written by
AlgoAvengers 🚀
AlgoAvengers 🚀
AlgoAvengers is a dev-first platform delivering curated tech news, career tips, and job updates — daily. We post theme-based blogs 7 days a week, covering: 💡 Dev concepts 🧠 Career & motivation 🔧 Tools & resources 📰 Weekly tech news (#FinalCommit) Join 8k+ developers growing with clarity, not chaos. 🚀