Part One - Introduction to the World of Debugging
 Blazebrain
Introduction
"If debugging is the process of removing bugs, then programming must be the process of putting them in." — Edsger W. Dijkstra
Oh boy, Edsger definitely knew what he was saying, because what?!
We've all been there, or better still, I've been there... a lot. You're building a piece of software etc, everything is going smoothly, and then ...bam! Your software crashes unexpectedly or starts behaving in ways you never intended. Red lines flood your console, and after multiple attempts to understand, you start feeling a wide range of emotions, from frustration to exhaustion, sometimes hunger :). I mean, why won't this thing just work?! What do I have to do?!
Frustrating yeah? That's exactly why debugging is an essential skill for any developer, and it's no different in the world of Flutter and Dart. It's not just about fixing errors; it's about ensuring that your application runs smoothly and maintains high quality.
In this article, the first in our series on the art of debugging, we'll explore:
What debugging is
The importance of debugging in programming
Common types of errors developers face
An introduction to a powerful Flutter debugging tool: Flutter DevTools
Ready to dive in? Let's get started!
What Is Debugging?
Debugging is the process of identifying, isolating, and fixing errors (or "bugs") in your codebase. It's a critical part of software development that ensures your application behaves as expected and delivers a great user experience.
Importance of Debugging in Programming
Debugging is vital for several reasons:
Improved Code Quality: By finding and fixing errors, we create more robust and reliable applications.
Enhanced Performance: Resolving performance bottlenecks during debugging ensures our apps run efficiently.
Deeper Understanding of Code: Debugging helps us gain insights into how our code works, leading to better programming practices.
Better User Experience: An application free from bugs provides users with a smooth and satisfying experience.
Reduced Development Time: Catching and fixing errors early can save time and resources in the long run.
Common Errors in Programming
As Engineers, we might encounter different kinds of errors during development. Recognizing and understanding these errors is the first step toward effective debugging.
1. Syntax Errors
These occur when we violate the syntax rules of the programming language. For example, missing quotes in strings or forgetting a semicolon. In Dart, these errors are usually caught by the analyzer before the code runs.
Examples:
Missing quotes in strings - String name = John; instead of String name = "John";
Forgetting semicolons - int x = 5 instead of int x = 5;
Missing parentheses - if x == 5 instead of if (x == 5)
Unmatched braces - { without corresponding }
Invalid keywords - funtion instead of function
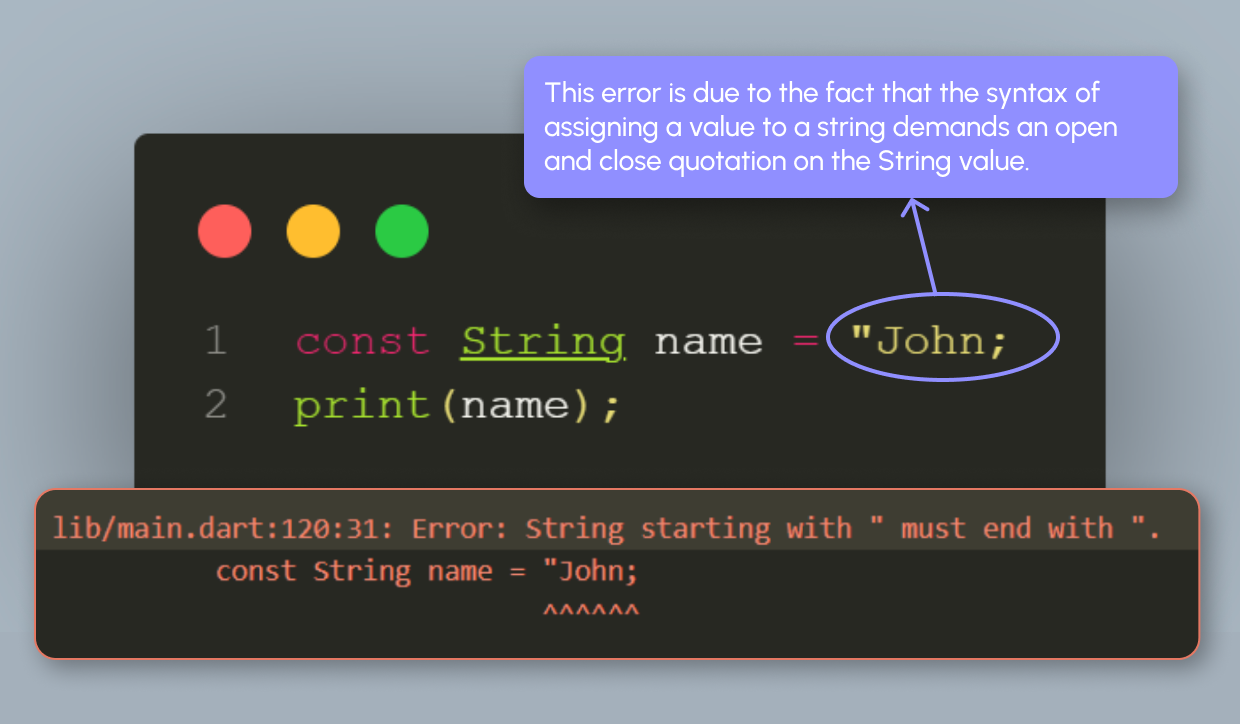
Syntax Error Example
2. Runtime Errors
Runtime errors happen during the execution of the code. They can also be called exceptions in Dart.
Examples:
FormatException - when trying to parse invalid data formats
Null pointer/null reference errors - when accessing properties on null objects
Array index out of bounds - when accessing invalid array indices,. like trying to fetch item 8 in an array with length 5.
File not found - when trying to access non-existent files
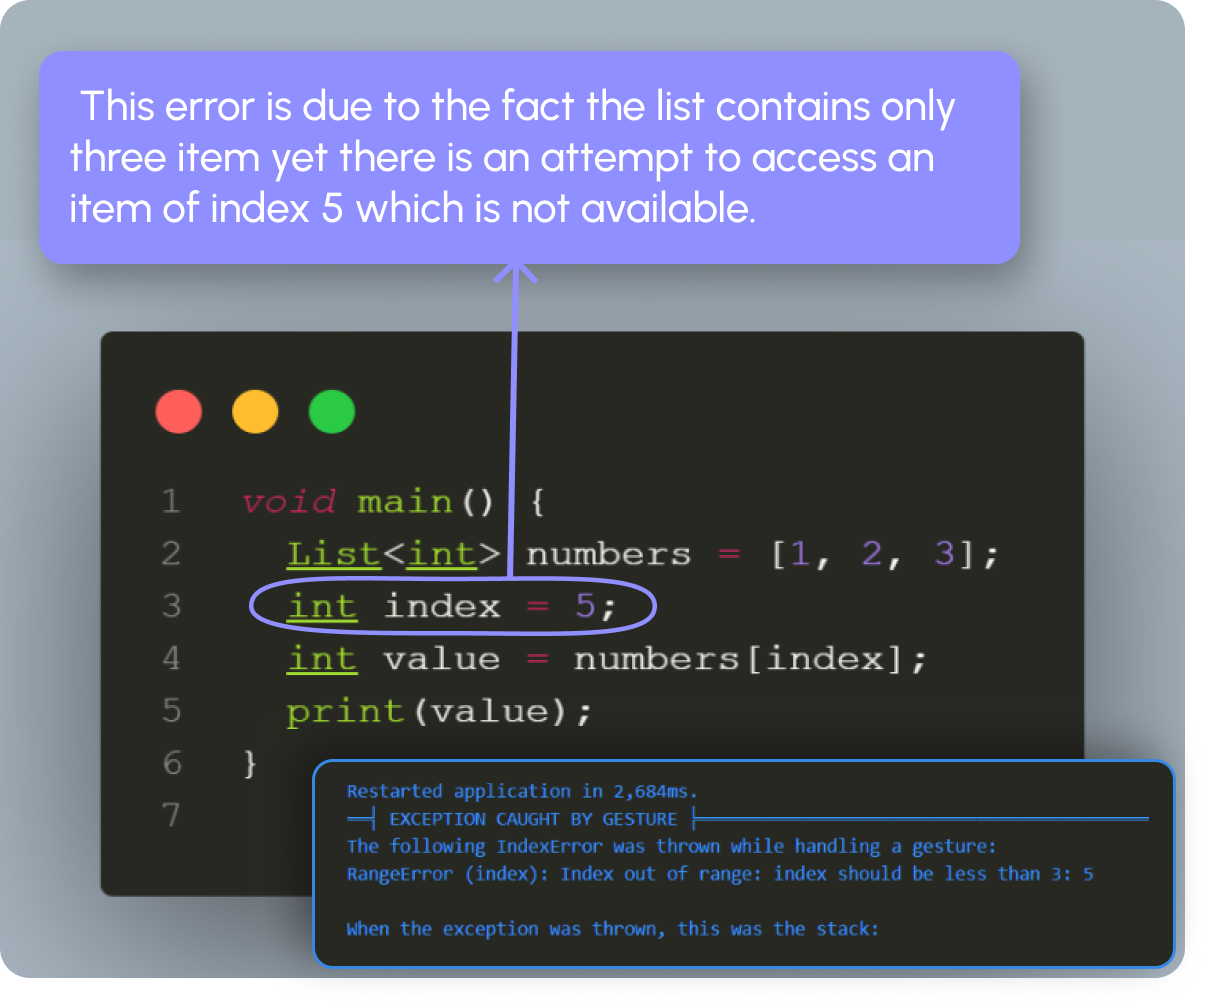
Runtime Error Example
3. Compilation Errors
Compilation errors prevent the high-level language code from being converted into machine code. These are caught before the program runs and often result from type mismatches or missing imports.
Examples:
int x = "hello"; (type mismatch)
if (x == 5 { (missing closing parenthesis)
y = x + 1; where x is not declared (undefined variable)
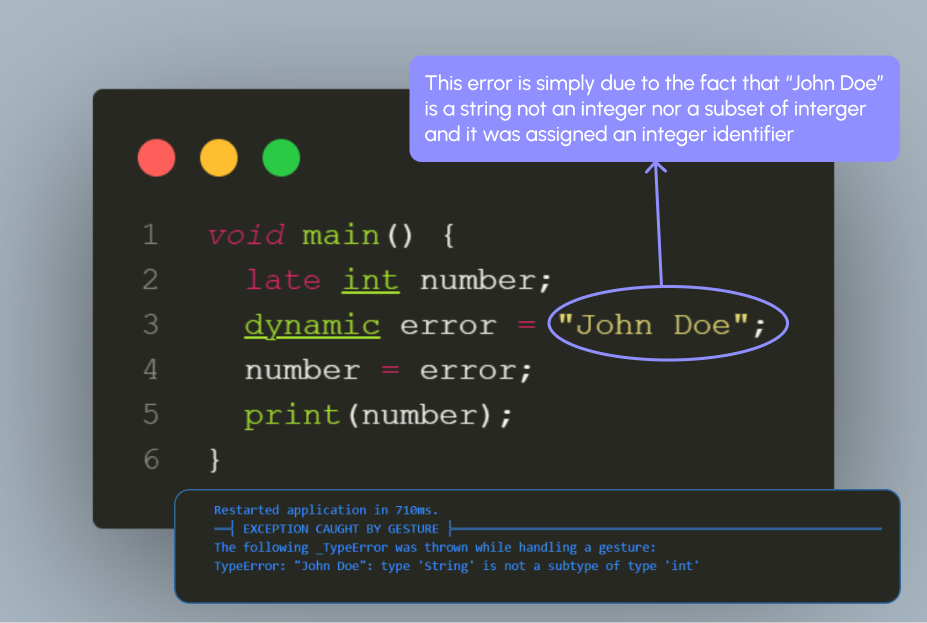
Compilation Error Example
4. Logic Errors
Logic errors are tricky, they don't prevent your program from running, but they cause it to produce incorrect results. This happens when there's a flaw in your algorithm or incorrect implementation due to a misunderstanding of the problem.
Examples:
Using a multiplication operator * instead of addition + when calculating a sum.
Infinite loops due to incorrect loop conditions
Incorrect sorting algorithms
Wrong mathematical formulas
Misunderstanding of data relationships
Incorrect boolean logic (using AND instead of OR, etc.)
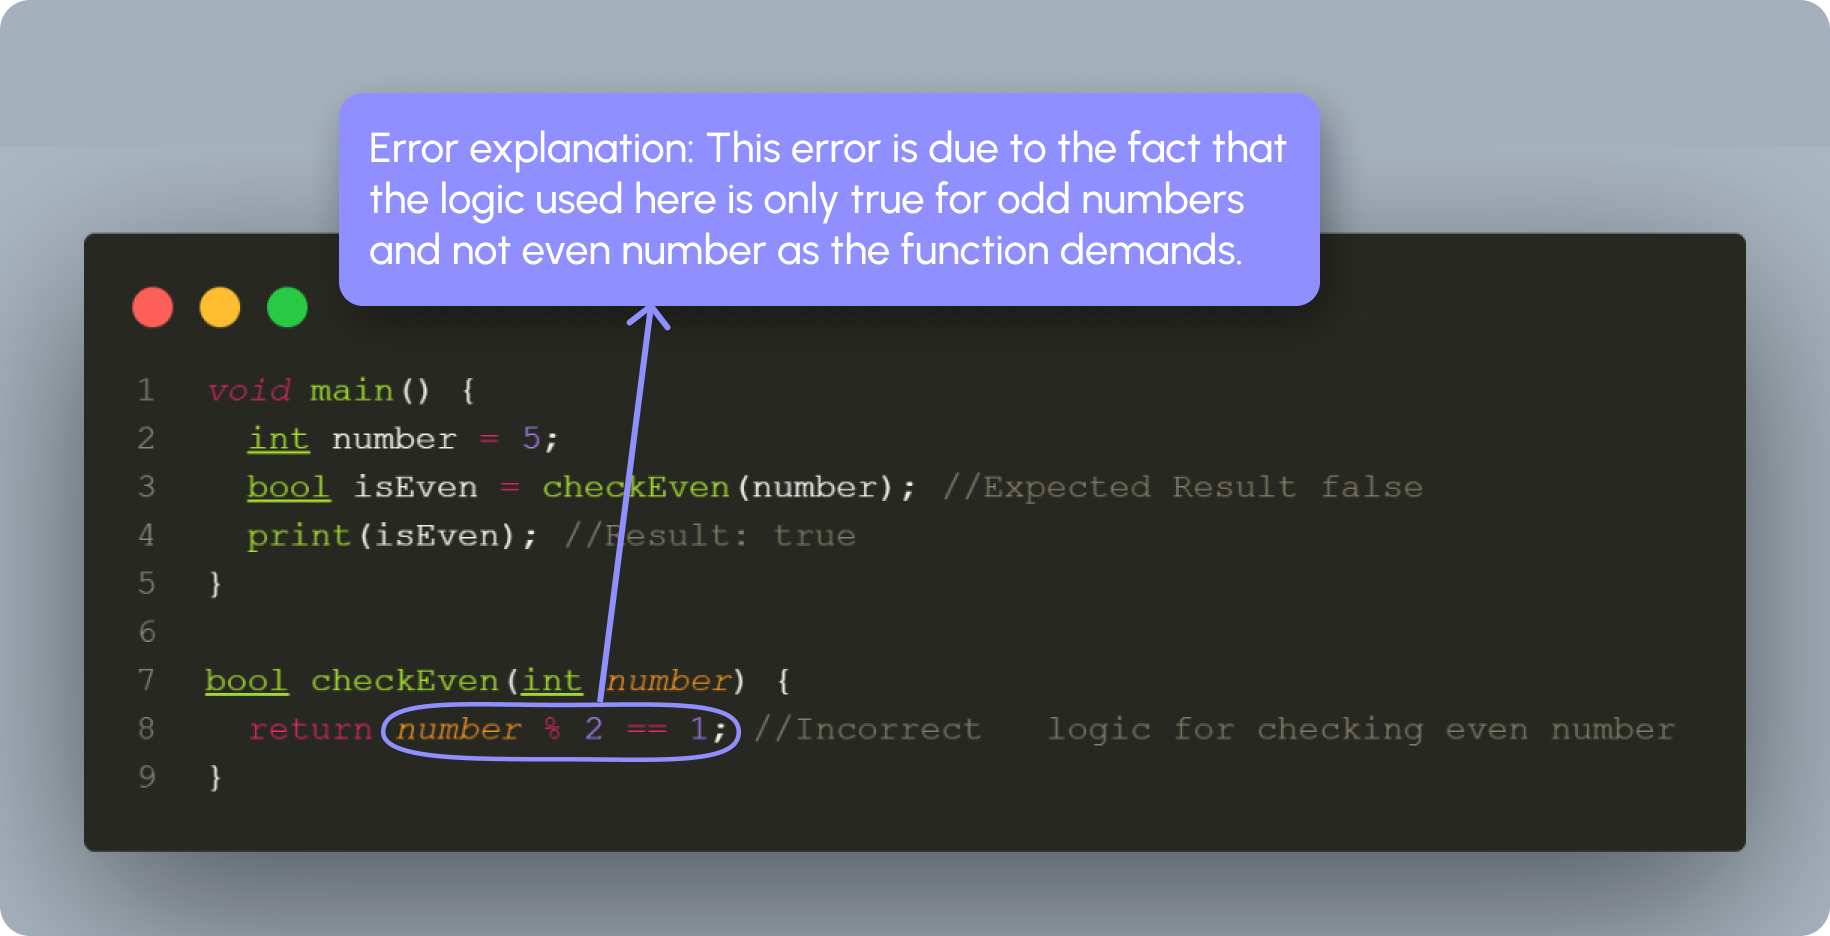
Logic Error Example
5. Semantic Errors
Semantic errors occur when the code doesn't do what it's supposed to, even though it's syntactically correct. It's about meaning rather than syntax.
Examples:
Using - instead of + when you intended to add two numbers.
Using = (assignment) instead of == (equality comparison)
Using the wrong variable name
Calling a function with parameters in the wrong order
Using integer division when you need floating-point division
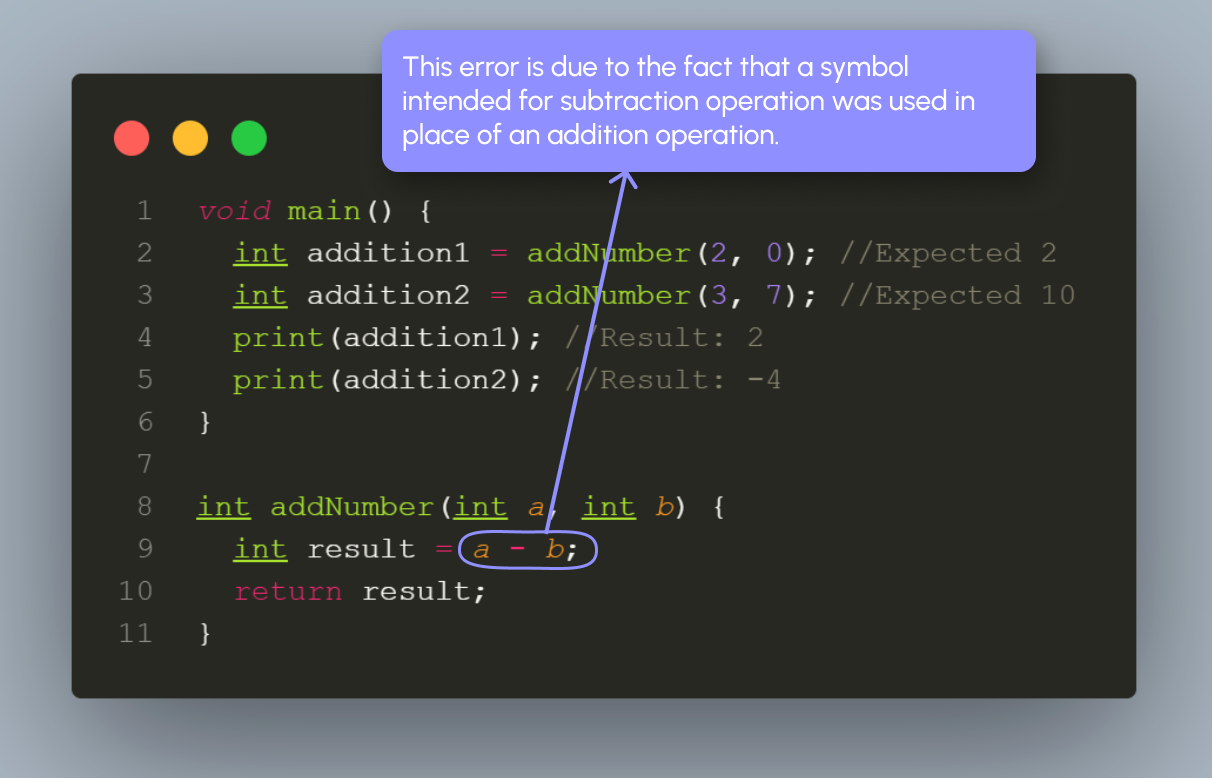
Semantic Error Example
Introduction to Flutter & Dart DevTools
What Are DevTools?
Flutter DevTools is a suite of performance and debugging tools for Flutter and Dart applications. They help you visualize your widget tree, debug layouts, analyze performance, and much more.
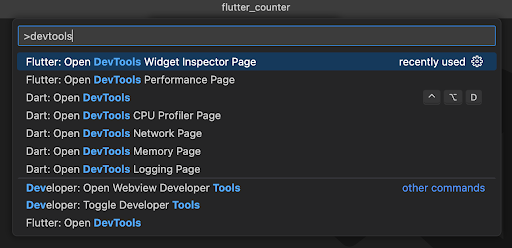
Launching DevTools in Visual Studio Code
To access DevTools in VS Code:
Press F1 to open the command palette.
Ensure your debug session is active.
Type "Open DevTools" and select any of the available commands.
Exploring the Features of Flutter DevTools
Flutter DevTools offers a range of powerful tools to help you debug and optimize your applications. Let's explore some of them:
1. Flutter Inspector
The Flutter Inspector allows you to visualize and explore your widget tree in real-time. It's invaluable for understanding existing layouts and diagnosing layout issues.
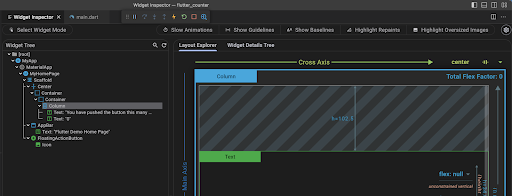
Flutter Inspector View
2. Performance View
The Performance view helps you diagnose performance problems and UI jank (lagging animations or interactions) in your application. It includes tools like the Flutter frames chart, which shows frame rendering times.
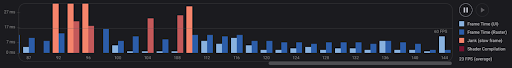
Flutter Frames Chart
3. CPU Profiler
The CPU Profiler allows you to record and analyze CPU activity in your app. It's useful for identifying performance bottlenecks and optimizing CPU usage.
4. Memory View
The Memory view provides insights into your app's memory allocation. You can detect memory leaks, analyze memory usage, and optimize accordingly.
5. Debug Console
The Debug Console lets you watch your app's standard output, evaluate expressions, and analyze object references while your app is running or paused in debug mode.
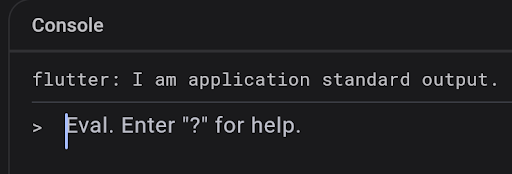
Debug Console View
6. Network View
The Network view allows you to inspect HTTP, HTTPS, and WebSocket traffic from your app. It's helpful for debugging network requests and responses.
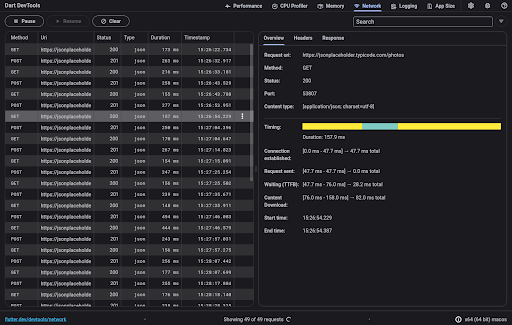
Network View
Note: Network traffic recording starts automatically when the Network page is opened. If it's not recording, click the Resume button in the upper left corner.
7. Debugger
The Debugger is a full source-level debugger that supports breakpoints, stepping (into, over, out), and variable inspection.
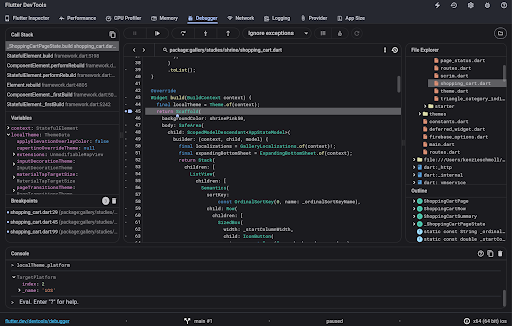
Debugger View
8. Logging View
The Logging view displays events from the Dart runtime, Flutter framework, and application-level logging events. It's useful for tracking the flow of your app and identifying issues.
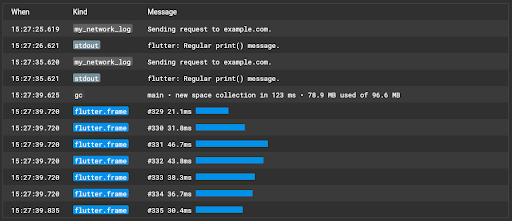
Logging View
9. App Size Tool
The App Size tool allows you to analyze the total size of your app, helping you optimize for download size and storage space.
To access the App Size tool:
Ensure DevTools is connected to a running application.
Navigate to the "App Size" tab.
Conclusion
Phewww, that was a lot yeah? Let's do a quick recap. We did an introduction to debugging, touched on how understanding and effectively using debugging tools is crucial for any Flutter Engineer. Always remember, debugging isn't just about fixing errors, it's about improving code quality, enhancing performance, and providing a better user experience.
In this first part of our series on the art of debugging, we've covered:
The definition and importance of debugging
Common types of errors in programming
An introduction to Flutter DevTools and its powerful features
In the upcoming articles, we'll dive deeper into specific debugging techniques, explore more features of Flutter DevTools, and learn how to tackle complex bugs in your Flutter applications.
Stay tuned, and happy coding!
Feel free to reach out if you have any questions or need further assistance. I'm always here to help!
Follow me on Twitter or connect with me on LinkedIn for more Flutter tips and tutorials. Get the next articles as they land: tap Subscribe below and join the Production-Ready newsletter.
Subscribe to my newsletter
Read articles from Blazebrain directly inside your inbox. Subscribe to the newsletter, and don't miss out.
Written by
Blazebrain
Blazebrain
I'm David Adegoke (Blazebrain), a Senior Mobile Engineer with over 5 years of experience in software engineering, technical writing, and community management.