7 Best Open-Source Data Analytics Tools in 2025
 Community Contribution
Table of contents
- Key Takeaways
- Top Open-Source Tools
- Open Source Analytics Tools Overview
- Open Source BI Tools Comparison
- Choosing Open Source Analytics Tools
- Open Source Reporting Software Tips
- FAQ
- What are open-source data analytics tools?
- Are open-source analytics tools secure?
- Can small businesses use open-source analytics tools?
- How do open-source tools compare to paid analytics solutions?
- What skills do teams need to use open-source analytics tools?
- How can organizations get support for open-source analytics tools?
- Which open-source analytics tool is best for machine learning?

Here are the top 7 open-source analytics tools for 2025: Apache Superset, Metabase, KNIME, RisingWave, Python with libraries, R with Tidyverse, and Orange Data Mining. Selection prioritized functionality, active community, scalability, ease of use, and AI/ML integration. Open-source tools drive innovation and transparency in data analytics. Many users choose open source analytics tools for their free access, customization, and rapid updates. The table below compares open-source tools and proprietary alternatives:
| Aspect | Open-Source Tools | Proprietary Tools |
| Usability | Simple, functional interfaces | Polished, interactive UIs |
| Support | Community-driven, no formal SLAs | 24/7 professional support |
| Customization | Highly flexible, transparent | Limited, vendor-controlled |
| Cost | Free to use, in-house maintenance | High upfront and recurring costs |
| Innovation | Rapid, community-driven | Slower, vendor-driven |
| Transparency | Full source code access | Closed source |
Readers should consider their unique data needs before selecting an open-source platform. Free solutions offer great value, but require internal expertise for support and integration.
Key Takeaways
Open-source data analytics tools offer free, flexible, and customizable solutions for businesses of all sizes.
Top tools like Apache Superset, Metabase, KNIME, RisingWave, Python, R, and Orange cover a wide range of analytics needs from simple dashboards to advanced machine learning.
Choosing the right tool depends on factors like technical compatibility, scalability, security, integration, user skills, and community support.
Open-source platforms require internal expertise but provide rapid innovation and full transparency compared to proprietary software.
Integration with existing data sources and business applications is crucial for smooth data flow and accurate insights.
Strong community support and active development help users solve problems and keep tools up to date.
Organizations should plan carefully, invest in training, and follow best practices to maximize the value of open-source reporting and analytics software.
Starting with a pilot project and engaging stakeholders helps ensure successful adoption and data-driven decision making.
Top Open-Source Tools
Tool List
The landscape of open source analytics tools continues to evolve in 2025. Organizations rely on these platforms to gain business intelligence, automate reporting, and support advanced analytics. The following list highlights seven of the best open-source tools for data analytics and business intelligence:
Apache Superset
This BI platform offers interactive dashboards, SQL exploration, and strong integration with modern data warehouses. Superset supports real-time analytics and is known for its active community.Metabase
Metabase provides a user-friendly interface for business intelligence. Teams can create dashboards, run queries, and visualize data without deep technical skills. It is free and easy to deploy.KNIME
KNIME stands out for its workflow automation and machine learning capabilities. Users can build complex analytics pipelines with a drag-and-drop interface. KNIME is popular in both research and enterprise settings.RisingWave
This cloud-native streaming database enables real-time analytics on large data streams. RisingWave supports SQL queries and integrates with modern BI tools.Python with Libraries (Pandas, Plotly, Streamlit)
Python remains a top choice for analytics and intelligence. Libraries like Pandas handle data manipulation, Plotly creates interactive charts, and Streamlit builds BI dashboards. These tools are free and widely supported.R with Tidyverse
R, combined with the Tidyverse collection, excels in statistical analysis and data visualization. Analysts use R for advanced analytics and reporting in many industries.Orange Data Mining
Orange offers a visual programming approach to analytics and machine learning. Users can build workflows for data mining, visualization, and intelligence tasks without coding.
Note: These open-source tools provide free access to powerful BI and analytics features. They support a range of data analytics needs, from simple reporting to advanced machine learning.
Criteria
Industry experts recommend several criteria when selecting open source analytics tools or data analytics platforms. These criteria help organizations choose the right solution for their business intelligence needs:
Technical compatibility with current infrastructure.
Scalability to manage growing data volumes and analytics workloads.
Compliance with security standards.
Integration with other BI systems and data sources.
Total cost of ownership, including hidden expenses.
Required user expertise and technical skills.
Strong community support and quality documentation.
Vendor stability and available support services.
Access to training resources.
Teams should also consider the type and complexity of their data, the specific analytics tasks required, and the skills available within their organization. The selection process often starts with an initial screening, followed by detailed evaluation and proof of concept using real data.
Choosing the right open-source tools for BI and analytics ensures organizations can scale, innovate, and maintain control over their data without high costs.
Open Source Analytics Tools Overview
Apache Superset
Overview
Apache Superset stands out as a modern open-source BI platform designed for interactive dashboards and advanced data analysis. Organizations use Superset to explore, visualize, and share insights from large datasets. The platform supports a wide range of SQL databases, making it a flexible choice for teams that need to connect to multiple data sources. Superset’s open-source nature allows users to self-host and customize the platform to fit unique business requirements. Its active community and robust documentation help new users get started quickly.
Features
Integration with many SQL databases, supporting both traditional and big data environments.
Highly scalable architecture, capable of serving over 600 daily users and rendering more than 100,000 charts.
Granular security model that enables organizations to assign different access levels to users.
Customizable source code, allowing teams to adapt the platform for specific analytics needs.
Large, active online community with support channels on Slack and Stack Overflow.
Advanced data visualization capabilities, including interactive dashboards and a variety of chart types.
Free to use and modify, making it accessible for organizations of all sizes.
Pros & Cons
| Pros | Cons |
| Free and open-source with no licensing fees | Requires technical expertise to self-host |
| Supports a wide range of SQL databases | Initial setup can be complex |
| Highly scalable for large organizations | Limited out-of-the-box support for non-SQL sources |
| Customizable and extensible | Some advanced features may need coding |
| Strong community support | Documentation can be overwhelming for beginners |
Use Cases
Enterprises deploy Superset to build interactive dashboards for real-time BI and analytics.
Data teams use Superset for tracking key performance indicators and visualizing trends across multiple data sources.
Organizations with strict security requirements leverage the granular access controls for sensitive data analysis.
Companies that need to self-host their BI tools choose Superset for its flexibility and scalability.
Superset serves as a central platform for data visualization tools, supporting both technical and non-technical users.
Metabase
Overview
Metabase offers a user-friendly approach to BI and analytics, making it a popular choice for teams seeking quick insights without deep technical skills. The platform provides a simple interface for building interactive dashboards, running queries, and sharing reports. Metabase is free to use and easy to self-host, which appeals to startups, small businesses, and larger organizations alike. Its focus on accessibility and rapid deployment helps teams start tracking data and analytics with minimal setup.
Features
No-code query builder for users without SQL experience.
Native drivers for popular databases and JDBC connections for others, enabling integration with a wide variety of data sources.
Seamless integration with major data warehouses such as Amazon Redshift, Google BigQuery, and Snowflake.
Interactive dashboards and visualization options for clear data presentation.
Exporting data in multiple formats for further analysis or reporting.
Integration with ETL/ELT tools like Airbyte, Fivetran, and Stitch to enhance data management and scalability.
Free and open-source, with options to self-host or use managed services.
Pros & Cons
| Pros | Cons |
| Free and open-source, easy to self-host | Relies on underlying data warehouse for scalability |
| Intuitive interface for non-technical users | Advanced analytics features are limited |
| Fast deployment and minimal setup | Performance may degrade with very large datasets |
| Supports a wide range of data sources | Customization options are less extensive than some competitors |
| Strong community and documentation | Some integrations require manual configuration |
Use Cases
Startups and small businesses use Metabase for affordable, no-code analytics and rapid insights.
Tech and SaaS companies leverage Metabase for product usage analysis, KPI tracking, and embedded analytics.
E-commerce businesses track sales, customer behavior, and inventory trends by consolidating data from multiple sources.
Financial and fintech firms analyze transaction data, automate dashboards for compliance, and benefit from self-hosting for data privacy.
Marketing teams monitor campaign performance and website metrics with user-friendly dashboards.
Healthcare and research organizations use Metabase for patient analytics and operational tracking.
Nonprofits and educational institutions analyze fundraising, operational efficiency, and student performance without dedicated data teams.
| Industry / Sector | Company / Use Case Example | Primary Use Case / Benefit |
| Manufacturing | Griffin Marine Services | Reporting using built-in CSV database |
| IT & Software | Hurb | Improved decision-making and increased earnings |
| Logistics & Transportation | KLog | Delivering shipping reports to clients |
| Nonprofit | Kula and Standard Co | Empowering female entrepreneurs |
| IT & Software | Lime Technologies | White-labeling Metabase for customer business insights |
| Travel & Hospitality | Linstol (via CaseWhen) | Becoming more data-driven |
| eCommerce | Marketfuel | Rapid proof of concept for in-app reporting |
| IT & Software | Matter | Saving 30% of growth budget through data-informed decisions |
| Nonprofit | myAgro | Enabling true self-service analytics |
| Banking & Finance | N26 | Promoting data literacy in mobile banking |
| IT & Software | Onepark | Cutting ad hoc data requests by half |
| Transport Management System | Owlery | Reducing embedded analytics iteration time from days to hours |
| Education | Reforge | Single source of truth for data |
| IT & Software | Retargetly | Building a data culture |
| IT & Software | Sincera | Embedding analytics for digital advertising insights |
| IT & Software | Spocket | Saving over 60 hours/month, avoiding ad hoc data requests |
| Retail | Sunglass Fix | Business exploration with Metabase |
| Banking & Finance | Synctera | Improving customer satisfaction and self-service analytics |
| Travel & Hospitality | Treebo Hotels | Integrating metrics and KPIs into daily routine |
| Internet of Things | Uptime | Operational analytics to maintain elevator uptime |
| IT & Software | Usabilla | Unlocking analytics for all employees |
Metabase enables collaboration between departments by replacing inefficient methods like screenshots and raw queries with interactive dashboards and shared insights. Data teams use SQL queries within Metabase to uncover patterns and build visual reports, while other teams consume these reports to reduce ad hoc data requests. This approach leads to faster decision-making and empowers non-data teams to explore data independently, fostering a data-driven culture.
KNIME
Overview
KNIME is a leading open-source platform for advanced analytics, machine learning, and workflow automation. It provides a visual interface that allows users to build complex analytics pipelines without coding. KNIME supports both structured and unstructured data, making it a versatile choice for organizations with diverse data analysis needs. The platform’s modular architecture and strong community support make it suitable for enterprises seeking extensible and collaborative data analysis tools.
Features
Visual workflow editor for building analytics pipelines with drag-and-drop simplicity.
Extensive library of machine learning algorithms, including decision trees, regression, clustering, and neural networks.
Robust data cleaning and preprocessing tools for preparing data for analysis.
Integration with Python, R, and other programming languages for advanced analytics.
Support for both structured and unstructured data across multiple systems.
Automation of routine analytics tasks, reducing manual effort and increasing efficiency.
Collaboration features, including workflow sharing, version control, and the KNIME Hub for discovering reusable components.
Modular architecture with numerous extensions for specialized analytics, such as text mining and image processing.
Free and open-source, with options to self-host and scale as needed.
Pros & Cons
| Pros | Cons |
| Free and open-source with no licensing fees | Some advanced features require extensions |
| No-code/low-code interface broadens accessibility | Initial learning curve for new users |
| Supports advanced analytics and machine learning | Platform license fees may apply for enterprise features |
| Strong collaboration and sharing capabilities | Implementation and training require investment |
| Highly extensible and customizable | Complex workflows can become difficult to manage |
Use Cases
Data scientists and analysts use KNIME for advanced analytics, machine learning, and data visualization.
Enterprises automate data migration, reporting, and tracking activities, saving significant time and resources.
Audit teams leverage KNIME’s AI capabilities to improve risk detection and automate routine audit tasks.
Organizations integrate KNIME with other data analysis tools and platforms via APIs and custom nodes.
Teams collaborate on analytics projects by sharing workflows and insights through the KNIME Hub.
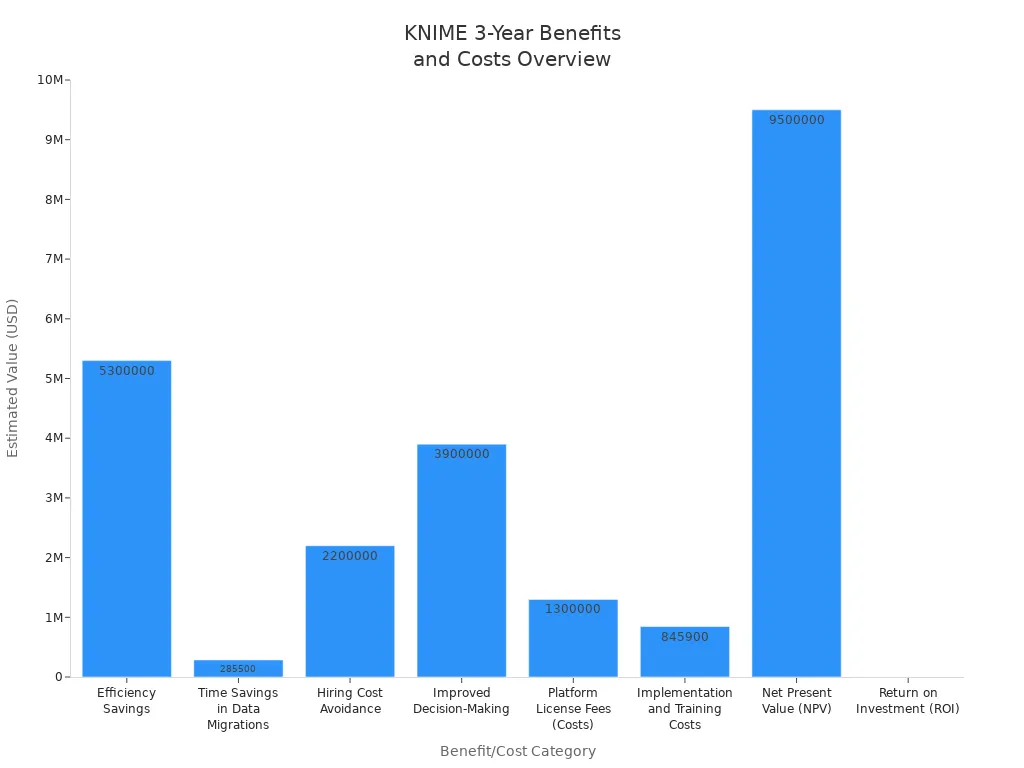
KNIME delivers strong returns on investment by improving efficiency, reducing hiring costs, and enabling better decision-making through advanced analytics. Its open-source model encourages community contributions and innovation, making it a powerful choice for organizations seeking scalable, collaborative, and extensible data analysis tools.
RisingWave
Overview
RisingWave has emerged as a modern open-source solution for real-time data analytics and bi. The platform is built from scratch in Rust and features a decoupled compute-storage architecture. This design optimizes RisingWave for high-throughput and low-latency stream processing in cloud environments. Unlike many traditional data analysis tools, RisingWave uses a PostgreSQL-style SQL interface. This familiar interface makes it easier for teams to adopt and develop complex stream processing logic. RisingWave supports persistent internal data storage, which removes the need for external databases when serving queries. The platform integrates well with PostgreSQL-compatible tools and a wide range of cloud systems, making it a flexible choice for organizations focused on bi and real-time tracking.
Features
PostgreSQL-style SQL interface for easy learning and rapid development.
Cascaded materialized views allow users to express complex stream processing logic simply.
Persistent internal data storage eliminates the need for external databases for query serving.
Decoupled compute-storage architecture supports high-throughput and low-latency stream processing.
Transparent dynamic scaling enables near-instantaneous adjustments without service interruptions.
Instant failure recovery allows the system to recover in seconds.
Broad ecosystem integration, including compatibility with PostgreSQL tools and cloud platforms.
Forever-Free Developer Tier and Standalone deployment mode for accessible setup and experimentation.
User-friendly SQL-based experience compared to other open-source data analysis tools like Apache Flink.
Pros & Cons
| Pros | Cons |
| Simple SQL interface lowers the learning curve for bi and analytics | Newer platform with a smaller community |
| Efficient real-time data tracking and analytics | Fewer third-party integrations than legacy tools |
| Dynamic scaling and instant failure recovery | Documentation may not be as extensive as older data analysis tools |
| Persistent storage simplifies architecture | Some advanced features still in development |
| Cost-efficient and cloud-optimized | Limited support for batch processing |
| Integrates with many data analysis tools and bi platforms | Requires cloud infrastructure for best performance |
Use Cases
RisingWave supports streaming analytics and bi across many industries by efficiently ingesting and processing high-velocity data from multiple sources. The platform excels in scenarios that require real-time tracking and continuous updates.
Financial Services: Teams use RisingWave for fraud detection and market analysis by monitoring transactions and stock trends in real time.
Retail: Companies analyze customer behavior and manage inventory through real-time tracking of shopping patterns and stock levels.
IT Infrastructure: Organizations monitor system health and detect anomalies by continuously analyzing server and network data.
Security: Security teams implement intrusion detection and threat analysis using real-time monitoring of network traffic and user activities.
Data Integration: RisingWave enables real-time ETL, data enrichment, and continuous data loading to keep data fresh and consistent for bi.
Customer Experience: Businesses deliver real-time recommendations, dynamic content, and rapid issue resolution to improve engagement and satisfaction.
Social Media: Platforms use RisingWave for real-time content moderation and trend analysis, helping maintain safe environments and identify emerging topics.
RisingWave’s robust connectors and compatibility with analytics tools via Postgres drivers make it a strong choice for organizations that need scalable, real-time bi and data tracking. The platform’s ability to handle complex transformations and provide consistent data access supports a wide range of data analysis and visualization needs.
Orange Data Mining
Overview
Orange Data Mining offers a unique approach to bi and analytics by focusing on accessibility and education. The platform uses a visual programming interface that allows users to build workflows by dragging and connecting widgets. This design removes the need for programming skills, making Orange especially popular among non-programmers, educators, and students. Universities and training centers around the world use Orange to teach data science and machine learning concepts. The platform supports both exploratory and advanced analytics, helping users understand data mining and bi through hands-on experience.
Features
Orange provides a comprehensive set of features that support a wide range of bi and data analysis tasks:
Visual programming interface: Users create workflows by placing and connecting widgets, eliminating the need for coding.
Interactive data visualization tools: Scatter plots, heatmaps, and clustering help users explore and present data visually.
Specialized add-ons: Extensions for text mining, network analysis, and bioinformatics expand the platform’s capabilities.
Educational widgets: Designed for teaching, these widgets help explain key data mining and bi concepts.
Real-time feedback: Automatic signal propagation in workflows lets users see the effects of changes instantly.
Global adoption: Schools, universities, and professional trainers use Orange for hands-on learning and practical bi projects.
Community-driven development: Educators and researchers contribute to the platform, ensuring it remains intuitive and up-to-date.
Pros & Cons
| Pros | Cons |
| No programming required; ideal for beginners and educators | Limited customization for advanced users |
| Intuitive drag-and-drop workflow design | May not scale well for very large datasets |
| Strong support for bi and data visualization | Fewer integrations with enterprise data sources |
| Extensive library of widgets and add-ons | Some advanced analytics require external tools |
| Excellent for teaching and learning data science concepts | Performance can decrease with complex workflows |
| Free and open-source, with active community support | Not designed for heavy-duty production bi systems |
Use Cases
Orange Data Mining serves a variety of bi and data analysis needs across different sectors. Its visual programming and educational focus make it especially valuable in the following scenarios:
Education and Training: Teachers and students use Orange to explore machine learning, clustering, and regression without writing code. The platform’s educational widgets and real-time feedback help learners grasp complex concepts quickly.
Citizen Data Scientists: Individuals without programming backgrounds analyze data and build bi workflows using Orange’s intuitive interface. This democratizes access to analytics and empowers more people to make data-driven decisions.
Rapid Prototyping: Data analysts and researchers use Orange to test ideas and visualize results before moving to more complex tools. The drag-and-drop design speeds up experimentation and discovery.
Text Mining and Network Analysis: Specialized add-ons allow users to perform advanced tasks like sentiment analysis, topic modeling, and social network mapping, all within the same bi platform.
Professional Development: Organizations use Orange for in-house training, enabling employees to learn about data mining and bi in a hands-on, interactive way.
Orange Data Mining stands out as a powerful educational tool that brings bi and analytics to a wider audience. Its visual approach, combined with strong community support, makes it an excellent choice for teaching, learning, and exploring data science.
Open Source BI Tools Comparison
Selecting the right open source bi tools can shape the success of any analytics project. Each platform offers unique strengths, making it important to compare features and use cases. The following tables help readers understand how leading open source bi tools stack up in 2025.
Feature Table
The table below highlights the most significant differences in features among top open source bi tools. It covers user interface, extensibility, and AI/ML integration. This comparison helps organizations choose the best fit for their business intelligence tools and analytics needs.
| BI Tool | Key Features & Strengths | User Interface (UI) | Extensibility/Customization | AI/ML Integration Features |
| Apache Superset | Cloud-native architecture, multi-tenant analytics, 40+ visualizations, Smart Dashboard Builder (2025) | Modern, interactive dashboards | Python extensibility, plugin support | Integrates with Python ML libraries |
| Metabase | Intuitive 'Ask a Question' UI, automated modeling, AI assistant (MetaBot), simple setup | Simple, no-code dashboard builder | Custom visualizations, API access | AI assistant for query suggestions |
| Lightdash | Semantic layer on dbt models, governed metrics, Metrics Explorer for consistency | Clean, dbt-focused interface | Metric governance, dbt integration | Metric consistency, supports dbt ML workflows |
| Redash | Lightweight query editor, shareable dashboards, native DuckDB support, alerting | Minimalist, SQL-focused | API, alerting, plugin support | Integrates with external ML tools |
| Grafana | Observability focus, SQL data-source improvements, notebook panels, 100+ connectors | Customizable panels, notebook UI | Plugin ecosystem, scripting | ML-powered anomaly detection |
| Pentaho CE | ETL plus bi suite, React dashboard designer, Snowflake support | Drag-and-drop dashboard designer | ETL customization, plugin support | Integrates with ML libraries |
| BIRT | Pixel-perfect reporting, web-based designer (2025) | Report-focused, precise layout | Custom report templates | Limited ML, focuses on reporting |
| GoodData.CN | Headless containerized analytics, Logical Data Modeler, REST/GraphQL APIs | API-driven, minimal UI | REST/GraphQL extensibility | Supports embedded ML models |
| Cube | Headless bi layer, WASM-based SQL transpilation, Authz SDK for row-level security | Developer-centric, API-first | SDKs, custom logic | Integrates with external ML/AI services |
| SQLPad | Lightweight SQL IDE, AI-assisted query hints, Dark Mode UI | Simple SQL notebook | Plugin support, API | AI-assisted query hints |
Tip: Open source bi tools often provide more customization and integration options than proprietary platforms. Teams can extend functionality to match evolving analytics requirements.
Use Case Table
Open source bi tools address a wide range of business needs. The table below matches each tool to its ideal users and scenarios. This helps organizations align their choice with their analytics goals.
| BI Tool | Ideal Users / Use Cases | Typical Challenges Addressed |
| Apache Superset | Large-scale deployments, data platform teams, Python extensibility | Scaling analytics, multi-source integration, security |
| Metabase | Startups, product teams, non-technical users needing self-serve dashboards | Fast setup, ease of use, data democratization |
| Lightdash | Companies invested in dbt workflows, analysts needing metric governance | Metric consistency, dbt integration |
| Redash | Engineers needing quick SQL insights and sharing | Lightweight reporting, rapid prototyping |
| Grafana | Mixed observability and bi use cases | Combining monitoring and analytics |
| Pentaho CE | Enterprise ETL fans, users needing combined ETL and bi | Data pipeline automation, complex ETL |
| BIRT | Finance, manufacturing, users needing precise PDF reports | Pixel-perfect reporting, compliance |
| GoodData.CN | Product teams embedding analytics | Embedded analytics, API-driven workflows |
| Cube | Developers embedding analytics in custom apps | Custom app analytics, row-level security |
| SQLPad | Small teams wanting self-hosted query notebooks | Simple SQL analysis, privacy, self-hosting |
Many organizations face challenges when implementing open source bi tools. Resource constraints can limit small businesses from investing in analytics talent. Data complexity often leads to operational inefficiencies. Security and privacy concerns require robust protection. Skills gaps and integration issues can slow adoption. Teams that plan carefully and leverage community support can overcome these obstacles.
Note: Open source bi tools empower organizations to build tailored analytics solutions. They support a variety of business intelligence tools and workflows, from simple dashboards to advanced intelligence and machine learning.
Choosing Open Source Analytics Tools
Assess Needs
Every data-driven business should begin by assessing its unique requirements before selecting an open-source analytics tool. Organizations must look beyond the initial purchase price and consider total costs, including maintenance, support, and opportunity costs. Data-driven businesses often involve multiple stakeholders, so leadership buy-in and organizational data maturity play a crucial role in successful adoption. Familiarity with certain tools can influence decisions, but teams should remain objective.
Ethical and legal considerations, such as compliance with gdpr and other data privacy laws, are essential. Companies must evaluate how each tool manages security and privacy to avoid legal risks.
Interoperability and integration with existing systems ensure that analytics platforms can exchange data and support collaboration. The software development lifecycle also matters. An active community, regular updates, and reliable support contribute to long-term sustainability. Access to clear information and metrics about open-source projects helps organizations make informed choices.
Key factors to consider:
Data privacy and gdpr compliance
Integration with current systems
Community activity and support
Project sustainability and updates
A careful assessment ensures that the chosen tool aligns with technical capabilities and supports data-driven decision making.
Match Skills
Selecting the right analytics platform requires a realistic evaluation of team skills. Data-driven businesses benefit when all key roles—leadership, IT, delivery teams, and business units—understand the chosen approach and business objectives. Effective communication across these roles keeps everyone aligned with the overall data strategy.
Teams should foster engagement between those designing the data strategy and those using the data. This ensures the platform meets real business needs and supports data-driven decision making.
Forming a center of excellence can provide ongoing support and expertise, helping teams overcome technical challenges.
Adopting agile delivery methods allows for iterative learning and adaptation, which is especially important when working with open-source tools.
Open-source analytics platforms often require significant investment in training and resources. Teams must prepare for steep learning curves and the need to develop custom solutions. Addressing legal and gdpr concerns early helps avoid future obstacles.
Providing thorough documentation and training reduces barriers to adoption. Automating complex installation steps and simplifying analytic workflows make it easier for organizations of any size to use these tools. Building a strong open-source community encourages knowledge sharing and supports cross-team collaboration.
Scalability
Scalability is vital for data-driven businesses that expect growth in data volume and user numbers. A scalable analytics platform adapts performance and cost to changing demands. Cloud-based storage offers horizontal scaling, which handles increasing data efficiently. On-premises storage, by contrast, faces hardware limits and vertical scaling constraints.
Multi-tenant architecture supports a diverse user base, allowing departments, customers, or partners to use the platform securely and independently. Flexible pricing models, such as per-workspace pricing, help organizations manage costs as user numbers grow.
Important scalability features:
Horizontal scaling for data storage
Multi-tenant support for secure, independent access
Efficient data processing (partitioning, parallel processing)
Integration with various applications and embedded analytics
Dynamic capacity adjustments
Self-service analytics capabilities enable users without technical backgrounds to access and analyze data, supporting broader adoption. Integration with communication tools and other business applications ensures the platform grows with the organization’s needs. Scalable platforms help teams make data-driven decisions even as data complexity increases.
Integration
Integration plays a crucial role when selecting an open-source analytics tool. Teams need to connect their analytics platforms with various data sources and business applications. A strong integration strategy ensures that data flows smoothly between systems, enabling accurate and timely insights.
Many open-source analytics tools offer pre-built connectors and support for APIs. These features allow users to link databases, cloud storage, and SaaS applications without extensive custom development. For example, platforms like Airbyte and Portable.io provide hundreds of ready-made connectors. These connectors help organizations pull data from sources such as databases, files, and cloud services. Apache NiFi and Apache Kafka focus on real-time data flow and streaming integration, which is essential for businesses that require up-to-the-minute analytics.
The following table summarizes how popular open-source and hybrid tools handle integration with data sources and business applications:
| Tool | Integration Types Supported | Key Features and Capabilities | Supported Data Sources and Applications |
| Airbyte | ELT pipelines, API connectors | 550+ pre-built connectors, supports structured & unstructured data, UI/API/Terraform support | Databases, APIs, files, data warehouses, platforms |
| Apache NiFi | Data flow automation, real-time streaming | Complex data routing, transformation, system mediation | Databases, APIs, files, cloud storage |
| Apache Kafka | Real-time streaming, event-driven | Streaming data for real-time analytics and IoT processing | Streaming data sources, event systems |
| dltHub | ELT pipelines, Python-based integration | Schema inference, integration with Airflow, Dagster, dbt, scalable micro-batching | REST APIs, SQL databases, cloud storage, Python |
| Celigo | iPaaS, low-code integration platform | Pre-built connectors for SaaS, real-time & scheduled syncs, API/webhook support | SaaS applications, cloud apps |
| Portable.io | Cloud-native ELT, SaaS connectors | No-code platform, fast connector deployment, supports major data warehouses | Niche SaaS applications |
Tip: Teams should evaluate whether a tool supports the data sources and applications they use most. Pre-built connectors and API support can save significant time and reduce integration costs.
Integration also affects scalability and flexibility. Tools that support both batch and real-time data processing can adapt to changing business needs. For example, Apache Kafka enables real-time integration for streaming analytics, while Airbyte and dltHub handle scheduled data loads. Organizations benefit from choosing analytics platforms that offer both types of integration.
When planning for integration, teams should consider future needs. As businesses grow, new data sources and applications may become important. Selecting a tool with a wide range of integration options ensures long-term success and reduces the need for costly migrations.
Support
Support is a key factor in the successful adoption of open-source analytics tools. Organizations must assess both community and commercial support options before making a decision. Community support often includes forums, documentation, and user-contributed plugins. These resources help users solve problems and learn best practices.
Many leading open-source analytics tools have large, active communities. For example, Apache Superset, Metabase, and Grafana offer extensive documentation and active forums. Users can find guides, tutorials, and API references created by both developers and other users. This community-driven approach encourages knowledge sharing and rapid problem-solving.
The table below highlights the support features available for popular open-source analytics tools:
| Tool | Community Support Features | Commercial Support Features |
| PostHog | Large active community, forums, GitHub issues, documentation | Offers commercial/enterprise services |
| Metabase | Active developer/user community, forums, documentation | Commercial support and services available |
| Countly | Dedicated community, documentation | Enterprise version with extra features |
| Umami | Active community, documentation, community plugins | N/A |
| Plausible Analytics | Active community, documentation, forums | Free trial and affordable pricing plans |
| Apache Superset | Large active community, forums, documentation | N/A |
| Grafana | Large active community, forums, documentation, plugins | N/A |
| Redash | Active community, forums, documentation, plugins | N/A |
| Open Web Analytics | Dedicated community, documentation | N/A |
Note: Community support can be enough for many organizations, especially those with technical expertise. However, businesses with strict uptime or compliance needs may prefer tools that offer commercial support or enterprise services.
Commercial support provides additional benefits, such as guaranteed response times, dedicated help, and advanced features. Some tools, like Metabase and PostHog, offer paid support plans for businesses that need extra assurance. These plans often include onboarding assistance, custom development, and priority bug fixes.
When evaluating support, teams should consider their internal expertise and the complexity of their analytics needs. A strong community can help solve most issues, but commercial support may be necessary for mission-critical deployments.
Open Source Reporting Software Tips
Best Practices
Organizations that want to maximize the value of open source reporting software should follow several best practices. Open source reporting software offers flexibility, transparency, and cost savings. Teams can customize open source reporting software to fit unique business needs. To get the most from open source reporting software, users should focus on planning, security, and collaboration.
Define Clear Objectives
Teams should set clear goals for their open source reporting software projects. They need to identify what reporting capabilities are most important. This helps guide tool selection and workflow design.Standardize Data Sources
Consistent data sources improve the accuracy of open source reporting software. Teams should document all data connections and ensure that reporting capabilities remain reliable.Automate Data Refreshes
Open source reporting software can automate data updates. Automation ensures that reporting capabilities deliver current information. This is especially important for real-time reporting.Promote Collaboration
Open source reporting software supports teamwork. Teams should share dashboards and reports to encourage data-driven decisions. Collaboration improves the overall effectiveness of reporting capabilities.Invest in Training
Training helps users unlock the full potential of open source reporting software. Regular workshops and documentation reviews keep skills sharp and reporting capabilities strong.Monitor Performance
Teams should track the performance of open source reporting software. Monitoring helps identify slow queries or bottlenecks. This ensures that reporting capabilities stay efficient.
Tip: Regularly update open source reporting software to benefit from new features and security patches. Staying current protects reporting capabilities and reduces risk.
Common Pitfalls
Many organizations encounter challenges when deploying open source reporting software. Avoiding these pitfalls helps maintain strong reporting capabilities and ensures long-term success.
Teams sometimes neglect to maintain and update open source reporting software. Outdated software can become vulnerable and lose key reporting capabilities.
Lack of visibility into transitive dependencies creates hidden risks. Teams may not realize all the components their open source reporting software relies on.
Failing to use Software Bills of Materials (SBOMs) makes it hard to manage software risk. SBOMs help track every part of open source reporting software.
License compliance issues often arise, especially with transitive dependencies. Over half of audited applications face conflicts that can affect reporting capabilities.
Weak secure coding practices, such as poor input validation, increase the risk of attacks. This can compromise open source reporting software and its reporting capabilities.
Some organizations do not integrate open source management into their software development lifecycle. This oversight can lead to operational and security problems.
Skipping the use of Software Composition Analysis (SCA) tools, SBOMs, and continuous monitoring leaves open source reporting software exposed to threats.
Note: Proactive management of open source reporting software reduces risk and keeps reporting capabilities robust. Regular updates, strong documentation, and security checks are essential.
A table can help summarize the most common pitfalls and their impact on open source reporting software:
| Pitfall | Impact on Reporting Capabilities |
| Outdated software | Reduced security and lost features |
| Hidden dependencies | Increased vulnerability |
| No SBOMs | Poor risk management |
| License conflicts | Legal and operational issues |
| Weak secure coding | Higher risk of attacks |
| Lack of lifecycle integration | Operational and security risks |
| No SCA or monitoring | Unaddressed vulnerabilities |
By following best practices and avoiding common pitfalls, organizations can ensure their open source reporting software delivers reliable, secure, and effective reporting capabilities.
Open-source analytics tools offer organizations flexibility, innovation, and strong financial returns. Many companies report positive ROI and operational improvements after adopting these platforms.
Over half of organizations using open-source AI tools see higher financial returns than those using proprietary solutions.
Unified analytics platforms can reduce manual work by 80% and save millions annually.
Readers should assess their data needs, explore documentation, and join user communities. Starting a pilot project helps teams discover the best fit. Share feedback or experiences in the comments to support others on their analytics journey.
FAQ
What are open-source data analytics tools?
Open-source data analytics tools are software platforms that allow users to analyze, visualize, and report on data. Developers and organizations can access, modify, and share the source code freely. These tools often have strong community support and frequent updates.
Are open-source analytics tools secure?
Most open-source analytics tools offer strong security features. Users can review the source code for vulnerabilities. Many projects receive regular security updates from active communities. Organizations should always follow best practices for configuration and access control.
Can small businesses use open-source analytics tools?
Yes, small businesses can benefit from open-source analytics tools. These platforms often have low or no licensing costs. Many tools provide user-friendly interfaces and require minimal setup. Small teams can start with basic features and scale as their needs grow.
How do open-source tools compare to paid analytics solutions?
Open-source tools provide flexibility, transparency, and cost savings. Paid solutions may offer more polished interfaces and dedicated support. Open-source platforms often require more technical expertise but allow greater customization and control.
What skills do teams need to use open-source analytics tools?
Teams should have basic data analysis and technical skills. Familiarity with SQL, Python, or R helps unlock advanced features. Many tools offer no-code options for beginners. Training and community resources can help users build confidence.
How can organizations get support for open-source analytics tools?
Most open-source projects have active forums, documentation, and user groups. Some tools offer commercial support plans for businesses that need guaranteed help. Community support often resolves common issues quickly.
Which open-source analytics tool is best for machine learning?
KNIME, Python with libraries, and Orange Data Mining stand out for machine learning tasks. These tools provide built-in algorithms, visual workflows, and integration with popular ML libraries. Teams can experiment and deploy models without high costs.
Subscribe to my newsletter
Read articles from Community Contribution directly inside your inbox. Subscribe to the newsletter, and don't miss out.
Written by