A Complete Guide to Data Collection Techniques and Tools in 2025
 Community Contribution
Table of contents
- Key Takeaways
- Data Collection Overview
- Types of Data
- Data Collection Techniques
- Data Collection Methods
- Data Collection Tools in 2025
- Data Collection Process
- Practical Tips and Examples
- FAQ
- What is the difference between data collection techniques and methods?
- How do organizations ensure ethical data collection in 2025?
- Which data collection tool is most cost-effective for small businesses?
- Can AI improve data quality during collection?
- What is the best way to collect real-time data?
- How do researchers choose between qualitative and quantitative data collection?
- Are paper surveys still relevant in 2025?

Organizations in 2025 rely on advanced Data Collection Techniques to drive innovation and competitive advantage. Data collection refers to the process of gathering, validating, and analyzing information for research, business, and analytics. Selecting the right method depends on the data type and context. Widely adopted approaches include surveys, interviews, document processing, digital tracking, and automated extraction. Popular platforms such as Jotform, SurveyMonkey, and Typeform streamline workflows with AI, cloud integration, and automation. Effective data collection improves trust, governance, and business outcomes, supporting predictive analytics and actionable insights. Professionals must consider efficiency, cost-effectiveness, and ethical responsibilities at every stage.
Key Takeaways
Data collection gathers information to support decisions using primary (new) or secondary (existing) data.
Choosing the right method depends on your goals, data type, and resources for accurate and useful results.
Surveys, interviews, focus groups, observations, and experiments are common techniques with unique strengths.
Modern tools use AI, automation, and real-time analytics to improve data quality and speed.
Ethical practices like informed consent and data security are essential to protect participants and build trust.
Clear objectives and well-designed instruments ensure relevant, reliable data collection.
Regular quality checks and staff training help maintain accuracy and reduce errors.
Avoid common mistakes by simplifying forms, validating data, collaborating, and analyzing results continuously.
Data Collection Overview
What Is Data Collection
Data collection refers to the systematic process of gathering information to answer specific questions or solve problems. Organizations and researchers use data collection to obtain facts, figures, and insights that guide decision-making. The process involves selecting appropriate methods and tools to capture both quantitative and qualitative data. Primary data collection occurs when individuals collect new information directly from sources. Secondary data collection uses existing records or datasets from internal or external sources.
Tip: Choosing the right data collection category depends on the research objective, available resources, and the type of data needed.
| Category | Definition | Examples / Characteristics |
| Primary Data Collection | Data collected firsthand, specific to the research purpose, highly accurate and current. | Quantitative: numerical data, surveys, polls, statistical analysis to quantify phenomena. |
Qualitative: interviews, focus groups, observations to understand attitudes and behaviors. |
| Secondary Data Collection | Data previously collected and used, obtained from internal or external sources. | Internal: health records, financial statements, sales reports, CRM data.
External: government reports, press releases, business journals, libraries, internet. |
Understanding these categories helps professionals select the most effective data collection strategy for their goals.
Importance of Data Collection
The importance of data collection lies in its ability to provide reliable evidence for decision-making. Accurate data collection supports organizations in measuring outcomes, evaluating interventions, and improving processes. High-quality data collection ensures that results reflect reality, reducing bias and increasing validity. Organizations that prioritize the importance of data collection achieve better governance, compliance, and strategic planning.
Systematic data collection methods include surveys, interviews, and social media metrics.
Responsive feedback uses ongoing data collection to adjust programs quickly.
Clear documentation of data collection methods increases transparency and reliability.
Statistical standards highlight the importance of data collection in organizational success:
| Standard Aspect | Description |
| Control Conditions | At least one control group must be included to compare intervention effects. |
| Random Assignment | Minimizes bias and allows valid statistical inference of intervention effects. |
| Psychometrically Sound Measures | Validity and reliability of measures must be reported to ensure data quality. |
| Implementation Quality Reporting | Measurement and reporting of intervention delivery, adherence, and exposure levels. |
| Cost-effectiveness Reporting | Clear cost information must be provided to assess practical impact. |
| Long-term Follow-up | Outcomes must be measured beyond intervention end to assess sustained effects. |
| Addressing Missing Data | Patterns and extent of missing data must be reported and handled appropriately. |
Organizations that follow these standards in data collection improve outcomes and build trust with stakeholders.
Trends in 2025
Data collection in 2025 reflects rapid technological advancement and changing business needs. Artificial intelligence and machine learning automate many data collection tasks, increasing efficiency and accuracy. Real-time analytics allow organizations to process and analyze data instantly, which is vital in healthcare and finance. Edge computing processes data near its source, reducing latency and improving security. Embedded analytics integrate data collection into everyday workflows, making insights more accessible.
AI and machine learning automate data collection and processing.
Real-time data collection supports immediate decision-making.
Edge computing reduces bandwidth costs and enhances security.
Natural language processing expands data sources and improves strategic decisions.
Data mesh decentralizes governance, fostering collaboration.
Data-as-a-Service democratizes access to advanced analytics tools.
Agentic AI systems enable autonomous decision-making.
Leading analytics firms predict that nearly 65% of organizations will adopt AI-driven data collection by 2025. Data collection will continue to evolve, with sustainability, collaboration, and continuous intelligence shaping future practices.
Types of Data
Understanding the types of data is essential for selecting the most effective types of data collection methods. Researchers and business analysts must align their approach with the nature of the data and the research question. This alignment ensures methodological coherence and maximizes the value of insights.
| Research Paradigm | Data Type | Typical Research Question | Implication for Data Collection |
| Positivism | Quantitative | What proportion or measurable aspect exists? | Requires structured, measurable data collection methods like surveys or experiments |
| Interpretivism | Qualitative | How do people experience or interpret phenomena? | Needs flexible, open-ended methods such as interviews or focus groups |
Qualitative Data
Features
Qualitative data captures rich, contextual insights into motivations, frustrations, and mental models. This data type often includes words, images, and observations. Analysts use qualitative data collection methods such as interviews, focus groups, and open-ended survey responses to explore "how" and "why" questions. These methods allow researchers to collect qualitative data that reveals underlying attitudes and experiences.
| Data Type | Role in Research | Importance for Data Collection Techniques |
| Qualitative | Provides rich, contextual insights into motivations, frustrations, and mental models | Requires methods like interviews or usability testing to capture detailed user experiences and explanations |
Use Cases
Focus groups exploring consumer opinions about a new product
Interview transcripts detailing employee experiences during organizational change
Open-ended survey responses describing customer motivations
Note: Qualitative data collection methods excel when researchers seek to understand complex behaviors or perceptions.
Quantitative Data
Features
Quantitative data consists of numerical values and measurable patterns. Researchers use quantitative data collection methods such as structured surveys, experiments, and statistical measurements to answer questions like "how many?" or "what proportion?" These methods help analysts collect quantitative data efficiently and at scale.
| Data Type | Role in Research | Importance for Data Collection Techniques |
| Quantitative | Reveals measurable patterns and trends at scale | Needs structured methods such as surveys or A/B testing to gather statistically valid data |
Use Cases
Surveys measuring customer satisfaction scores
Experiments testing the effectiveness of marketing campaigns
Statistical data tracking website conversion rates
Tip: Organizations often use quantitative data collection methods to validate qualitative insights and ensure generalizability.
Mixed Methods
When to Use
A mixed-method approach integrates both qualitative and quantitative data to offer a holistic understanding. Researchers use this approach when they need both depth and breadth in their analysis. For example, a study on adolescent alcohol use may begin with in-depth interviews and observations, then follow up with quantitative surveys for broader measurement.
Benefits
| Advantage | Explanation | Implication for Data Collection |
| Generalizability | Quantitative data’s large sample sizes provide external validity | Guides selection of quantitative methods to validate qualitative insights |
| Contextualization | Qualitative data adds rich detail and context to quantitative findings | Encourages combining methods to deepen understanding beyond numbers alone |
| Credibility | Using multiple methods strengthens validity when findings converge | Promotes designing studies that integrate data types to cross-verify results |
Mixed-method approach provides flexibility, broader research question coverage, and stronger evidence.
Businesses often combine deep qualitative interviews with broad quantitative surveys to gain actionable insights.
Block Quote: Recognizing the strengths of each data type helps organizations choose types of data collection methods that are purposeful, efficient, and aligned with their goals.
Data Collection Techniques
Surveys
Surveys remain one of the most widely used data collection techniques in 2025. Organizations rely on surveys to gather structured information from large groups efficiently. The evolution of technology has transformed survey delivery, making them more accessible and effective across multiple platforms.
Online
Online surveys use web-based platforms to reach participants through email, social media, or embedded website forms. These data collection methods offer scalability and automation, allowing researchers to analyze results in real time. Personalization and clear communication of survey purpose have become essential for boosting engagement. Multi-channel follow-up campaigns, which combine email, SMS, and in-app notifications, can increase response rates significantly. For example, companies like Uber have achieved up to 55% response rates by engaging users on their preferred platforms.
| Survey Type / Placement | Response Rate Range | Additional Notes |
| Email Surveys | 15–25% (2025 benchmarks) | Personalization and timing improve results |
| In-App Surveys | 20–30% | Placement within apps affects rates |
| Web-App Modal Pop-Ups | ~40% completion | Central modals outperform corner placements |
| Passive Tab Surveys | 3–5% | Lowest engagement; requires user initiation |
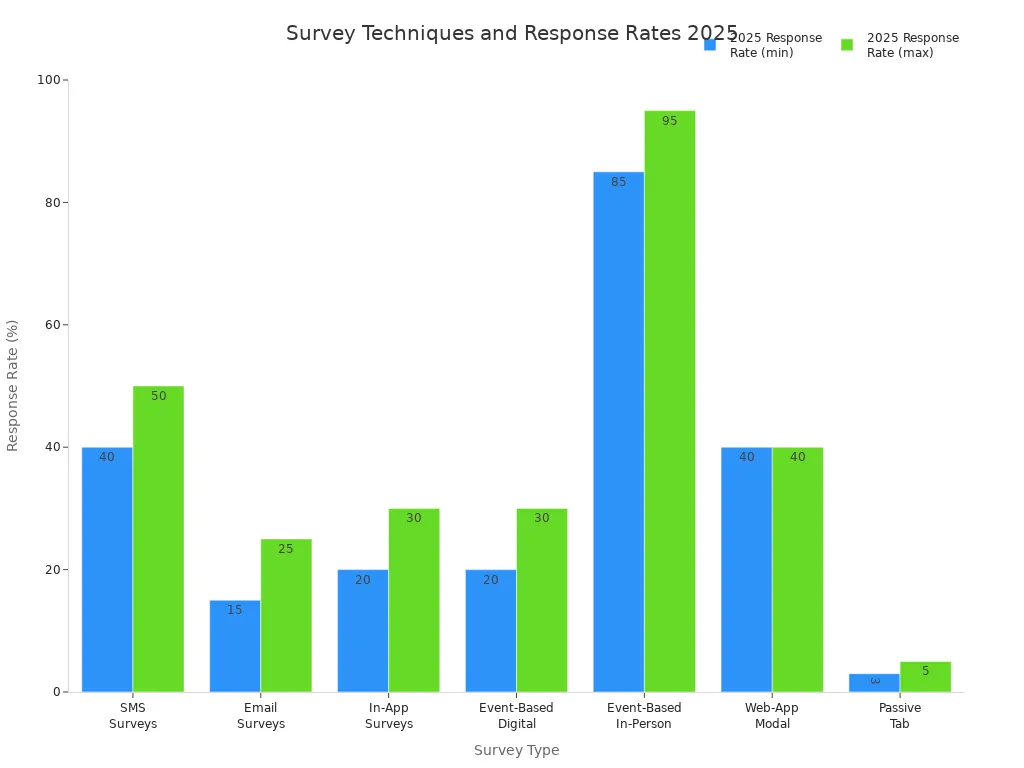
Tip: Short surveys (under 7 minutes, ideally 1-3 questions) achieve completion rates over 80%. Visual elements like progress bars can boost engagement by up to 94%.
Mobile
Mobile surveys have become a dominant force among data collection techniques. They reach respondents directly on smartphones or tablets, increasing accessibility and reducing dropout rates. In 2025, 30-60% of respondents complete surveys on mobile devices. SMS surveys consistently achieve the highest response rates, ranging from 40% to 50%. These data collection methods excel in situations where quick feedback is needed, such as customer satisfaction checks after service interactions.
| Survey Technique | Typical Response Rate Range | Notes and Effectiveness Highlights |
| SMS Surveys | 40–50% | Highest response rates; mobile-first focus |
| Multi-Channel Campaigns | Up to 55% | Combining channels boosts rates |
| Incentivized Surveys | Can double response rates | Immediate incentives matched to survey length |
Note: Incentives, when matched to survey length and delivered immediately, can double response rates. Sharing survey results with respondents encourages future participation and builds trust.
Paper
Paper surveys represent a traditional approach among data collection methods. They remain valuable in environments with limited internet access or where digital literacy is low. Paper surveys are often used in field research, healthcare settings, or educational assessments. While they offer inclusivity, they require manual data entry, which can delay analysis and increase costs. Response rates for paper surveys vary but often depend on the context and the presence of incentives.
Pros:
Reach populations without digital access
Allow for detailed, open-ended responses
Cons:
Manual data entry increases time and cost
Risk of data loss or incomplete responses
Interviews
Interviews serve as one of the most flexible and insightful data collection techniques. They allow researchers to probe deeply into attitudes, motivations, and experiences. Interviews can collect both quantitative and qualitative data, making them suitable for a wide range of research objectives.
Structured
Structured interviews use a fixed set of questions, ensuring consistency across all participants. This approach supports quantitative analysis and comparison. Organizations often use structured interviews in large-scale hiring or standardized research studies.
Best Use Scenarios:
Large-scale employee selection
Academic research requiring comparability
Pros:
Consistent data for statistical analysis
Reduces interviewer bias
Cons:
Limited flexibility for follow-up questions
May miss nuanced insights
Semi-Structured
Semi-structured interviews blend fixed questions with opportunities for open-ended responses. This method allows interviewers to explore emerging themes while maintaining some structure. Semi-structured interviews are common in program evaluations and exploratory research.
Best Use Scenarios:
Program evaluations
Market research exploring new trends
Pros:
Balances consistency and flexibility
Enables probing for deeper understanding
Cons:
Requires skilled interviewers
Analysis can be time-consuming
Unstructured
Unstructured interviews offer maximum flexibility, with questions evolving based on participant responses. Researchers use this approach to explore complex or sensitive topics in depth. Individual student interviews often use unstructured formats to understand unique experiences.
Best Use Scenarios:
Case studies
Sensitive topics requiring trust
Pros:
Captures rich, detailed narratives
Adapts to participant needs
Cons:
Difficult to compare across participants
High potential for interviewer bias
Note: Interviews provide flexibility and depth, allowing probing of complex issues. They reduce certain biases compared to focus groups and enable more candid responses. However, interviews are time-consuming, costly, and less practical for large populations.
Focus Groups
Focus groups stand out among data collection techniques for their ability to generate rich thematic content through group dynamics. Researchers use focus groups to explore collective attitudes, social influences, and emerging themes in real time.
In-Person
In-person focus groups bring participants together in a physical setting. This format encourages interaction, debate, and consensus-building. In-person focus groups often achieve the highest completion rates, with event-based surveys reaching 85–95% when conducted immediately after an event.
| Criteria | Focus Groups (FGs) | In-depth Interviews (IDIs) |
| Data Richness | Rich data from group dynamics, consensus, and social influences; captures collective attitudes. | Provides deeper, nuanced individual insights and detailed personal narratives. |
| Cost and Time | More time-efficient by engaging multiple participants simultaneously; higher costs due to moderation and venue. | More time-consuming per participant; potentially cost-effective for small samples but higher per participant cost. |
| Flexibility | Flexible in generating diverse ideas but less adaptable to individual needs. | Highly flexible, allowing real-time adaptation to participant responses. |
Pros:
Collect data from multiple participants at once
Generate comprehensive insights through group interaction
Cons:
Moderation and venue costs can be high
Groupthink may influence responses
Virtual
Virtual focus groups use video conferencing platforms to connect participants remotely. This approach saves on travel costs and increases accessibility, especially for geographically dispersed groups. Online focus groups produce similar thematic richness compared to in-person sessions, though participants may rate the experience lower on some measures.
Best Use Scenarios:
National or international research
Projects with limited travel budgets
Pros:
Reduces logistical barriers
Enables participation from diverse locations
Cons:
May require technical support
Some participants may feel less engaged
Focus groups offer flexibility and adaptability, allowing researchers to explore emerging themes in real time. They provide rich, comprehensive data through group interaction and immediate feedback, balancing cost and efficiency by gathering multiple perspectives at once.
Observations
Observation stands as a foundational approach among data collection methods. Researchers use this technique to gather information by watching subjects in their natural environments. This approach uncovers behaviors, patterns, and interactions that surveys or interviews may miss. Observational data collection techniques provide unique insights, especially when studying actions rather than opinions.
Direct
Direct observation involves watching subjects without participating in the activity. The observer remains separate, recording events as they happen. This method works well in structured settings, such as classrooms, hospitals, or manufacturing lines. Researchers often use checklists or rating scales to ensure consistency.
Best-use scenarios for direct observation include:
Monitoring quality assurance in healthcare and manufacturing
Studying classroom behavior or teaching methods
Tracking consumer actions in retail environments
Assessing safety and compliance in public spaces
Direct observation helps identify trends and patterns that other data collection methods may overlook. It provides rich contextual information, supporting decision-making and prediction. However, this approach can introduce observer bias and may not capture internal motivations.
Participant
Participant observation requires the researcher to become part of the group or environment being studied. This immersive approach allows for a deeper understanding of social dynamics, motivations, and cultural norms. Ethnographers and anthropologists often use participant observation to study communities or organizations.
Advantages of participant observation:
Reveals hidden behaviors and informal practices
Builds trust, leading to more authentic data
Provides context for interpreting actions and events
Challenges include:
Risk of losing objectivity
Ethical concerns about disclosure and consent
Time-intensive process
In 2025, observational data collection methods remain highly effective for understanding human behavior in natural settings. They support research in environmental science, market analysis, safety monitoring, and longitudinal studies. Despite challenges like bias and data complexity, these techniques offer perspectives that complement other data collection techniques.
Tip: Combining observation with other data collection methods, such as interviews or document analysis, can strengthen research findings and reduce bias.
Experiments
Experiments represent a powerful category of data collection methods. Researchers use experiments to test hypotheses, establish causality, and measure the effects of interventions. Experimental designs vary in complexity, but all involve manipulating variables and observing outcomes.
Controlled
Controlled experiments take place in a structured environment where researchers manage all variables except the one being tested. This approach allows for precise measurement and strong causal inference. Randomized Controlled Trials (RCTs) are the gold standard in many fields, including medicine, psychology, and education.
Key features of controlled experiments:
Random assignment to control and experimental groups
Manipulation of independent variables
Measurement of dependent variables
Advantages:
High internal validity
Strong evidence for cause-and-effect relationships
Limitations:
May lack real-world applicability
Can be expensive and time-consuming
Researchers also use single-subject designs, cross-over trials, and simulations as part of their experimental toolkit. These data collection techniques provide flexibility and detailed analysis, especially when studying individual responses.
| Design Type | Research Question Addressed | Advantages | Disadvantages |
| Pre-experimental (AB) | Does outcome change from baseline with intervention? | Quick, efficient, suitable for low-stakes decisions | Lacks control for internal validity threats; not a true experimental design |
| Withdrawal (ABA/ABAB) | Does outcome covary with introduction and withdrawal of intervention? | Easy to implement; strong control when effects are immediate and large | Ethical concerns withdrawing effective treatment; not all behaviors reversible |
| Multiple-baseline/multiple-probe | Does outcome change across participants, behaviors, or settings with intervention? | No need to withdraw intervention; suitable for nonreversible behaviors | Ethical concerns about prolonged baseline; requires comparable conditions for replication |
| Changing-criterion | Do changes in outcome correspond to changes in intervention criteria? | No reversal needed; good for gradual behavior change; useful for consequence-based interventions | Requires graduated steps; not for immediate change behaviors; needs incentive-based interventions |
| Multiple-treatment | What are relative effects of multiple interventions on outcome? | Can compare many interventions; useful for component analysis | Requires reversible behaviors; complex and time-consuming; susceptible to treatment interference |
| Alternating treatments | What are relative effects of interventions compared to each other and baseline? | Can provide strong evidence quickly | Requires reversible behaviors; susceptible to treatment interference |
| Adapted alternating treatments | What are relative effects of interventions on different outcomes? | Less treatment interference; strong evidence in few sessions; no reversal needed | Requires comparable behaviors/stimuli; consider generalization across behaviors |
A multiple-baseline design, for example, can show immediate and lasting effects of an intervention, as seen in studies with children with autism. These designs allow researchers to demonstrate strong causal relationships and maintain ethical standards.
Field Trials
Field trials move experiments into real-world settings. Researchers apply interventions in natural environments, such as schools, communities, or workplaces. This approach increases external validity and tests how interventions perform outside the lab.
Benefits of field trials:
Reflect real-world conditions
Engage diverse populations
Identify practical challenges and barriers
Drawbacks:
Less control over variables
Potential for confounding factors
Field trials often use a mix of data collection methods, including surveys, observations, and interviews, to gather comprehensive results. These trials play a crucial role in public health, education, and product development.
Note: Combining controlled experiments with field trials provides both strong evidence for causality and practical insights for implementation.
Document Analysis
Document analysis serves as a systematic data collection method for reviewing and evaluating written, visual, or digital materials. Researchers use this approach to provide context, generate questions, and supplement other data collection techniques.
Manual
Manual document analysis involves close reading and interpretation of materials such as reports, policy documents, meeting minutes, or archival records. Researchers extract relevant information, code themes, and compare findings across sources.
Applications:
Policy analysis and evaluation
Historical research
Legal case reviews
Strengths:
Provides historical and contextual depth
Supports triangulation with other data collection methods
Limitations:
Time-consuming
Subject to researcher bias and interpretation
Researchers often use the READ approach: ready materials, extract data, analyze data, and distill findings. This process ensures rigor and transparency.
Automated
Automated document analysis leverages technology to process large volumes of text, images, or multimedia files. Tools use natural language processing, machine learning, and AI to identify patterns, extract data, and generate insights.
Advantages:
Handles big data efficiently
Reduces manual labor and speeds up analysis
Enhances consistency and scalability
Challenges:
May miss nuanced or context-specific information
Relies on quality of algorithms and training data
Automated document analysis supports real-time monitoring, policy tracking, and sentiment analysis. However, researchers must remain aware of limitations related to validity, reliability, and authenticity. Triangulation with other data collection methods helps address these concerns.
Tip: Document analysis works best when combined with interviews, observations, or quantitative data, providing a fuller picture and improving research validity.
Transactional Tracking
Transactional tracking stands as a cornerstone among data collection methods in sectors like e-commerce, retail, and financial services. This approach involves capturing and analyzing every customer transaction, including purchases, returns, and payment details. Businesses use transactional tracking to gain real-time insights into sales performance, customer preferences, and operational efficiency.
Advantages of Transactional Tracking:
Enables better business decisions by providing clear sales and financial insights. For example, managers can adjust staffing based on peak sales periods.
Offers deep customer understanding by revealing demographics, shopping behavior, and preferred payment methods.
Improves conversion rates through relevant product recommendations and dynamic pricing strategies.
Supports behavioral analysis, allowing companies to predict future purchases using machine learning.
Facilitates customer segmentation for targeted promotions and personalized experiences.
Disadvantages and Challenges:
Managing large volumes of complex transactional data requires advanced tools and skilled analysts, especially for multinational organizations.
Integrating data from multiple sources, such as online stores and physical locations, can lead to misinterpretations if not handled carefully.
Data privacy concerns demand strict compliance with regulations like GDPR and transparent practices.
Overreliance on historical data may result in outdated strategies, particularly in fast-changing industries.
Ensuring data quality and accuracy is critical; errors can lead to poor business decisions.
Tip: Regular data validation and careful analysis help prevent misinterpretation and maintain the integrity of transactional tracking as one of the most reliable data collection methods.
Social Media Monitoring
Social media monitoring has become an essential component of modern data collection methods. Organizations track conversations, mentions, and engagement across platforms like Twitter, Facebook, Instagram, and LinkedIn. This technique provides real-time feedback on brand reputation, customer sentiment, and emerging trends.
| Tool Name | Key Features and Usage | Benefits for Data Collection and Monitoring |
| Sprout Social | Tracks interactions, engagement, and content performance; competitor insights | Real-time tracking, sentiment scoring, campaign ROI measurement |
| Mention | Monitors over 1 billion sources; filters noise; alerts for spikes in mention volume | Early detection of social media crises and PR opportunities |
| Keyhole | Keyword and hashtag analytics; influencer identification | Tracks topic-related conversations and finds relevant influencers |
| HubSpot | CRM integration; tracks social interactions correlated with sales | Measures social media ROI and content impact on sales |
| Brand24 | Sentiment analysis; instant notifications; trending hashtag detection | Tracks brand mentions, detects spikes in activity, supports PR efforts |
| Atribus | Consumer intelligence; sentiment analysis; classifies mentions | Identifies customer complaints and unmet needs for proactive brand response |
| Zoho Social | Custom listening dashboards; CRM integration; multi-channel monitoring | Comprehensive PR and social presence insights |
| Awario | Monitoring and listening; identifies recommendation requests | Supports active business development by responding to customer needs |
| Cyfe | Custom dashboards; tracks key social media metrics; data visualizations | Centralizes social KPIs and simplifies reporting |
These tools collect and analyze vast amounts of social data, enabling organizations to monitor brand health, benchmark against competitors, and optimize marketing strategies. Social media monitoring also supports crisis management by providing early alerts for spikes in negative mentions or trending topics.
Note: Social media monitoring, when integrated with other data collection methods, offers a comprehensive view of public perception and market dynamics.
Modern Techniques
Innovative data collection methods have transformed the landscape in 2025. These approaches leverage technology to improve efficiency, accuracy, and scalability.
API-Based
API-based data collection methods use Application Programming Interfaces to automate the retrieval of data from external systems. APIs enable seamless integration with platforms such as payment gateways, CRM systems, and social networks. This technique reduces manual effort, ensures data consistency, and supports real-time analytics.
Best-use scenarios:
Aggregating financial transactions from multiple banks
Syncing customer data between e-commerce and marketing platforms
Event Streaming
Event streaming captures and processes data as it occurs, often using platforms like Apache Kafka or AWS Kinesis. Organizations use event streaming to monitor user actions, system events, and IoT sensor data in real time. This method supports rapid decision-making and immediate response to critical incidents.
Benefits:
Enables real-time fraud detection in banking
Supports live monitoring of supply chain logistics
Webhooks
Webhooks provide a lightweight way to receive data updates automatically when specific events occur. For example, a webhook can notify a business when a customer completes a purchase or submits a support ticket. This approach reduces polling and improves the timeliness of data collection.
Applications:
Automating order fulfillment notifications
Triggering customer feedback surveys after transactions
Log Data
Log data collection methods involve capturing system-generated records from servers, applications, and devices. Logs provide valuable insights into user behavior, system performance, and security events. Automated log analysis tools use AI to detect anomalies and optimize operations.
Use cases:
Monitoring website traffic and error rates
Detecting cybersecurity threats
Photovoice
Photovoice empowers participants to capture and share images that represent their experiences or perspectives. Researchers use this participatory method to collect qualitative data, especially in community-based projects. Photovoice encourages engagement and provides visual context that traditional surveys may miss.
Advantages:
Gives voice to underrepresented groups
Enhances storytelling and advocacy
Crowdsourcing
Crowdsourcing leverages the collective input of large groups, often through online platforms or mobile apps. Organizations use crowdsourcing to gather data quickly and at scale, such as mapping disaster zones or collecting product feedback.
Key benefits:
Increases data volume and diversity
Reduces operational costs by distributing tasks
Passive Collection
Passive data collection methods gather information without direct user input. Examples include wearable devices tracking health metrics, mobile apps recording location data, and smart sensors monitoring environmental conditions. Passive collection minimizes respondent burden and provides continuous, high-frequency data.
Emerging trends:
Wearable technologies collect detailed user data for personalized experiences.
Edge computing processes data near its source, reducing latency and bandwidth usage.
Blockchain ensures data integrity and transparency.
Organizations improve efficiency by adopting these modern data collection methods. AI and machine learning automate operations, while computer vision and GIS enhance data quality and targeting. Outsourcing and prepackaged datasets further reduce costs and streamline large-scale projects.
Data Collection Methods
Understanding data collection methods is essential for researchers and organizations aiming to gather reliable information. These methods fall into two main categories: primary and secondary. Each category offers unique advantages and challenges, making it important to select the right approach for specific research goals.
Primary Methods
Primary data collection methods involve gathering original information directly from sources. Researchers design these methods to address specific questions, ensuring the data is current and relevant. The most common primary data collection methods include surveys, interviews, focus groups, observations, and experiments.
Surveys
Surveys stand out as one of the most efficient data collection methods for reaching large groups. Researchers use structured questionnaires to collect information on opinions, behaviors, or demographics. Surveys can be distributed online, by phone, through mail, or in person.
Strengths:
Surveys allow for fast data collection from broad geographic and demographic samples.
They offer cost-effectiveness and scalability, making them suitable for large studies.
Standardized questions ensure reliability and consistency across responses.
Researchers can easily analyze and compare results.
Limitations:
Surveys may lack depth, especially when using closed-ended questions.
Inflexibility can arise, as questions cannot be changed once distributed.
Low response rates or biased answers can affect data quality.
Poorly worded questions may lead to misinterpretation.
Tip: Clear, concise questions and thoughtful survey design improve response rates and data accuracy.
Interviews
Interviews provide in-depth insights into participants' perspectives and experiences. This method can be structured, semi-structured, or unstructured, depending on the research objective.
Strengths:
Interviews enable researchers to explore complex issues and gather detailed qualitative data.
They allow for clarification and follow-up questions, leading to richer information.
Flexibility in format supports a range of research topics.
Limitations:
Conducting interviews can be time-consuming and resource-intensive.
Data analysis may require significant effort due to the volume and complexity of responses.
Interviewer bias can influence results if not carefully managed.
Focus Groups
Focus groups bring together small groups to discuss specific topics. Researchers use this method to observe group dynamics and collect diverse viewpoints.
Strengths:
Focus groups generate rich, thematic data through group interaction.
They reveal social influences and consensus-building processes.
Multiple perspectives emerge quickly, saving time compared to individual interviews.
Limitations:
Groupthink may affect the authenticity of responses.
Skilled moderation is necessary to manage discussions and avoid dominance by certain participants.
Scheduling and logistics can be challenging.
Observations
Observation involves watching subjects in their natural environment to record behaviors and interactions. This method can be direct or participant-based.
Strengths:
Observations capture real-world actions that surveys or interviews might miss.
They provide context and detail about processes or environments.
Useful for studying non-verbal cues and group dynamics.
Limitations:
Observer bias can affect the accuracy of findings.
The presence of an observer may influence behavior.
Observations can be time-consuming and may not reveal internal motivations.
Experiments
Experiments test hypotheses by manipulating variables and observing outcomes. Researchers use controlled or field settings to establish cause-and-effect relationships.
Strengths:
Experiments offer high accuracy and control over variables.
They provide strong evidence for causality.
Customizable designs address specific research needs.
Limitations:
Experiments can be costly and labor-intensive.
Results may not always generalize to real-world settings.
Ethical considerations may limit experimental options.
Researchers choose primary data collection methods for their accuracy, specificity, and control. However, these methods often require significant resources and careful planning.
Secondary Methods
Secondary data collection methods rely on existing information gathered by others. Researchers analyze published or unpublished sources such as government records, academic articles, or business reports. These methods offer speed and cost savings but may present challenges in relevance and quality.
Document Analysis
Document analysis involves reviewing written, visual, or digital materials to extract relevant information. Researchers use this method to provide context, support findings, or generate new questions.
Strengths:
Document analysis saves time and resources, as data is already available.
It offers access to historical and contextual information.
Researchers can use a wide variety of sources, including reports, policies, and archives.
Limitations:
Lack of control over data quality and collection methods can introduce bias.
Data may be outdated or not tailored to current research needs.
Interpretation depends on the researcher's skill and understanding.
Record Analysis
Record analysis examines existing datasets, such as health records, financial statements, or sales reports. This method supports large-scale studies and trend analysis.
Strengths:
Record analysis provides access to large, comprehensive datasets.
It enables longitudinal studies and comparisons over time.
Cost-effectiveness and efficiency make it attractive for many projects.
Limitations:
Data may not align perfectly with the research question.
Researchers may face restrictions on data access or privacy concerns.
Quality and completeness of records can vary.
Note: Researchers should evaluate secondary data based on relevance, reliability, timeliness, and accuracy to ensure meaningful results.
Comparing Primary and Secondary Data Collection Methods
| Aspect | Primary Data Collection | Secondary Data Collection |
| Source of Data | Data collected firsthand by the researcher | Data collected by others for different purposes |
| Cost and Time | More expensive and time-consuming | More affordable and quicker to obtain |
| Data Quality & Relevance | Highly specific and tailored to research questions | May be outdated or less specific |
| Flexibility | Customizable to research needs | Limited by original data scope |
| Control Over Data | Full control over data collection process | No control over how data was collected |
Advantages of primary data collection methods:
High accuracy and specificity.
Full control over data quality.
Customizable to research needs.
Disadvantages of primary data collection methods:
Costly and resource-intensive.
Time-consuming.
Often limited in scope.
Advantages of secondary data collection methods:
Disadvantages of secondary data collection methods:
Data may be outdated or irrelevant.
Limited control over quality.
Potential for bias and lack of specificity.
Researchers often combine both types of data collection methods to balance accuracy, efficiency, and scope. Selecting the right approach depends on the research question, available resources, and the need for control over data quality.
Data Collection Tools in 2025
Survey Platforms
Survey platforms in 2025 deliver advanced capabilities for organizations seeking efficient and insightful data collection. These platforms support a wide range of surveys, from customer satisfaction to employee engagement. Modern survey platforms offer real-time feedback, customizable dashboards, and seamless integration with other business tools. Many platforms now include AI-powered analytics, natural language processing, and omnichannel deployment, which allow organizations to collect and analyze surveys across web, mobile, and offline environments.
The following table highlights the latest survey platforms and their unique features:
| Survey Platform | Key Features | Unique Differentiators |
| Sogolytics | NPS, CSAT, CES surveys, custom metrics, key driver analysis, natural language processing, real-time omnichannel feedback, customizable dashboards, wide integrations, 24/7 support | One-stop platform for SMBs and enterprises, customizable dashboards (SogoCX), extensive integrations, real-time trend analysis |
| Qualtrics | 100+ templates, integrated logic, real-time feedback analysis, multiple-question templates, flexible survey construction | Strong real-time insights, flexible question integration, smooth interface navigation |
| QuestionPro | User-friendly survey creation, multilingual support, 20+ customizable themes, 24/7 email support | Engages respondents end-to-end, multilingual options, suitable for enterprises |
| SurveySparrow | Conversational surveys, skip logic, answer shuffling, multimedia elements, AI survey builder | Personalized survey paths, multimedia integration, advanced branching logic |
| Pollfish | Skip logic, answer shuffling, multimedia questions, intuitive data visualization, customizable styling, advanced insights builder, built-in statistical testing | Advanced reporting and filtering, demographic and response-based drill-down, complex multi-variable analysis without Excel |
| Alida | Conversational SMS surveys, community composition analysis, advanced survey scripting | AI-powered text analytics, multi-channel engagement, tailored survey scripting |
| Surveyapp | Offline data collection, multi-language surveys, real-time feedback alerts, customizable designs | Offline capability for areas with limited connectivity, supports iOS and Android, real-time alerts |
| Forsta | Multi-channel deployment (online, phone, web, paper), device detection, video responses, real-time response monitoring | Advanced data visualization, flexible deployment, video feedback collection |
| InMoment | Real-time sentiment analysis, custom filters, multi-channel and multi-language surveys, machine learning for feedback themes | Closed-loop feedback management, tailored business model alignment, multi-channel deployment |
Organizations select platforms based on their need for scalability, integration, and advanced analytics. Many platforms now support conversational surveys, multimedia questions, and instant feedback, which improve engagement and completion rates. Offline survey capabilities ensure data collection in remote or low-connectivity areas. These innovations make surveys more accessible and actionable for businesses and researchers.
Tip: Choosing a platform with AI-driven analytics and real-time dashboards helps organizations gain deeper insights from surveys and respond quickly to trends.
Interview Tools
Interview tools in 2025 focus on efficiency, cost savings, and advanced AI capabilities. These tools streamline the process of collecting interview data, whether for recruitment, research, or customer feedback. Organizations benefit from automated transcription, multi-format response collection, and collaborative evaluation features. AI-powered matching and bias reduction improve the quality and fairness of interview outcomes.
The table below compares leading interview tools:
| Tool Name | Pricing (Starting) | Key Features | AI Capabilities | Cost Savings & Efficiency |
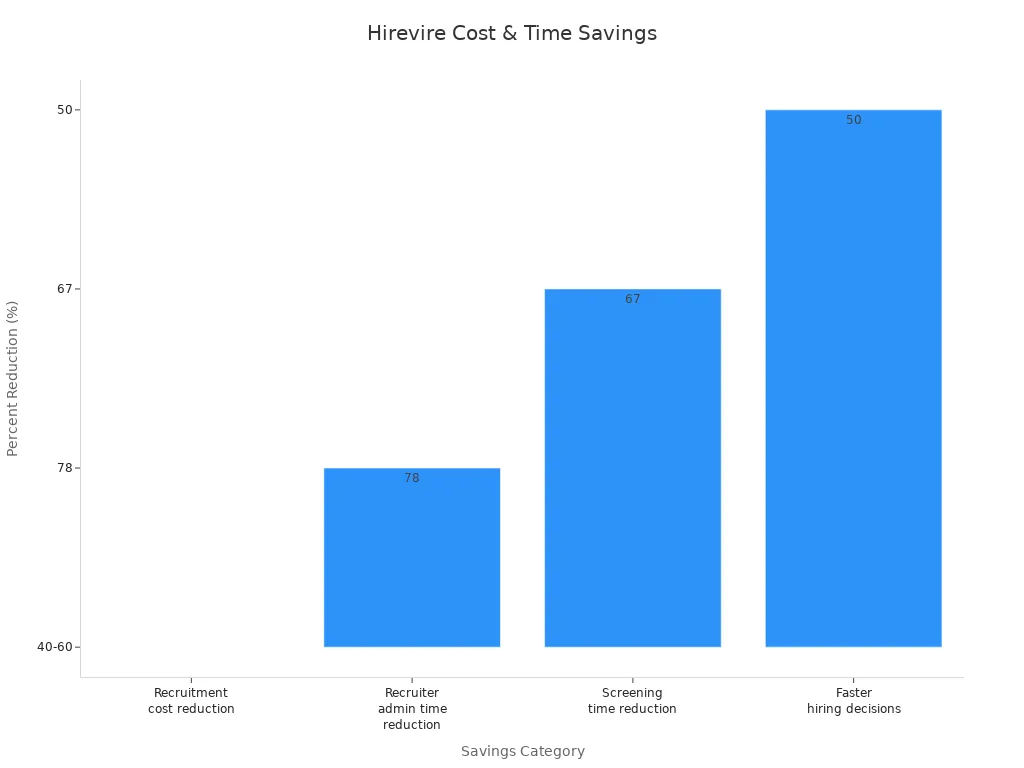
| Hirevire | $19/month | Multi-format response collection, no login required, unlimited responses, automated workflows, extensive integrations, collaborative evaluation | AI transcription (90+ languages), 85-95% accuracy in candidate matching, bias reduction features | 40-60% recruitment cost reduction, 78% less recruiter admin time, 67% screening time reduction, 50% faster hiring decisions |
| HireVue | Custom pricing (Enterprise) | Robust capabilities for large organizations | Advanced AI screening | Suitable for complex hiring needs with substantial budgets |
| myInterview | Free tier available | Basic screening for small teams | Basic AI features | Budget-friendly option |
Hirevire stands out as the most cost-effective solution, offering unlimited responses and significant reductions in recruitment costs and administrative time. Its AI transcription supports over 90 languages, and bias reduction features help organizations make fairer hiring decisions. The following chart illustrates Hirevire's impact on cost and time savings:
Organizations seeking scalable interview solutions choose platforms based on their need for automation, AI capabilities, and integration with existing workflows. These tools enable faster decision-making and more accurate candidate matching, which improves overall data quality.
Focus Group Software
Focus group software in 2025 leverages AI and real-time analytics to enhance qualitative data collection. Solutions such as Insight7 and Qualtrics automate transcription, analyze emotional responses, and extract key themes from group discussions. These features reduce manual processing and subjective bias, allowing researchers to focus on interpreting results.
Modern platforms integrate with video conferencing tools and support multimedia interactions, which enable seamless online focus groups. Real-time analytics and smart participant filters improve recruitment and engagement. Automated transcription and translation tools simplify data processing, making it easier to analyze discussions across languages and cultures.
The table below summarizes leading focus group software and their benefits:
| Software Solution | Key Features Enhancing Data Collection | Benefits for Data Collection |
| QuestionPro Communities | Online video discussions, real-time analytics, smart participant filters, multimedia interactions, auto-transcription | Enables seamless online focus groups, instant feedback, targeted recruitment, enhanced engagement, efficient analysis |
| FlexMR | Interactive features (images, audio, video, smart boards), video/text chat, virtual observation room with private chat | Facilitates rich participant engagement and stakeholder observation, improving qualitative data collection |
| Aha! | Integrated Zoom platform, live webcam/mobile video chats, automatic transcription (ML or human), scheduling and tech checks | Supports live, recorded sessions with easy transcription, ensuring smooth and flexible focus group management |
| Qualzy | Video focus groups, transcription, translation, editing tools, multilingual support | Enables comprehensive qualitative research across languages, simplifying data processing and cultural relevance |
| Forsta | Virtual backroom for moderators, breakout rooms, real-time participant interaction | Enhances participant engagement and allows smaller group discussions for deeper insights |
| QualSights | Remote observation via high-quality video streaming, chat features for participants and moderators | Supports flexible study designs and encourages open participant dialogue |
| MAXQDA | Import and analyze text, audio, video files; powerful qualitative analysis tools | Allows in-depth data analysis and visualization directly within the platform |
Researchers select focus group software based on their need for automation, multilingual support, and integration with existing technology stacks. These platforms enable efficient, accurate, and scalable qualitative data collection, supporting both in-person and virtual studies.
Observation Apps
Observation apps have become essential for accurate and efficient data collection in fields such as meteorology, environmental science, and public safety. These tools source data from national meteorological services, satellites, and advanced weather models, ensuring reliability and precision. Frequent updates and real-time data assimilation help users stay prepared for severe weather events, reducing risks to life and property.
| App Name | Specialty / Popularity | Data Accuracy Features |
| AccuWeather | Best Free Weather App | Comprehensive weather data, reliable sources, planning and productivity tools |
| Carrot Weather | Best Paid Weather App | Dark Sky data integration, customizable premium features |
| Flowx | Best for Android | Aggregates local/global data, customizable graphs and maps |
| MyRadar Weather Radar | Best for Local Forecasts | Quick, accurate radar and aviation data, Apple Watch support |
| NOAA Weather Radar Live | Best for Official Data | Direct NOAA sourcing, authoritative and accurate information |
| 1Weather | Best for Widgets | Hourly/weekly forecasts, radar maps, contextual weather data |
| Plume Labs | Best for Air Quality | Real-time pollution data, health-focused insights |
| The Weather Channel | Best for Video Content | Robust video content, severe weather preparedness |
| Weather Hi-Def Radar | Best for iPhone | Severe weather overlays, GPS tracking, air quality monitoring |
| Weather Underground | Best Overall | Smart forecasts, storm tracking, air quality readings |
| WeatherBug | Best for Lightning Detection | Specialized lightning alerts, improved severe weather accuracy |
Observation apps improve data accuracy by combining ensemble forecasting, radar maps, and severe weather alerts. Real-time updates and integration with wearable devices enhance user safety and preparedness. These platforms support both free and premium tiers, making them accessible for individuals and organizations.
Tip: Selecting an app that sources data from official agencies and offers frequent updates ensures the highest level of forecast reliability.
Experiment Platforms
Experiment platforms in 2025 empower organizations to conduct robust data-driven tests and interventions. These platforms offer advanced targeting, real-time metrics, and compliance with industry standards. LaunchDarkly leads with enterprise-grade targeting and multi-region fallbacks, while Split provides built-in experimentation and auto-calculated metrics. Optimizely integrates with digital experience suites and uses Bayesian statistics for unified results.
| Platform | Key Features & Strengths | Considerations |
| LaunchDarkly | Deep targeting, real-time metrics, SOC 2 & HIPAA compliance | Higher starting price, learning curve |
| Split | Granular flag rules, stats-engine, impact dashboard | Advanced analytics require upgrade |
| Optimizely | Digital suite integration, Bayesian stats, edge delivery | Costs rise with large user bases |
| GrowthBook | Open-source, auto-exposure tracking, click-to-SQL insights | Best for startups |
| Unleash | Self-hosted, private variant stickiness, SAML SSO | Lacks built-in statistics |
| ConfigCat | Budget-friendly, generous usage limits | No experimentation features |
Best practices include using short-lived flags, targeting by user context, and aligning metrics before rollout. Platforms such as GrowthBook and Unleash offer open-source flexibility, while ConfigCat provides cost-effective usage for smaller teams. Galaxy’s AI-powered SQL editor complements these platforms by enabling rapid analysis of experiment logs.
Social Media Tools
Social media tools have evolved to track a wide range of metrics across multiple platforms. Sprout Social supports Facebook, Instagram, LinkedIn, YouTube, TikTok, and X, offering insights into impressions, engagement rates, sentiment analysis, and influencer ROI. Sendible automates reporting and content customization, while Keyhole excels in real-time brand mentions and competitor tracking.
| Tool | Supported Platforms | Key Metrics Tracked |
| Sprout Social | Facebook, Instagram, LinkedIn, YouTube, TikTok, X | Impressions, follower growth, engagement, reach, video views, sentiment, influencer ROI, competitor analysis |
| Sendible | Facebook, Instagram, LinkedIn, YouTube, TikTok, X | Post performance, engagement, automated reports, audience engagement, client collaboration |
| Keyhole | X, Instagram, Facebook, YouTube, LinkedIn, TikTok | Brand mentions, competitor behavior, influencer tracking, trend spotting, aggregated analytics |
| IZEA | Influencer marketing focused | Reach, engagement rate, audience demographics, campaign performance, conversion rates, brand safety |
| BuzzSumo | Facebook, X, Pinterest | Social shares, content engagement, competitor content performance |
| Google Analytics | Website traffic from social media | Traffic sources, campaign tracking, social ROI measurement |
| Rival IQ | Multiple including YouTube | Competitor analysis, social analytics, social listening, reporting, influencer tracking |
| Vista Social | Multiple platforms | Analytics, review management, comment management, social listening, customized reports |
These tools enable organizations to monitor brand health, optimize campaigns, and benchmark against competitors. Automated sentiment analysis and customizable reporting provide actionable insights for marketing and public relations teams.
Note: Choosing a tool that aligns with organizational goals and supports the required platforms ensures effective social media data collection and analysis.
API & Streaming Tools
API and streaming tools have become essential for real-time data collection in 2025. Organizations use these technologies to gather, process, and analyze information as soon as it is generated. This approach supports instant decision-making and improves business agility.
Modern streaming tools such as Apache Kafka, Apache Flink, Debezium, RabbitMQ, and Redis Streams form the backbone of real-time data systems. Apache Kafka provides a fault-tolerant and scalable platform for event streaming. It handles high-throughput scenarios, including fraud detection and telemetry. Apache Flink offers low-latency stream processing and supports complex event analytics. Debezium enables real-time database change capture, allowing organizations to synchronize data without full migrations. RabbitMQ delivers lightweight messaging for microservices, while Redis Streams ensures ultra-fast, in-memory streaming with sub-millisecond latency.
APIs in 2025 rely on advanced streaming architecture patterns. Publish-Subscribe (Pub/Sub), event sourcing, and Command Query Responsibility Segregation (CQRS) help manage data flow and state efficiently. Persistent, low-latency channels use protocols like WebSockets, Server-Sent Events (SSE), and WebRTC. These protocols keep data moving continuously between systems and users.
Optimized data formats such as Avro and Protocol Buffers reduce latency and keep payloads compact. Security remains a top priority. Organizations use token-based authentication, multi-factor authentication, and OAuth 2.0 to protect data. Rate limiting and throttling prevent system overloads, while API versioning and clear documentation improve reliability and developer experience.
Tip: Combining APIs with streaming tools allows organizations to build scalable, fault-tolerant systems that deliver instant insights and support continuous business operations.
| Tool/Protocol | Main Function | Key Benefit |
| Apache Kafka | Event streaming backbone | High throughput, fault tolerance |
| Apache Flink | Stream processing | Low latency, complex analytics |
| Debezium | Database change capture | Real-time sync, no migration |
| RabbitMQ | Messaging for microservices | Lightweight, flexible |
| Redis Streams | In-memory data streaming | Ultra-fast, sub-millisecond delay |
| WebSockets/SSE | Persistent data channels | Continuous, low-latency updates |
IoT & Sensor Platforms
IoT and sensor platforms have transformed data collection by enabling organizations to monitor environments, assets, and processes in real time. These platforms connect a wide range of sensors to centralized systems, providing actionable insights across industries.
SCW.AI's Digital Factory stands out as a leading IoT solution for manufacturing. This platform collects shop-floor data by identifying key metrics, selecting suitable sensors, and connecting them to an IoT network. The system analyzes sensor data to optimize production, reduce costs, and improve decision-making. Manufacturers use SCW.AI to drive digital transformation and achieve high returns on investment.
Ubidots is another top industrial IoT platform. It enables real-time sensor data collection, monitoring, and analytics. Organizations in manufacturing, agriculture, retail, and commercial sectors rely on Ubidots for operational efficiency.
Key sensor types and their applications include:
Temperature sensors: Protect sensitive assets in food logistics, pharmaceuticals, and manufacturing. Optimize HVAC systems.
Vibration sensors: Support predictive maintenance and monitor equipment uptime in factories and construction sites.
Motion sensors: Enhance building security, manage energy use, and track customer movement in retail.
Sound sensors: Detect machinery malfunctions and monitor noise for safety compliance.
Chemical sensors: Identify toxic gases and monitor air quality in mining, oil, and manufacturing.
Environmental sensors: Measure humidity, wind, rain, and air quality for agriculture, logistics, and construction.
| Sensor Type | Industry Applications | Main Benefit |
| Temperature | Food, pharma, manufacturing | Asset protection, process control |
| Vibration | Manufacturing, construction | Predictive maintenance |
| Motion | Security, retail, energy management | Safety, efficiency |
| Sound | Manufacturing, public safety | Malfunction detection, compliance |
| Chemical | Mining, oil, industrial | Hazard detection, air quality |
| Environmental | Agriculture, logistics, construction | Safety, operational optimization |
These platforms and sensors support predictive maintenance, safety, compliance, and sustainability. Organizations achieve better outcomes by integrating IoT and sensor data into their operations.
Organizations that invest in advanced IoT and sensor platforms gain a competitive edge through real-time monitoring, improved safety, and smarter decision-making.
Data Collection Process
Define Objectives
Every successful data collection process begins with clear objectives. Organizations and researchers must identify what they want to discover or achieve. These objectives guide every decision, from selecting methods to analyzing results. A well-defined objective ensures that the data collected will be relevant and actionable. For example, a business may want to measure customer satisfaction, while a healthcare provider may seek to track patient outcomes. Defining objectives also helps teams avoid collecting unnecessary data, saving time and resources.
Tip: Write objectives as specific questions or statements. This approach clarifies the purpose and keeps the data collection plan focused.
Select Techniques and Tools
After setting objectives, the next step involves choosing the right techniques and tools. The selection depends on the type of data needed, the research context, and available resources. Common data collection procedures include surveys, interviews, observations, and experiments. Each method offers unique strengths. For instance, surveys work well for large-scale quantitative studies, while interviews provide deep qualitative insights. In 2025, organizations often use digital platforms, mobile apps, and automated tools to streamline the data collection process.
A practical data collection plan matches techniques to objectives and ensures that tools are user-friendly. Teams should also consider integration with existing systems and the ability to scale. Selecting the right tools improves efficiency and data quality.
Note: Evaluate the cost, accessibility, and reliability of each tool before making a final decision.
Design Instruments
Designing effective instruments is a critical part of the data collection process. Instruments include surveys, interview guides, observation checklists, and experimental protocols. Each instrument must align with the objectives and chosen techniques. Clear and concise questions reduce confusion and improve response rates. Visual elements, such as progress bars or icons, can enhance user engagement in digital surveys.
Teams should pilot test instruments before full deployment. This step helps identify confusing questions, technical issues, or biases. Adjustments based on pilot feedback ensure that the final instruments collect accurate and reliable data. Well-designed instruments form the backbone of robust data collection procedures.
Callout: Always review instruments for clarity, neutrality, and cultural sensitivity. This practice supports ethical and inclusive data collection.
Pilot Testing
Pilot testing serves as a crucial step before launching full-scale data collection procedures. Teams use pilot tests to identify issues in survey questions, interview guides, or observation checklists. By running a small-scale trial, researchers can spot confusing instructions, technical glitches, or unexpected participant reactions. This process helps refine instruments and ensures that data collected will be accurate and reliable.
During pilot testing, teams select a sample group similar to the target population. They observe how participants interact with the instruments and gather feedback on clarity and usability. Researchers analyze pilot data to check for missing responses, inconsistent answers, or technical errors. Adjustments based on these findings improve the quality of the final data collection.
Tip: Always document changes made after pilot testing. This record helps maintain transparency and supports future improvements.
Ethics and Compliance
Ethical compliance stands at the core of responsible data collection. Organizations must protect participants' rights and ensure that data handling meets legal and moral standards. The following best practices guide ethical data collection:
Obtain clear and informed consent from all participants before collecting data.
Communicate transparently about how the data will be used.
Limit data collection to only what is necessary for the project.
Encrypt sensitive information both during storage and transmission.
Restrict data access to authorized personnel only.
Conduct regular privacy and security audits to address vulnerabilities.
Provide ongoing training for employees on data privacy and ethical handling.
Apply privacy by design principles when developing new systems.
Set clear data retention policies and securely dispose of data when no longer needed.
Prepare an incident response plan for potential data breaches.
Follow all relevant legal frameworks, such as GDPR and CCPA.
These steps build trust with participants, reduce legal risks, and promote ethical standards throughout the data collection procedures.
Data Management
Effective data management ensures that collected information remains organized, secure, and accessible. Teams develop clear protocols for storing, labeling, and backing up data. Using secure cloud storage or encrypted databases protects sensitive information from unauthorized access. Regular backups prevent data loss due to technical failures.
Researchers assign roles for data entry, cleaning, and validation. Consistent naming conventions and version control help track changes and avoid confusion. Access controls limit who can view or edit data, reducing the risk of errors or breaches. Proper data management supports smooth analysis and reporting, making it easier to draw meaningful conclusions from the collected information.
Note: Good data management practices not only protect data but also improve efficiency and reliability throughout the research process.
Quality Assurance
Quality assurance stands as a critical step in any data collection process. Organizations must ensure that every piece of information meets strict standards for accuracy, consistency, and reliability. Quality assurance begins before data collection starts and continues throughout the project lifecycle.
Teams develop clear protocols to check for errors and inconsistencies. They use validation rules in digital forms to prevent incorrect entries. For example, a survey might require a valid email address or restrict responses to a specific range. These controls help collect high-quality data from the start.
Regular evaluation of data quality takes place at multiple stages. Teams review samples of collected information to identify patterns of missing or inaccurate responses. They also compare results from different sources to spot discrepancies. If they find issues, they adjust procedures or retrain staff to improve outcomes.
A robust quality assurance plan includes several key actions:
Pre-collection checks: Review instruments for clarity and test them with a small group.
Ongoing monitoring: Use automated tools to flag outliers or duplicate entries during collection.
Post-collection review: Conduct manual audits and statistical checks after gathering data.
Tip: Assign a dedicated quality manager or team to oversee the evaluation process. This role ensures accountability and continuous improvement.
Documentation supports transparency. Teams record every change or correction made during the project. This record helps during audits and supports future projects.
Quality assurance also involves regular training. Staff learn best practices for data entry, handling, and security. Well-trained personnel reduce the risk of errors and maintain high standards.
Finally, organizations use feedback from the evaluation phase to refine their methods. They update protocols and tools based on lessons learned. This cycle of review and improvement helps maintain trust in the results and supports better decision-making.
Practical Tips and Examples
Business Analytics
Business leaders in 2025 rely on data collection techniques to drive growth and efficiency. They use surveys and transactional tracking to understand customer behavior and market trends. For example, a retail company might launch a study to analyze purchasing patterns using point-of-sale data and online feedback forms. This approach helps managers identify which products perform best and which promotions generate the highest impact.
Companies often use social media monitoring tools to track brand reputation and customer sentiment. These tools provide instant feedback, allowing teams to adjust marketing strategies quickly. A financial services firm may conduct a study to evaluate the impact of a new loyalty program by comparing transaction data before and after implementation. This method reveals program impact and guides future decisions.
Tip: Regularly validate data sources and use automated dashboards to visualize trends. This practice improves decision-making and reduces errors.
Academic Research
Researchers in academic settings design studies to answer specific questions and advance knowledge. They select data collection methods based on the type of data needed. For instance, a psychology professor may use interviews and controlled experiments to study the effects of sleep deprivation on student performance. The study combines qualitative insights from interviews with quantitative results from test scores.
Academic teams often use mixed methods to strengthen findings. A sociology department might conduct a study on social media usage among teenagers, collecting survey responses and analyzing online behavior. This approach provides a comprehensive view of the topic and increases the validity of results.
| Research Method | Example Application | Benefit |
| Surveys | Student satisfaction study | Broad, quantifiable insights |
| Interviews | Faculty experience study | Deep, contextual understanding |
| Experiments | Learning intervention study | Measures direct impact |
Note: Pilot testing instruments before full deployment ensures clarity and reliability in academic research.
Healthcare
Healthcare organizations use data collection to improve patient outcomes and operational efficiency. Hospitals conduct studies to monitor infection rates, patient satisfaction, and treatment effectiveness. For example, a clinic may use observation and electronic health records to study the impact of a new hygiene protocol. The study tracks infection rates before and after the intervention, demonstrating program impact.
Medical teams often use IoT sensors and mobile surveys to collect real-time data. Wearable devices monitor patient vitals, while mobile apps gather feedback on care experiences. These methods help providers respond quickly to issues and improve service quality.
Callout: Protect patient privacy by following strict data management and compliance protocols. Secure data handling builds trust and supports ethical healthcare research.
Common Mistakes
Data collection in 2025 presents new opportunities, but professionals still encounter recurring pitfalls that compromise data quality and project outcomes. Recognizing these mistakes helps organizations and researchers improve their processes and achieve reliable results.
Frequent Data Collection Errors:
Insufficient Baseline Data
Teams often neglect to gather baseline information before starting interventions. Without this foundation, measuring change or impact becomes impossible.Inconsistent Data Collection
Using different methods or tools across teams leads to unreliable results. Consistency ensures comparability and supports valid conclusions.Limited Data Points
Collecting data only once or infrequently fails to capture trends. Regular, repeated measurements reveal patterns and support better decision-making.Ignoring Context
Overlooking environmental or situational factors skews findings. Contextual awareness allows for accurate interpretation and meaningful insights.Lack of Staff Training
Untrained personnel may misapply procedures or introduce errors. Comprehensive training ensures everyone follows best practices.Data Overload
Gathering excessive information distracts from project goals. Focusing on relevant data streamlines analysis and improves clarity.Failure to Analyze Data
Collecting data without regular review wastes resources. Ongoing analysis transforms raw information into actionable insights.Lack of Collaboration
Working in isolation prevents diverse perspectives from shaping data interpretation. Engaging stakeholders such as educators, parents, or specialists enriches the review process.Excessively Complex Forms
Complicated forms discourage participation and increase errors. Simplifying forms and using branching logic improves user experience.Poorly Worded Questions
Vague or subjective questions confuse respondents. Clear, objective, and multiple-choice questions enhance consistency.Data Silos
Isolated data remains unused. Integrating data with workflows ensures information supports decision-making.Repetitive Questions
Repeating requests for basic information frustrates users. Automating entry for common fields saves time.Unclear Issues in Forms
Ambiguous questions or instructions hinder understanding. Including images or diagrams clarifies complex topics.Noncompliance with Standards
Employees who do not follow established protocols risk data integrity. Clear instructions and ongoing training promote compliance.Inappropriate Sampling Methods
Improper sampling undermines representativeness. Techniques such as random or stratified sampling improve accuracy.Inadequate Data Cleaning
Unclean data contains errors and duplicates. Cleaning data before analysis ensures reliability.Insufficient Data Validation
Failing to validate data quality leads to misleading results. Techniques like cross-tabulation and reliability analysis confirm accuracy.Unethical Data Practices
Ignoring ethical principles or regulations jeopardizes trust. Adhering to legal standards protects respondents' rights.Ineffective Data Communication
Poor visualization or storytelling obscures insights. Clear charts and narratives make findings accessible.
Tip: Organizations can avoid these mistakes by defining clear procedures, investing in staff training, leveraging technology, encouraging collaboration, and prioritizing data quality over quantity. Regular audits and feedback loops further strengthen data collection efforts.
In 2025, organizations achieve success by selecting the right data collection techniques, methods, and tools. Data collection supports research, business, and healthcare by providing accurate insights. Teams match data collection strategies to their goals and data types. They use surveys, interviews, and modern platforms for efficient data collection. Ethical practices and data quality remain essential in every data collection process. Ongoing training helps staff improve data collection skills. Leaders review data collection results to refine future projects. Staying updated with new data collection trends ensures continued growth and compliance.
Tip: Regularly audit data collection procedures to maintain high standards and adapt to new technologies.
FAQ
What is the difference between data collection techniques and methods?
Data collection techniques refer to specific tools or approaches, such as surveys or interviews. Methods describe the overall strategy, like primary or secondary data collection. Techniques support methods by providing practical ways to gather information.
How do organizations ensure ethical data collection in 2025?
Organizations follow strict guidelines. They obtain informed consent, encrypt sensitive data, and limit access. Regular audits and staff training help maintain compliance with regulations such as GDPR and CCPA.
Which data collection tool is most cost-effective for small businesses?
Survey platforms like SurveySparrow and QuestionPro offer affordable plans. These tools provide essential features, including real-time analytics and easy integration. Small businesses benefit from user-friendly interfaces and scalable pricing.
Can AI improve data quality during collection?
AI automates validation, detects errors, and flags inconsistencies. Machine learning models analyze responses for accuracy. Organizations use AI-powered platforms to reduce manual work and enhance reliability.
What is the best way to collect real-time data?
Event streaming tools, such as Apache Kafka and Flink, process data instantly. IoT sensors and APIs also support real-time collection. These technologies enable organizations to monitor operations and respond quickly.
How do researchers choose between qualitative and quantitative data collection?
Researchers consider their objectives. Qualitative methods explore experiences and motivations. Quantitative approaches measure patterns and trends. Mixed methods combine both for comprehensive insights.
Are paper surveys still relevant in 2025?
Paper surveys remain useful in areas with limited internet access or low digital literacy. They provide inclusivity and reach diverse populations. Manual entry increases cost and time, but some organizations still prefer this approach.
Tip: Always match the data collection technique to the target audience and project goals.
Subscribe to my newsletter
Read articles from Community Contribution directly inside your inbox. Subscribe to the newsletter, and don't miss out.
Written by