Part Two - Navigating the Network Maze
 Blazebrain
Introduction
Welcome back to our series on the art of debugging! In the previous part, we laid the foundation by understanding what debugging is and you got to know powerful the Flutter DevTools is. This time, we're diving deeper into a specific type of error that many developers encounter: network-related issues.
Network calls are the lifeblood of many applications. When they malfunction, it can frustrate your users and be a real headache to troubleshoot. By equipping ourselves with the right tools and knowledge, you can effectively navigate this network maze.
In this article, we'll explore:
Common network-related errors
Leveraging the Dart DevTools Network page
Handling async/await and Dart zones
Debugging HTTP requests and responses
Ready to dive in? Let's get started!
Common Network-Related Errors
During development, you might run into various network issues that can be tricky to diagnose. Recognizing and understanding these errors is the first step toward effective debugging.
1. Connection Issues
Timeouts: Requests exceeding the specified time limit. This could be due to slow server response or poor network connectivity.
Network Outages or Instability: Temporary loss of network connection can disrupt your app's ability to communicate with the server.
Incorrect DNS Resolution: Misconfigured DNS settings can prevent your app from reaching the intended server.
2. Request Errors
Invalid URLs or Endpoints: Typos or incorrect paths in your API endpoints.
Incorrect HTTP Methods: Using the wrong HTTP method (e.g., using GET instead of POST).
Missing or Incorrect Headers: Essential headers like authentication tokens not being included.
Payload Issues: Malformed JSON or XML payloads causing the server to reject the request.
Authentication Failures: Incorrect or expired authentication tokens leading to unauthorized errors.
3. Response Errors
Unexpected Status Codes: Receiving 4xx (client errors) or 5xx (server errors) status codes.
Parsing Errors: Invalid JSON or XML responses that can't be parsed by your app.
Data Inconsistencies: The data received doesn't match the expected format or contains unexpected values.
Leveraging the Dart DevTools Network Page
The Dart DevTools Network page is a powerful friend in debugging network issues. It provides a comprehensive overview of network requests and responses, allowing you to inspect details such as:
Request and response headers
Request and response bodies
Timing information (request duration, latency)
Status codes
Error messages
Key Features and Usage
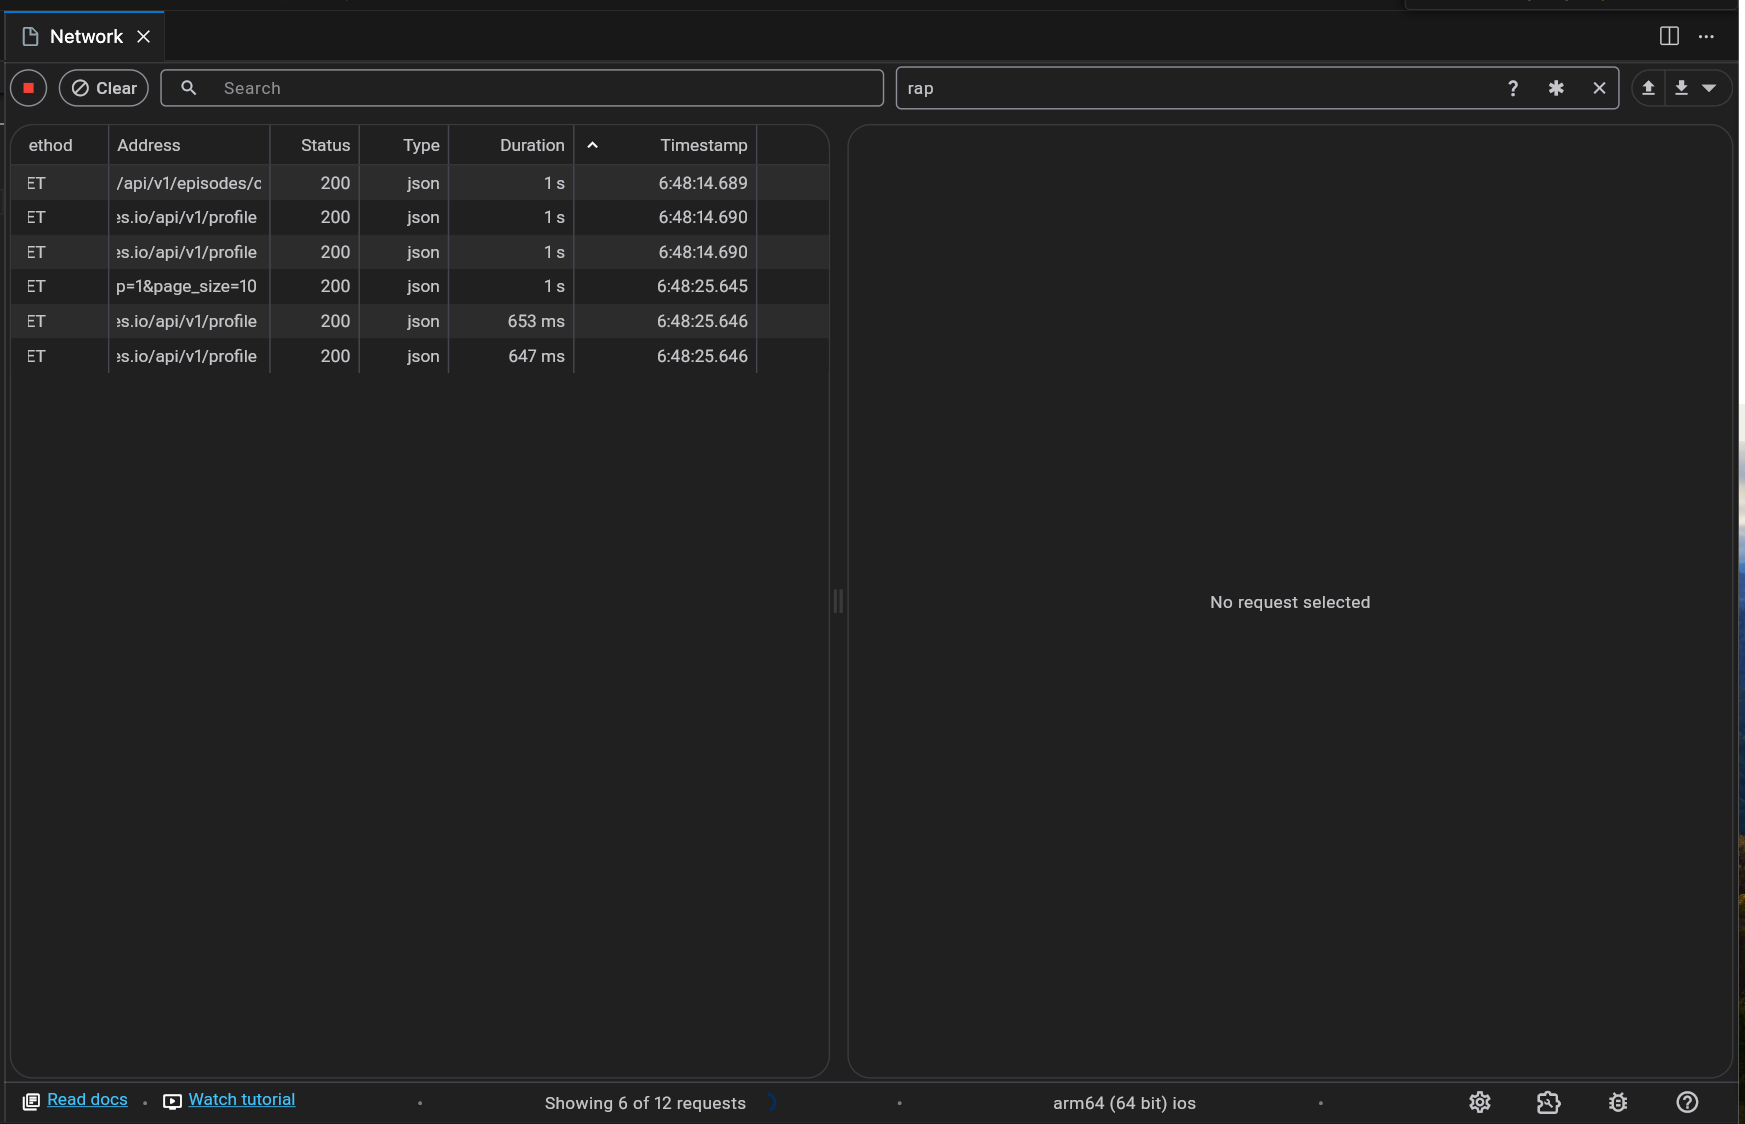
Filtering Requests
Filter by URL: Focus on specific endpoints by filtering requests containing certain strings.
Filter by Method: Separate GET, POST, PUT, DELETE requests to narrow down your search.
Filter by Status Code: Quickly identify failed requests by filtering status codes (e.g., 4xx, 5xx).
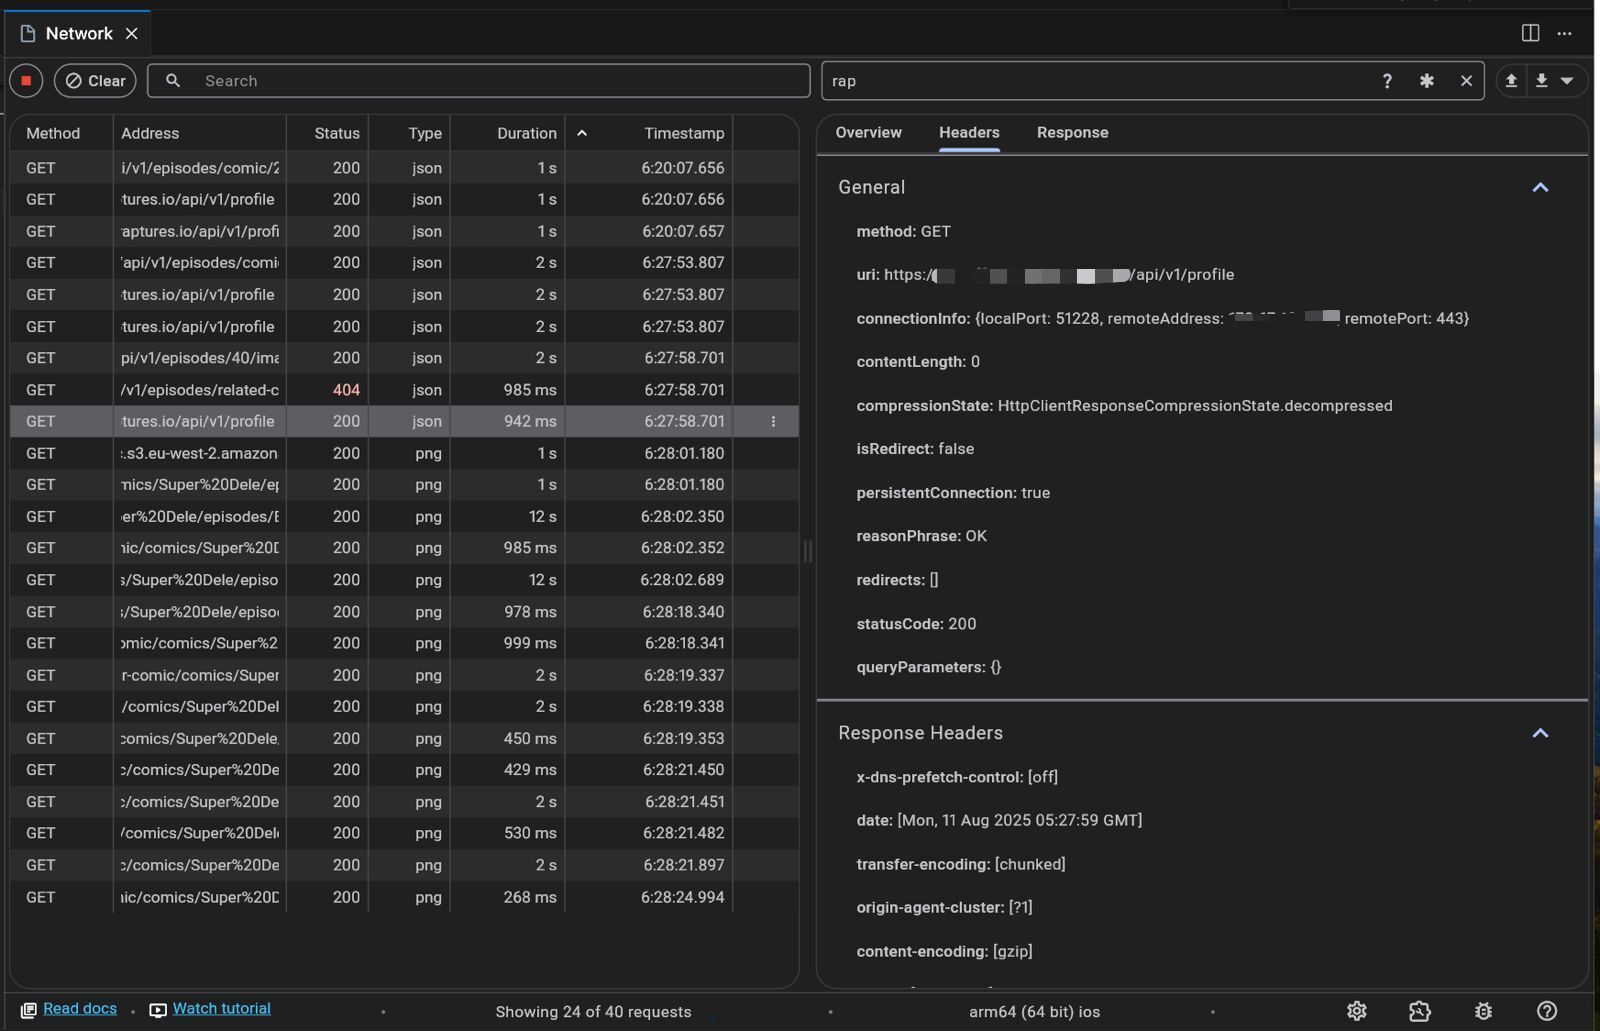
Inspecting Requests and Responses
Request Details: Examine the full request, including headers and payload.
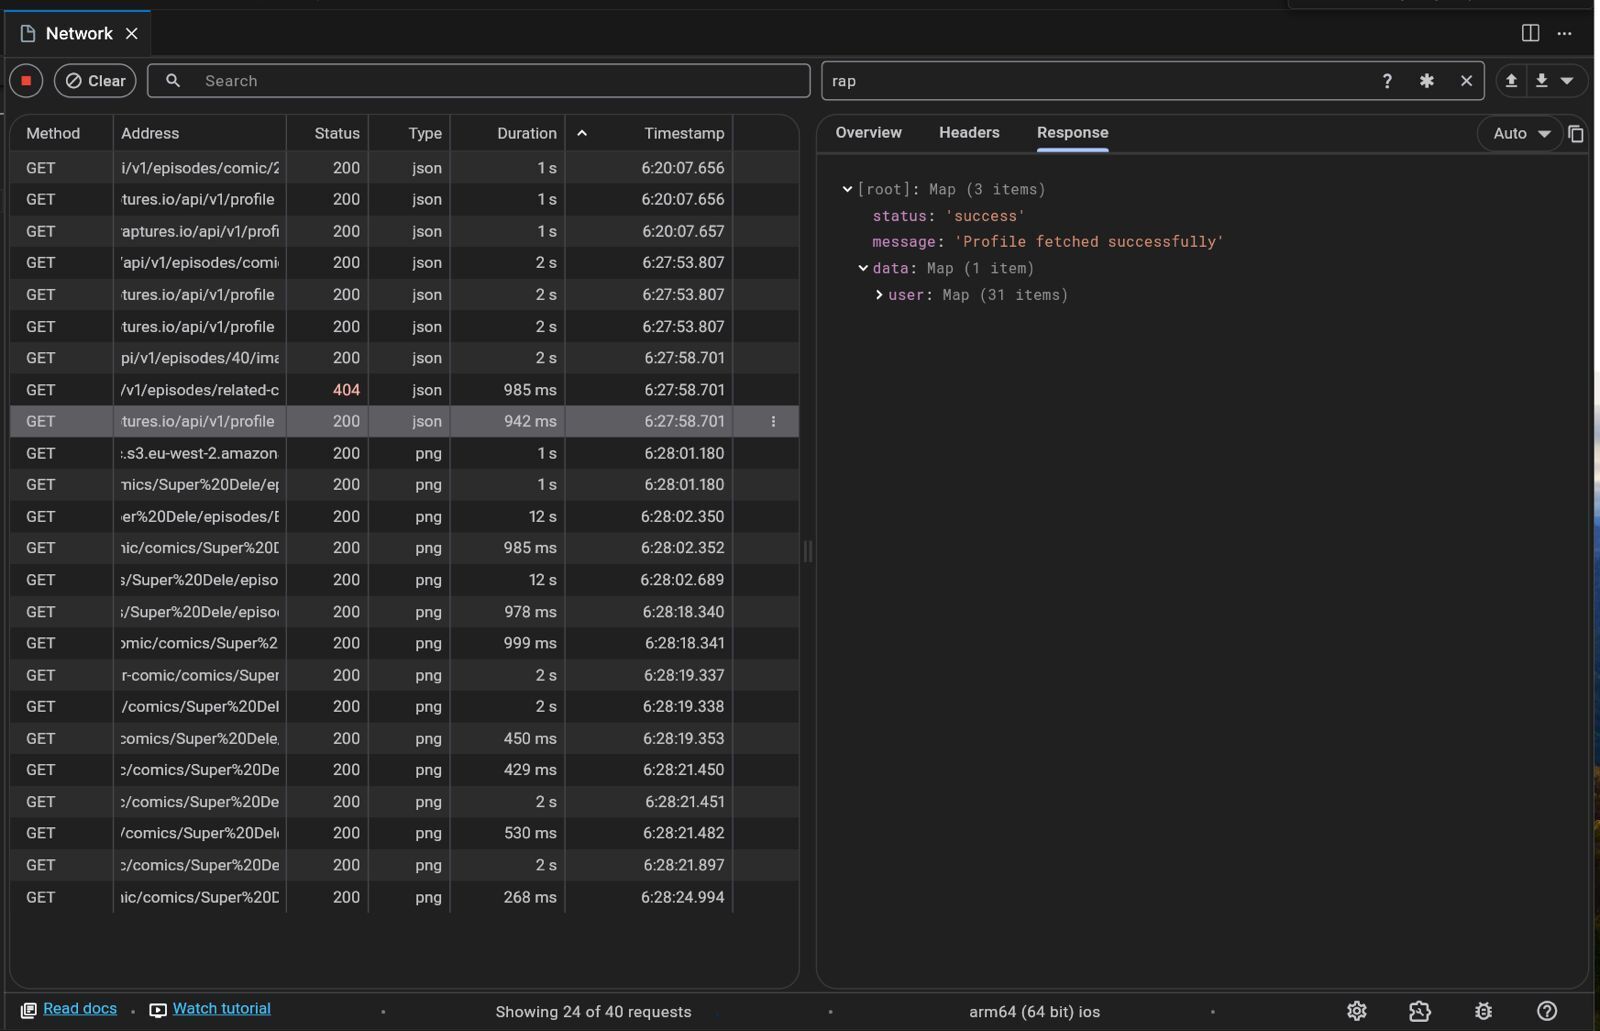
Response Details: View the server's response, headers, and body content.
Headers Inspection: Verify if essential headers like Content-Type or Authorization are correctly set.
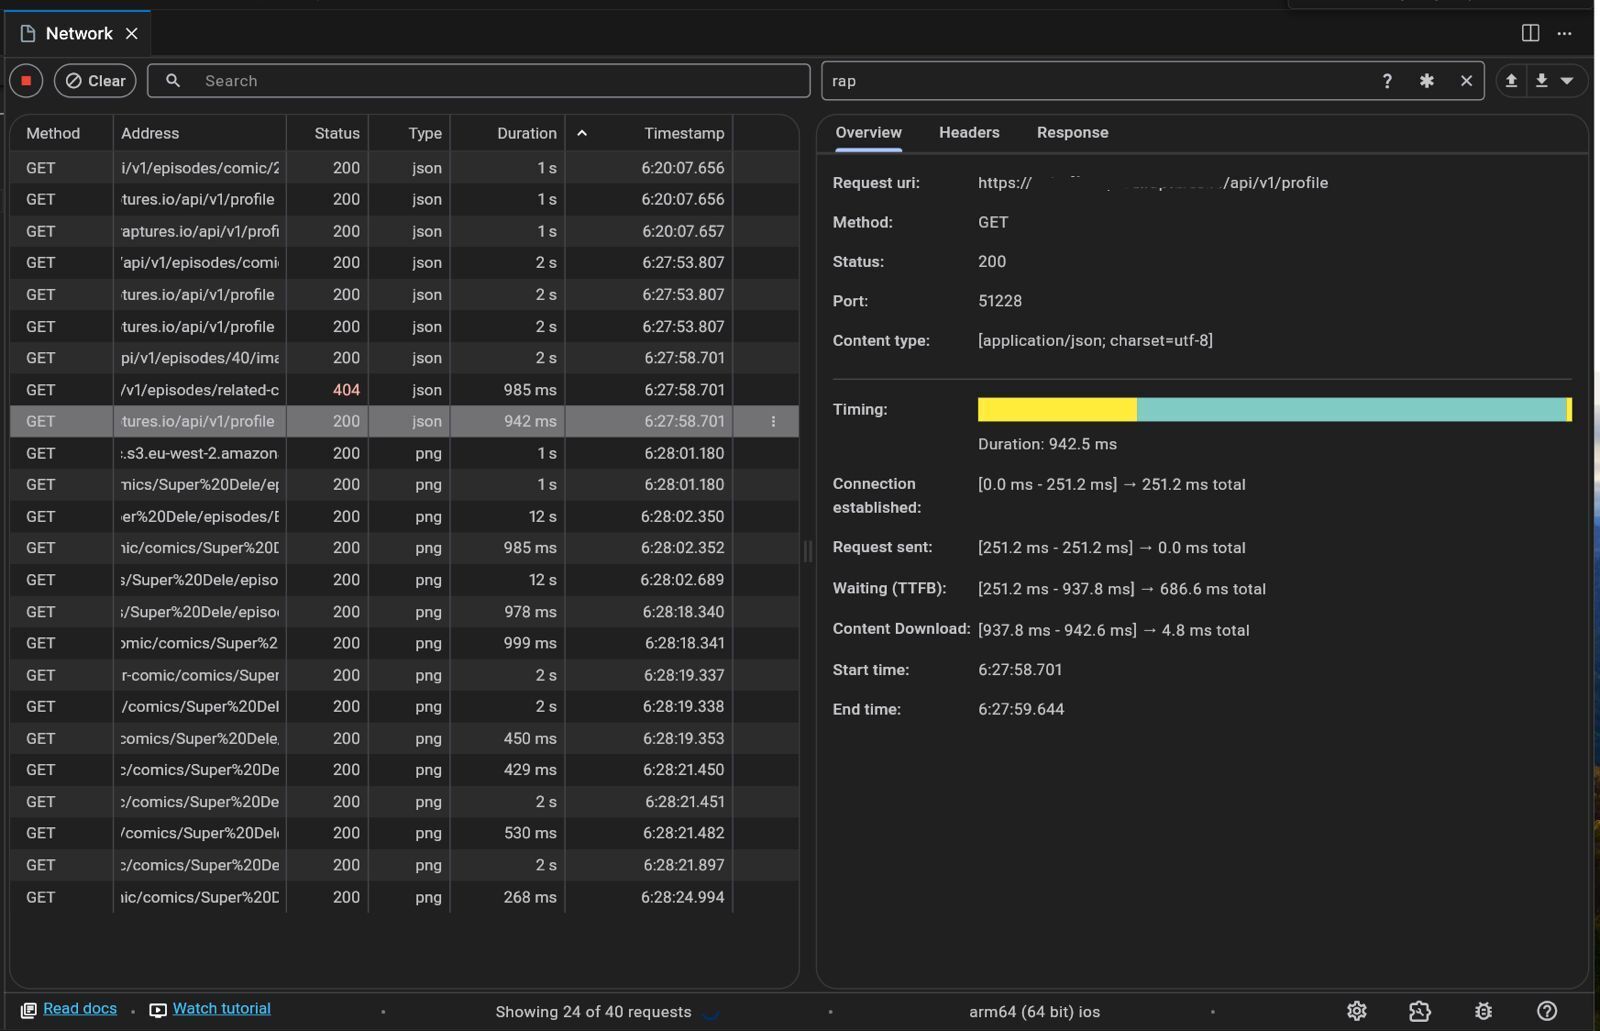
Timing Analysis
Request Duration: Identify slow network calls by looking at the duration of each request.
Latency Insights: Understand network latency issues that might be affecting performance.
Error Handling
Status Codes: Quickly spot errors through HTTP status codes.
Error Messages: Read detailed error messages returned by the server to understand the root cause.
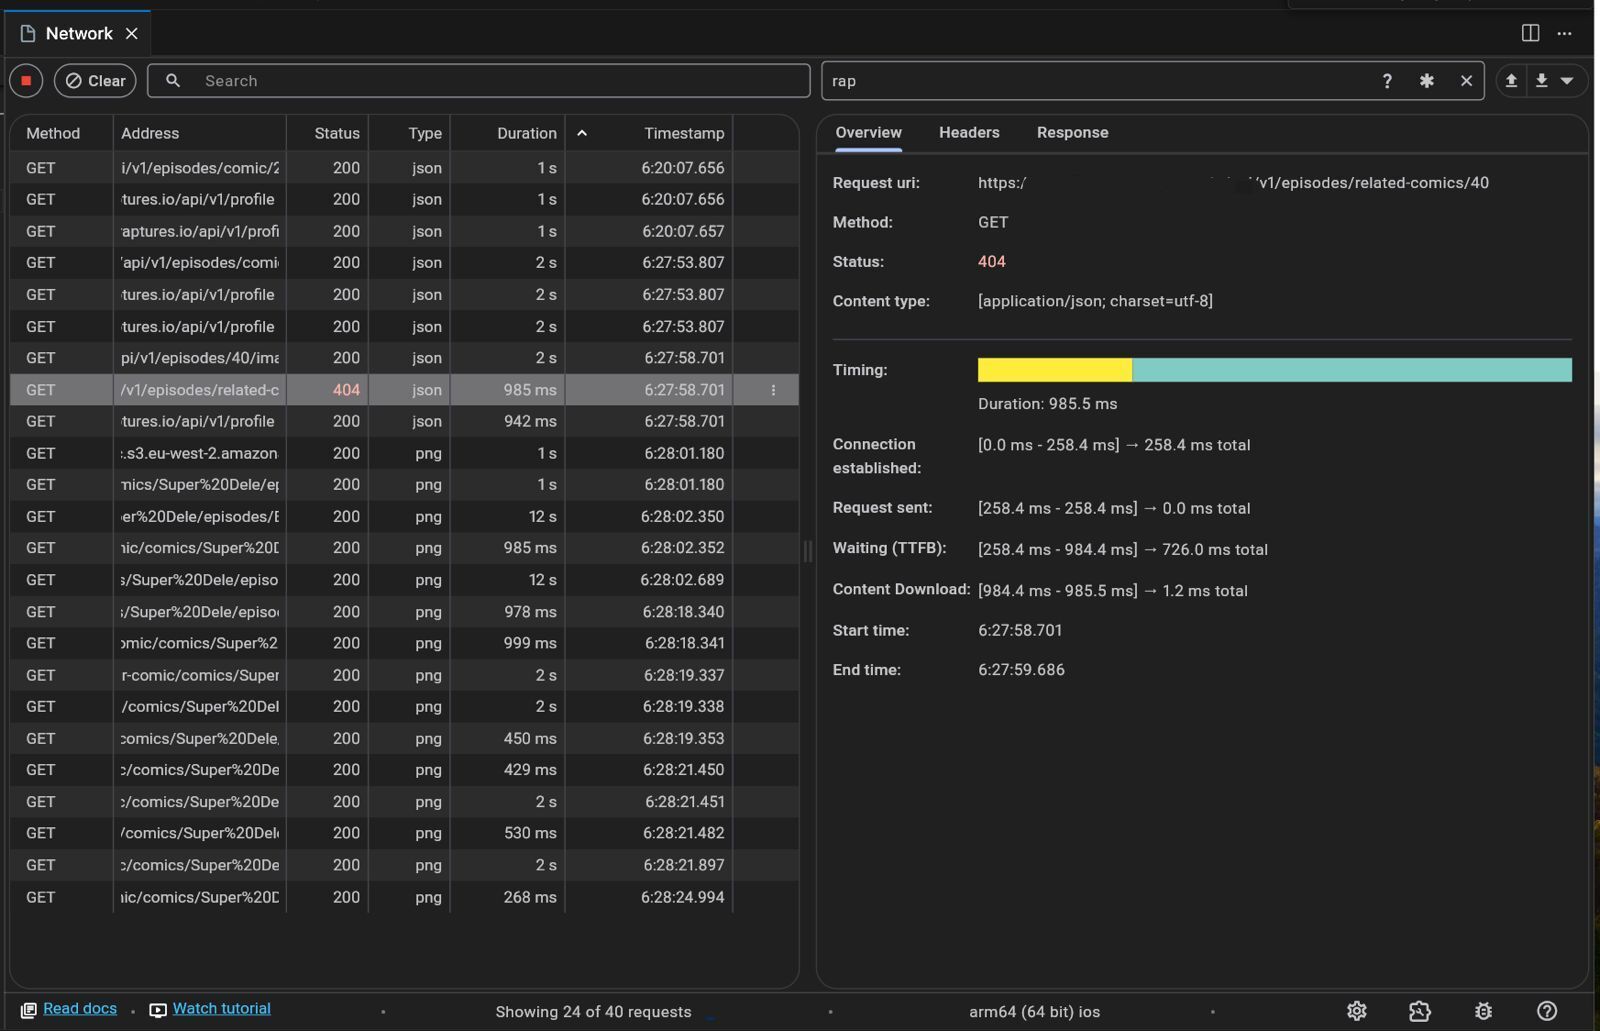
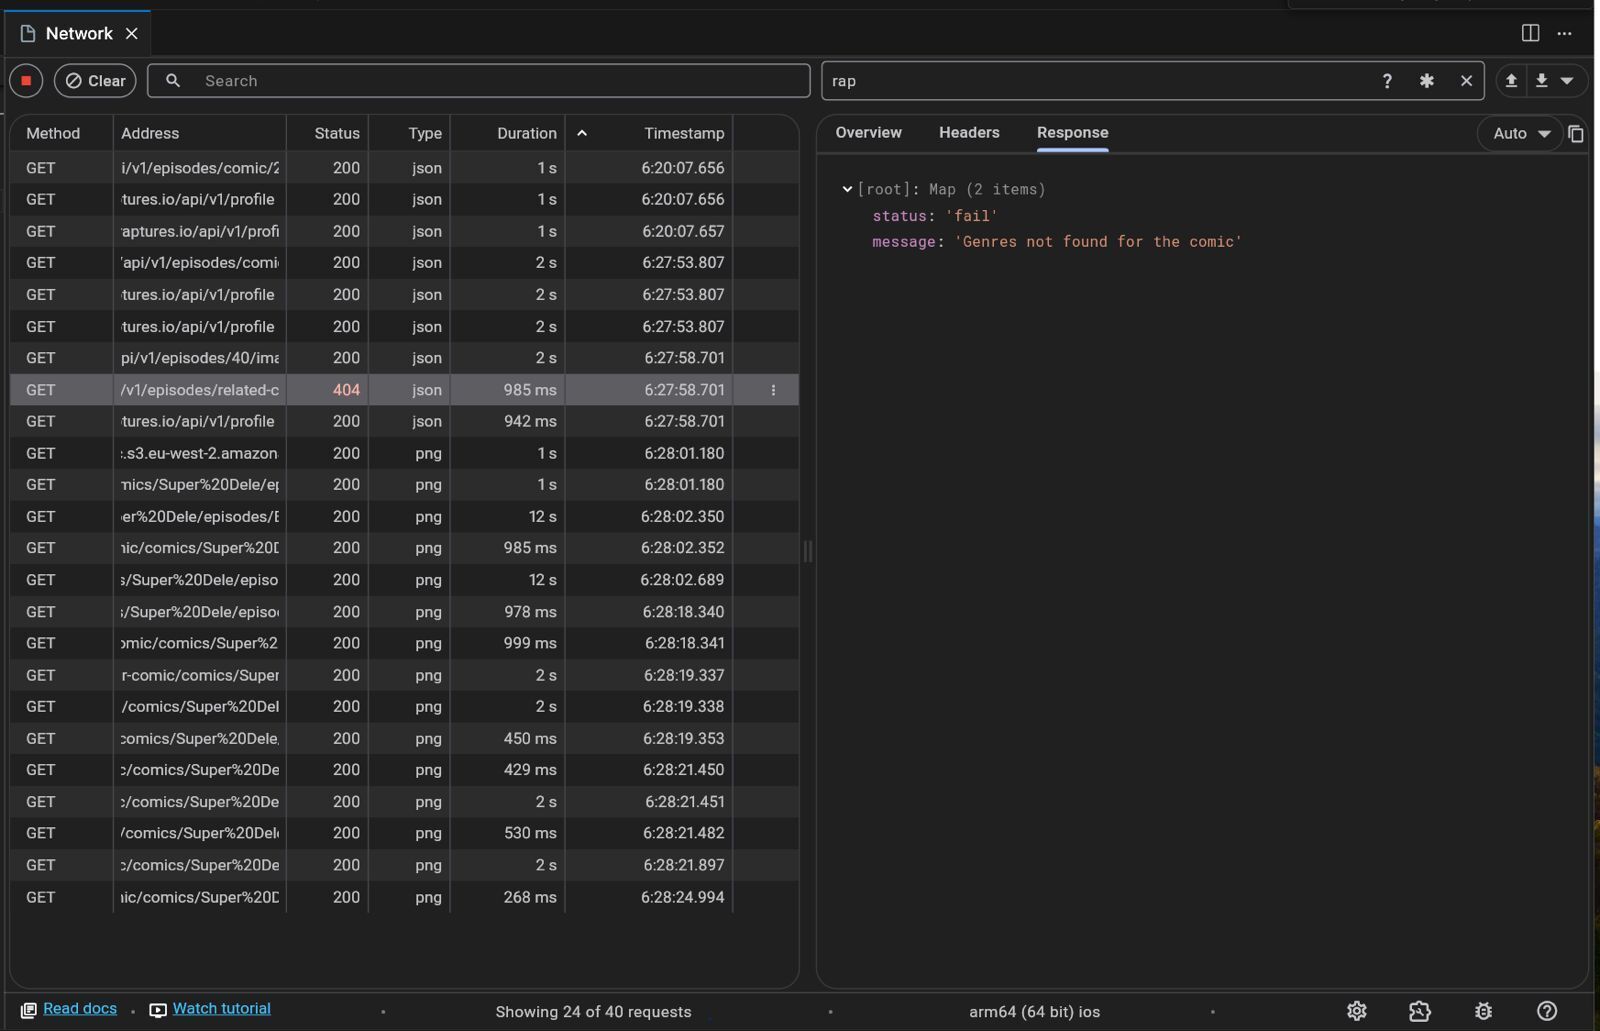
Example Scenario
Imagine a situation where an API call is consistently returning a 404 Not Found Error. Using the Dart DevTools Network page, you can:
Filter Requests: Isolate the problematic API call by filtering requests to that specific endpoint.
Inspect the Request: Check the request headers and body to ensure everything is correctly formatted.
Examine the Response: Look at the response body for any error messages or stack traces provided by the server.
Analyze Timing: See if the request is taking unusually long, which might indicate server-side performance issues.
Adjust and Retry: Based on your findings, make necessary changes and test the request again.
Handling async/await and Dart Zones
Asynchronous operations are at the heart of network calls in Flutter. While async and await make handling asynchronous code more manageable, they can introduce complexities when debugging.
Async/Await Challenges
Error Handling
Unhandled Exceptions: Always wrap your async code with try-catch blocks to handle exceptions.
Future Error Handling: When using Future.then(), make sure to include error handling in the onErrorcallback.
State Management
Race Conditions: Be cautious of multiple network calls modifying the same state simultaneously.
State Updates: Ensure that state changes resulting from network calls are properly synchronized with the UI.
Debugging Techniques
Breakpoints: Set breakpoints inside async functions to step through code execution.
Logging: Use print statements or logging packages to output variable values and execution flow.
Debugger Tools: Utilize Flutter DevTools to inspect variables and call stacks during asynchronous operations.
Dart Zones and Network
Dart Zones provide a way to track asynchronous operations and handle errors globally.
Understanding Zones
What Are Zones? Zones allow you to intercept and manage code execution in a specific context.
Error Handling: You can use runZonedGuarded to catch uncaught asynchronous errors.
Debugging Considerations
Global Error Handling: Implement a global error handler to catch errors not caught in try-catch blocks.
Zone Context: Be aware that variables inside a Zone are accessible throughout its scope, which can help with passing data.
Debugging HTTP Requests and Responses
Beyond using DevTools, there are several techniques you can employ to debug network calls.
Logging
Print Statements: Output request and response data to the console for quick inspection.
Logging Packages: Use packages like logger to manage logging levels and output formats.
HTTP Libraries Features
Interceptors: If you're using packages like Dio, you can use interceptors to monitor and modify requests and responses.
Error Handling: Leverage built-in error handling mechanisms to catch and process errors.
Testing
Unit Tests: Write tests for your network layers to ensure they handle various scenarios correctly.
Mocking: Use mocking frameworks to simulate network responses for different test cases.
Third-Party Tools
Network Profilers: Tools like Charles Proxy or Wireshark can monitor network traffic outside of your app.
Debugging Proxies: Use proxies to intercept and modify network traffic for testing purposes.
Conclusion
Mastering the art of debugging network calls is essential for building robust and reliable Flutter applications. By effectively using the Dart DevTools Network page, understanding async/await and Dart Zones, and employing additional debugging techniques, you can efficiently identify and resolve network-related issues.
In this article, we've covered:
Common network-related errors and how to recognize them
Leveraging the Dart DevTools Network page to inspect network traffic
Handling asynchronous code and Dart Zones in network operations
Debugging techniques for HTTP requests and responses
By incorporating these strategies into your development workflow, you'll be better equipped to tackle any network challenges that come your way.
Stay tuned for the next part of this series, where we'll delve into debugging UI performance issues in Flutter!
If you have any questions or need further assistance, feel free to reach out. I'm always here to help!
Connect with me on X(formerly Twitter) or LinkedIn for more Flutter tips and tutorials. Get the next articles as they land: tap Subscribe below and join the Production-Ready newsletter.
Subscribe to my newsletter
Read articles from Blazebrain directly inside your inbox. Subscribe to the newsletter, and don't miss out.
Written by
Blazebrain
Blazebrain
I'm David Adegoke (Blazebrain), a Senior Mobile Engineer with over 5 years of experience in software engineering, technical writing, and community management.