A Simple Explanation of Data Flow
 Community Contribution
Data flow describes how information moves from one place to another within a system. In modern information systems, understanding data flow helps people spot issues and improve efficiency. Teams see how data moves between devices, platforms, and users. They identify bottlenecks, resolve inefficiencies, and ensure smooth processing. For example, retailers track inventory using data flow from sales points to storage systems. Healthcare providers rely on secure data flow for patient records and device readings. Efficient data flow supports growth, protects sensitive information, and boosts user experience.
Knowing how data flow works allows organizations to make quicker decisions and stay competitive.
Data flow enables collaboration by clarifying how information travels.
It helps systems scale and stay available even during problems.
Security improves when data flow manages sensitive details carefully.
1. Data flow starts with capturing information from all sources. 2. It continues with collecting and transforming data for use. 3. Processing turns raw data into insights. 4. Storage organizes information for easy access. 5. Distribution delivers results to users or other systems.
Key Takeaways
Data flow shows how information moves through a system, helping teams spot problems and improve efficiency.
Data flow diagrams use simple symbols to map data movement, making complex systems easier to understand and manage.
Optimizing data flow boosts productivity, reduces errors, cuts costs, and improves customer satisfaction.
Two main data flow types exist: batch processing for grouped data and streaming for real-time information.
Clear data flow design and regular updates help keep systems secure, scalable, and reliable.
Data Flow Basics
Definition
Data flow describes the movement of information through a system, from its origin to its destination. In computer science and information systems, experts define a data flow diagram as a directed graph. This graph uses nodes to represent processes, data stores, and external entities. The edges show how data moves between these points. The diagram also includes a precedence relation, which explains how one piece of data helps produce another. This formal approach ensures that each process in a system keeps its relationships clear and consistent, even when broken down into smaller parts.
In digital systems, several principles shape how data flow works:
Seamless movement of data across different systems and applications.
Consistent and accurate data through validation and transformation.
A unified view that brings together information from many sources.
Infrastructure that supports both batch and real-time data movement.
Efficient processes that reduce duplication and manual work.
Data transformation for compatibility and usability.
Engineers also rely on Boolean algebra and logic gates to design the circuits that control data flow. Combinational logic design focuses on outputs that depend only on current inputs. Sequential logic design adds memory, so outputs depend on both current and past inputs. These principles help create reliable data flow systems that support modern technology.
Importance
Data flow plays a central role in every computing system. It supports user interactions, business operations, and decision-making. Data moves through several layers, including the user interface, application logic, storage, network, and hardware. Understanding data flow across these layers helps teams design secure, scalable, and efficient systems. Security measures, such as encryption and access controls, protect data as it flows. Data governance ensures that organizations handle information responsibly, meeting compliance standards and protecting sensitive details.
Data flow diagrams give teams a clear picture of how information moves. These diagrams make complex systems easier to understand and improve.
Data flow systems help identify bottlenecks, inefficiencies, and security risks. Visualizing data flow supports better design and process improvement. Teams use these diagrams to document requirements, promote collaboration, and address data security challenges. Data governance and compliance remain top priorities, especially as organizations handle more structured and unstructured data.
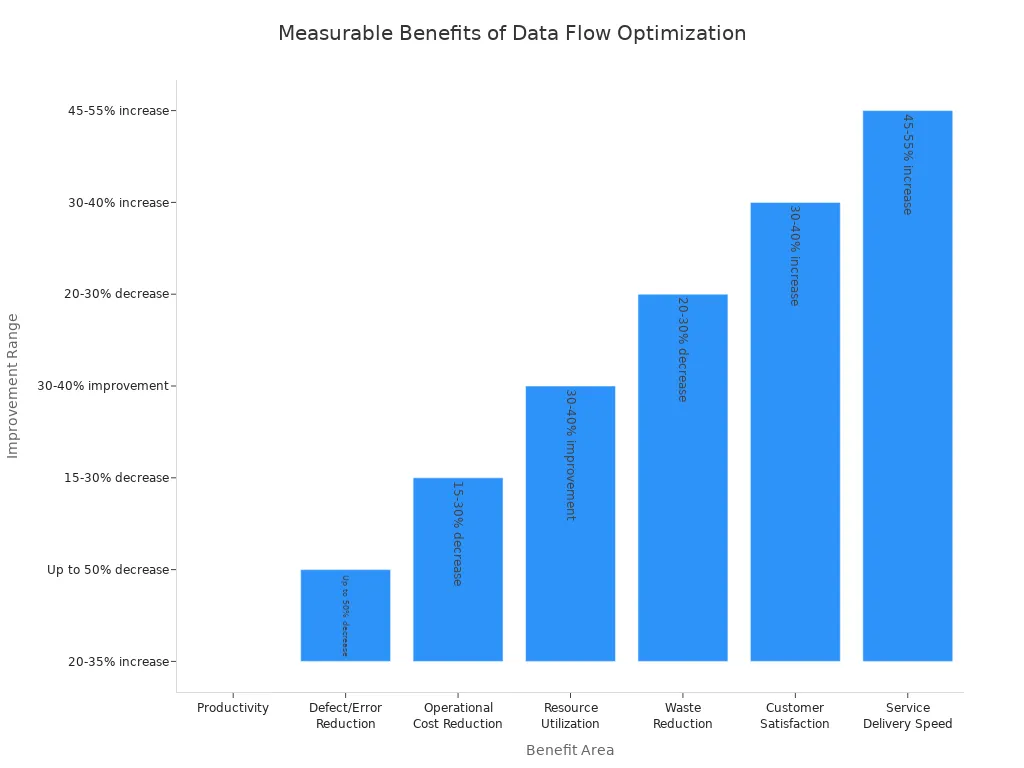
Optimizing data flow brings measurable benefits to businesses and technology environments. The table below shows how improvements in data flow can impact key areas:
| Benefit Area | Measurable Improvement Range |
| Productivity | 20-35% increase |
| Defect/Error Reduction | Up to 50% decrease |
| Operational Cost Reduction | 15-30% decrease |
| Resource Utilization | 30-40% improvement |
| Waste Reduction | 20-30% decrease |
| Customer Satisfaction | 30-40% increase |
| Service Delivery Speed | 45-55% increase |
For example, a logistics company improved delivery times by 25% and customer satisfaction by 30% after optimizing its data flow systems. A healthcare facility reduced patient wait times by 40%, which increased patient satisfaction. A manufacturing firm raised production output by 25% and cut defect rates by 50% using better data flow and compliance practices.
Optimizing data flow not only boosts operational metrics but also enhances customer satisfaction and loyalty. Even a small increase in customer satisfaction can lead to higher retention and profits. Since keeping existing customers costs less than finding new ones, these gains give businesses a strong competitive edge.
Recent years have seen major changes in data flow systems. Organizations have moved from centralized batch processing to distributed, real-time, event-driven architectures. Open-source tools like Apache Kafka and Apache Flink support scalable, low-latency data streaming. Cloud-native services make it easier to manage data flow systems. Data engineering now includes best practices from software development, such as agile methods and version control. Teams focus more on data modeling, quality, and orchestration. Data governance and compliance have become more important as data volumes grow and regulations tighten.
Trends in data flow system development include:
Widespread use of AI in business functions, with half of organizations already adopting it.
Growth in predictive and augmented analytics for better insights.
Expansion of the Big Data market, driven by real-time processing and in-memory computation.
Integration of IoT devices, which generate large volumes of data and require advanced data flow systems.
| Trend | Description | Importance and Impact |
| AI-driven Data Pipelines | Data pipelines designed to feed AI applications with structured and unstructured data from diverse sources. | Enables real-time AI interactions and advanced analytics; critical for operational efficiency and customer experience. |
| AI-Assisted Pipeline Development | Use of AI tools to automate pipeline creation tasks like SQL query generation and API connections. | Reduces development time and expertise needed; democratizes data engineering and accelerates innovation. |
| Platformization of Data Management | Consolidation of multiple data tools into unified platforms offering ingestion, transformation, and orchestration. | Reduces complexity and cost; improves operational efficiency by minimizing vendor sprawl. |
| Resurgence of Data Lakes | Renewed adoption of scalable, cost-effective data lakes using technologies like Apache Iceberg and Delta Lake. | Supports storage of vast unstructured data essential for AI/ML workloads; improves interoperability. |
| Zero ETL and Direct Integrations | Native integrations allowing data access without traditional ETL processes. | Simplifies data management and reduces costs; challenges include managing siloed data and maintaining historical snapshots. |
Data mesh and decentralized data architectures have also gained popularity. These models give teams more control over their own data, improving quality and collaboration. Real-time analytics and stream processing allow companies to act on information immediately. For example, Uber processes billions of events daily, enabling fast business decisions.
Regulatory compliance shapes how organizations design and manage data flow. Laws and standards require strict controls over how data moves and who can access it. Data governance frameworks help organizations meet these requirements, reduce risk, and build trust with customers. As data flow systems evolve, compliance and governance will remain essential for success.
Data Flow Systems
Components
A data flow system relies on several core components that work together to move and transform information. Each part plays a unique role in the data flow process:
Processes: These handle the transformation of data. For example, an order processing step in an online store changes raw order details into shipping instructions.
Data Stores: These serve as repositories for information, such as customer databases or inventory records.
Data Flows: These show the paths data takes between processes, data stores, and external sources or destinations. Arrows often represent these routes in diagrams.
External Entities: These act as sources or receivers of data outside the system, like customers or partner companies.
Data flow diagrams use symbols to map out how these components interact, making it easier to visualize the movement and handling of information.
The interaction among these elements ensures that data enters from external entities, gets processed, may be stored, and then flows to other processes or back to external entities. This structure allows organizations to manage information efficiently and securely.
Architecture
The architecture of a data flow system shapes how well it can scale and remain reliable. Common patterns include layered, client-server, microservices, event-driven, and service-oriented architectures. Some systems use the pipes and filters model, while others rely on the model-view-controller approach. Each pattern addresses different needs, such as organizing tasks, handling failures, or supporting real-time operations.
| Aspect | Architectural Impact | Scalability Effect | Reliability Effect |
| Microservices | Modular, distributed components | Enables horizontal scaling | Supports fault isolation |
| Fault Isolation | Separation of concerns | Isolates failures | Improves stability |
| Scaling Techniques | Add nodes or upgrade resources | Increases capacity | Maintains availability |
| Performance Optimization | Caching, load balancing, asynchronous processing | Boosts throughput | Ensures consistent speed |
A well-designed data architecture uses simple, loosely coupled modules. This approach balances maintainability with growth and reliability. Teams often start by outlining requirements, sketching the high-level design, and planning for future scaling. They monitor the system and adapt as usage increases. Data flow mechanisms, such as streaming or batch processing, help meet different business needs and keep the system responsive.
Data Flow Diagram
A data flow diagram (DFD) offers a clear, graphical way to show how information moves through a system. The main purpose of a data flow diagram is to help users and developers visualize the flow of data, understand how information enters, gets processed, and exits, and identify possible bottlenecks or security risks. DFDs play a key role in system analysis by mapping data paths and supporting compliance, especially when tracking sensitive information. A context diagram, which is a type of DFD, gives a high-level overview of the system and its external entities.
Symbols
A data flow diagram uses standard symbols to represent its four core components. Each symbol has a specific meaning:
| Symbol Name | Representation | Meaning/Function |
| External Entity | Rectangle (square) | Shows sources or destinations outside the system, such as users or other systems. |
| Process | Circle or rounded rectangle | Indicates activities that transform incoming data into outgoing data. |
| Data Store | Two parallel lines or open-ended rectangle | Marks where data is stored for later use. |
| Data Flow | Arrow | Displays the movement and direction of data between entities, processes, and data stores. |
A logical dfd focuses on what the system does, while a physical dfd shows how the system operates. Both types use these symbols to keep diagrams clear and consistent.
How to Read
To read a data flow diagram, start by identifying the external entities. These set the boundaries of the system. Next, look for processes that transform data. Data stores hold information for later use. Arrows show the direction and path of data flow between components. A context diagram provides a simple view, while more detailed DFDs break down processes into smaller steps.
Follow these steps to interpret a DFD:
Find the external entities to see where data enters or leaves the system.
Identify the main processes that change or route data.
Locate data stores to understand where information is kept.
Trace the arrows to follow the movement of data.
Check for clear labels and avoid cluttered diagrams.
A logical dfd models the system’s functions, while a physical dfd shows the actual implementation. Both help users avoid misunderstandings and maintain accurate documentation. For example, a DFD for an online store might show customers (external entities) placing orders (process), storing order details (data store), and sending shipping information (data flow).
Common mistakes include missing data flows, incorrect arrow directions, or connecting data stores directly to external entities without a process. Keeping diagrams simple and using standard symbols helps everyone understand the system.
Data Flow Diagrams
Mapping
Data flow mapping helps teams visualize how information travels through a system. They use data flow diagrams to create clear data flow maps that show each step in a process. The mapping process starts when a team chooses a specific process to analyze. They list every activity and person involved, including all inputs and actions. The team arranges these steps in the correct order to form a complete workflow. After that, they draw the flowchart using standard symbols found in dfd diagrams. Reviewing the diagram with the team ensures accuracy. The final step involves analyzing the data flow map to find problems and improve efficiency.
Data flow mapping focuses on the path data takes and the systems involved. Teams use ovals for start and end points, rectangles for tasks, arrows for flow, diamonds for decisions, and parallelograms for data. These symbols help create standardized data flow maps that everyone can understand.
The mapping process allows teams to break down complex workflows into manageable parts. They identify bottlenecks and redundancies by tracing each data movement. Data flow diagrams differ from other system models because they emphasize movement and transformation, not just data structure. Dfd diagrams provide a process-oriented view, while other diagrams focus on relationships or architecture.
| Step | Description |
| Identify Process | Select a process that needs mapping |
| List Activities | Document all actions and people involved |
| Arrange Workflow | Order steps for a complete process |
| Draw Diagram | Use dfd symbols to create the data flow map |
| Review | Check for accuracy with the team |
| Analyze | Find problems and optimize the process |
Use Cases
Organizations rely on data flow diagrams for many practical reasons. They use dfd diagrams to visualize how data moves within a system. This helps them spot inefficiencies and areas for improvement. Data flow mapping acts as a blueprint for developers, making complex processes easier to understand. Teams use different levels of dfd diagrams to zoom in on details or view the system as a whole.
Data flow maps support troubleshooting and system refinement. They validate requirements and assess the impact of changes. Teams collaborate better when they share a common visual language. Standardized notations in dfd diagrams ensure clarity and accuracy. By breaking down systems, analysts find redundancies and inconsistencies in data flow mapping.
Common use cases for data flow diagrams include:
Software engineering: Planning architecture and improving performance.
Business management: Streamlining workflows and boosting efficiency.
Database development: Mapping data flow and supporting cybersecurity.
Agile development: Enabling quick improvements and real-time collaboration.
Documentation: Onboarding new team members and sharing knowledge.
Industry-specific applications appear in healthcare, finance, retail, AI, real-time processing, and IoT. For example, online purchase systems use data flow maps to track customer orders and identify bottlenecks. CRM systems manage customer data inputs and outputs with dfd diagrams. Library management systems use data flow mapping to monitor inventory and notify users.
Data flow diagrams have some limitations. They may oversimplify complex systems and miss critical details. Creating dfd diagrams for large systems takes time and expertise. Keeping data flow maps updated can be difficult when systems change often. Dfd diagrams focus on data movement, not timing or user interfaces, so other modeling tools may be needed for those aspects.
| Limitation | Explanation | Mitigation Strategy |
| Complexity | Hard to understand for large systems | Break into smaller subsystems |
| Maintenance Difficulty | Updates are challenging as systems evolve | Regularly review and update diagrams |
| Unsuitability for Real-time | Timing not represented clearly | Use other modeling techniques |
Data Flow Design
Types
Data flow design shapes how information moves through systems. Two main types exist: batch processing and streaming (real-time) processing. Batch processing collects data over time and processes it in groups. This method works well for tasks like payroll, end-of-day reports, or data warehousing. It offers simplicity and can handle large data volumes efficiently. However, batch processing often causes delays and may result in outdated information.
Streaming, or real-time processing, handles data as soon as it arrives. This approach supports instant analysis and quick responses. It fits use cases like fraud detection, network monitoring, and predictive maintenance. Real-time processing enables organizations to react to events immediately, but it requires more complex systems and higher costs.
| Aspect | Batch Data Flow Advantages | Batch Data Flow Disadvantages | Streaming Data Flow Advantages | Streaming Data Flow Disadvantages |
| Processing Style | Scheduled, large batches | Delayed results | Continuous, real-time | Complex, costly infrastructure |
| Efficiency | Cost-effective, scalable | Resource spikes | Low latency, dynamic scaling | Higher operational costs |
| Flexibility | Streamlined workflows | Inflexible | Event-driven, agile | Needs constant monitoring |
| Data Quality | Automated, improved quality | Errors affect entire batch | Immediate insights | Limited historical context |
| Use Cases | Payroll, reporting, warehousing | Stale data possible | Fraud detection, monitoring | Handling out-of-order data |
Logical and physical data flow diagrams help teams visualize these types. Logical diagrams focus on business activities and information flow. Physical diagrams show how systems implement these flows, including files, programs, and controls.
Best Practices
Effective data flow design relies on clear planning and robust tools. Teams should automate data pipelines to reduce manual errors and improve efficiency. They must document every step, from data sources to transformations and storage. Visualization tools help everyone understand the flow and spot bottlenecks.
Tip: Modular design and detailed documentation make data flow programming easier to manage and scale.
Key practices include:
Using scalable cloud platforms like Google Cloud Dataflow and Azure Synapse for elastic scaling and automation.
Integrating validation checks and regular audits to ensure data quality.
Protecting data with encryption and strict access controls.
Monitoring performance and adapting to new technologies, such as AI and machine learning, for smarter optimization.
Teams should also plan for failures. Building resilient data pipelines ensures that systems recover quickly from errors. Real-time processing often requires distributed frameworks like Apache Spark or Apache Flink. These tools help manage large data volumes and support advanced data flow programming.
Common challenges include integrating data from many sources, maintaining security, and ensuring data quality. Teams can address these by using automated integration tools, regular validation, and strong governance policies. As data pipelines grow, regular reviews and updates keep them reliable and efficient.
Understanding data flow helps people visualize how information moves, improves communication, and supports better system design. The table below highlights essential aspects of data flow:
| Aspect | Details |
| Purpose | Clarifies system operation and aids communication |
| Key Components | Process, data flow, datastore, external entity |
| Benefits | Visual clarity, exposes weaknesses, supports analysis and onboarding |
Data flow diagrams make complex processes easier to understand, boost productivity, and reveal opportunities for automation. Teams and individuals can use data flow to refine workflows, manage projects, and solve problems. Exploring resources like Microsoft Learn or scenario-based guides can deepen knowledge. Anyone can start applying data flow concepts to daily work or personal projects for lasting improvement.
FAQ
What is the main purpose of a data flow diagram?
A data flow diagram helps people see how information moves through a system. It shows where data comes from, how it changes, and where it goes. Teams use these diagrams to find problems and improve processes.
How does data flow improve business efficiency?
Data flow allows teams to spot bottlenecks and remove wasted steps. Clear data movement helps companies deliver services faster and with fewer errors. Improved data flow often leads to better customer satisfaction and lower costs.
Can data flow diagrams help with security?
Yes. Data flow diagrams show where sensitive information enters, moves, and leaves a system. Teams use these diagrams to find weak spots and add security controls. This helps protect data from leaks or unauthorized access.
What is the difference between batch and streaming data flow?
Batch data flow processes information in groups at set times. Streaming data flow handles information as soon as it arrives. Batch works well for reports or payroll. Streaming fits real-time needs like fraud detection or live monitoring.
Do all organizations need data flow diagrams?
Most organizations benefit from data flow diagrams. These diagrams help teams understand systems, train new staff, and meet compliance rules. Even small businesses can use simple diagrams to improve their daily operations.
Subscribe to my newsletter
Read articles from Community Contribution directly inside your inbox. Subscribe to the newsletter, and don't miss out.
Written by