How to Build a .NET MAUI Beeswarm Chart for Stock Price Volatility Visualization
 syncfusion
TL;DR: Learn how to create a custom .NET MAUI Beeswarm Chart using Syncfusion® to visualize stock price volatility across companies like Google, Amazon, and Netflix. This guide analyzes data modeling, clustering, and chart customization with company logos.
Welcome to our Chart of the Week blog series!
Visualizing stock volatility can be overwhelming, especially when comparing multiple companies. In this guide, we’ll show you how to build a custom .NET MAUI Beeswarm Chart using the ScatterPlot series of the Syncfusion® .NET MAUI Charts. You’ll learn how to transform raw stock data into a visually rich, interactive chart that highlights volatility patterns with company logos, making it easier to analyze distributions, identify clusters, and spot outliers in your data.
What is a Beeswarm Chart?
A Beeswarm chart is a unique type of scatter plot chart that arranges data points to prevent overlap, enhancing visualization. This specialized technique displays individual data points along a single axis employing intelligent positioning algorithms to create a distinctive Swarm pattern. It helps to make complex datasets easier to understand by showing the distribution of values, revealing patterns, clusters, and outliers that might be hidden in traditional charts.
Use cases
Financial analysis: Visualizing stock price volatility distributions across different companies.
Risk assessment: Comparing risk profiles and market behavior patterns.
Scientific research: Displaying experimental results and statistical distributions.
Market research: Analyzing customer behavior patterns and demographic data.
Quality control: Monitoring process variations and identifying outliers.
Creating a Beeswarm Chart in .NET MAUI
To create a Beeswarm Chart for stock price volatility distribution analysis in .NET MAUI, we’ll use the Syncfusion® .NET MAUI Charts package. To achieve this, we use the ScatterPlot series of the SfCartesianChart with custom series renderers and advanced positioning algorithms, as shown below.
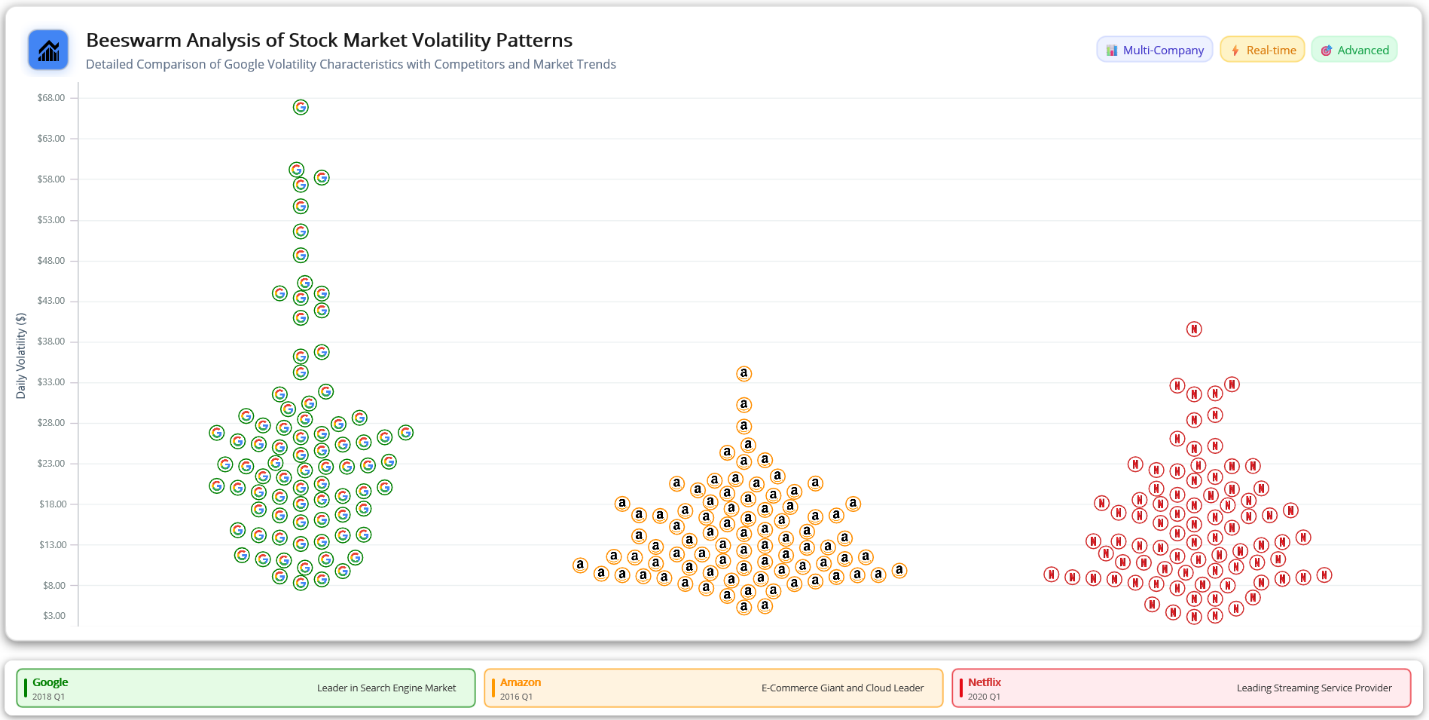
.NET MAUI Beeswarm Chart Visualizing Stock Price Volatility
Let’s explore the steps in visualizing stock volatility patterns using the Syncfusion® MAUI Cartesian Chart.
Step 1: Collecting data
To begin, we will gather comprehensive stock price data from major technology companies, focusing on daily open, high, low, close, prices, and trading volumes. This dataset includes historical data for Amazon, Google, and Netflix across different periods to capture various market conditions and volatility patterns. This data is sourced from Kaggle FAANG Complete Stock Data.
Step 2: Preparing the chart data
Before creating the Beeswarm chart, it’s essential to structure the data properly. This involves defining a BeeswarmModel and a BeeswarmViewModel, which manages data manipulation, volatility calculations, and collision detection.
Creating the BeeswarmModel
Define the data model that will represent each stock’s trading information and calculated volatility metrics, as shown below.
public class BeeswarmModel
{
    public DateTime Date { get; set; }
    public decimal Open { get; set; }
    public decimal High { get; set; }
    public decimal Low { get; set; }
    public decimal Close { get; set; }
    public decimal AdjClose { get; set; }
    public long Volume { get; set; }
    public string Company { get; set; }
    public double XPosition { get; set; }
    public IImage? CompanyLogo { get; set; }
    public decimal DailyVolatility => High - Low;
    public string FormattedVolatility => $"${DailyVolatility:F2}";
    public BeeswarmModel()
    {
        Company = string.Empty;
        XPosition = 0.5;
        CompanyLogo = null;
    }
}
Creating the BeeswarmViewModel
Create a BeeswarmViewModel to hold the data collection with advanced clustering algorithms for optimal volatility visualization, as shown below.
public class BeeswarmViewModel
{
    public ObservableCollection<BeeswarmModel> GoogleData { get; set; }
    public ObservableCollection<BeeswarmModel> AmazonData { get; set; }
    public ObservableCollection<BeeswarmModel> NetflixData { get; set; }
    public BeeswarmViewModel()
    {
        GoogleData = new ObservableCollection<BeeswarmModel>();
        AmazonData = new ObservableCollection<BeeswarmModel>();
        NetflixData = new ObservableCollection<BeeswarmModel>();
        LoadAllCompanyData();
    }
    private void LoadAllCompanyData()
    {
        var googleData = ReadCSV("Google.csv", "Google").ToList();
        var amazonData = ReadCSV("Amazon.csv", "Amazon").ToList();
        var netflixData = ReadCSV("Netflix.csv", "Netflix").ToList();
    }
    private static IEnumerable<BeeswarmModel> ReadCSV(string fileName, string companyName)
    {
        try
        {
            Assembly executingAssembly = typeof(App).GetTypeInfo().Assembly;
            string resourcePath = $"Beeswarm.Resources.Raw.{fileName}";
            using Stream? inputStream = executingAssembly.GetManifestResourceStream(resourcePath);
            if (inputStream == null)
            {
                Console.WriteLine($"CSV file not found: {resourcePath}");
                return GetSampleData(companyName);
            }
            var stockData = new List<BeeswarmModel>();
            using StreamReader reader = new(inputStream);
            string? headerLine = reader.ReadLine();
            if (headerLine == null)
            {
                Console.WriteLine($"Empty CSV file: {fileName}");
                return GetSampleData(companyName);
            }
            string? line;
            int lineNumber = 1;
            while ((line = reader.ReadLine()) != null)
            {
                lineNumber++;
                try
                {
                    var stockDataPoint = ParseCSVLine(line, companyName);
                    if (stockDataPoint != null)
                    {
                        stockData.Add(stockDataPoint);
                    }
                }
                catch (Exception ex)
                {
                    Console.WriteLine($"Error parsing line {lineNumber} in {fileName}: {ex.Message}");
                }
            }
            Console.WriteLine($"Successfully loaded {stockData.Count} records from {fileName}");
            return stockData;
        }
        catch (Exception ex)
        {
            Console.WriteLine($"Error reading CSV file {fileName}: {ex.Message}");
            return GetSampleData(companyName);
        }
    }
}
In this project, the stock collections (GoogleData, AmazonData, NetflixData) are defined in the BeeswarmViewModel class to hold separate collections for each company’s stock volatility data. The BeeswarmViewModel reads data from CSV files containing historical stock prices, calculates daily volatility metrics, and applies intelligent positioning algorithms.
Advanced clustering algorithm for tight positioning
The BeeswarmViewModel implements sophisticated collision detection and positioning logic to ensure optimal visual distribution of volatility data points. This advanced clustering algorithm prevents overlapping points while maintaining accurate volatility relationships.
private (double pixelX, double pixelY) FindPositionInRange(double preferredPixelX,
    double pixelY,
    List<(double pixelX, double pixelY, BeeswarmModel data)> placedPoints,
    double minPixelX,
    double maxPixelX)
{
    if (!HasCollision(preferredPixelX, pixelY, placedPoints, OVERLAP_DETECTION_RADIUS))
    {
        return (preferredPixelX, pixelY);
    }
    double searchStep = MIN_MOVE_DISTANCE * 0.5;
    double maxSearchRadius = (maxPixelX - minPixelX) * 0.4;
    for (double searchRadius = searchStep; searchRadius <= maxSearchRadius; searchRadius += searchStep)
    {
        double rightX = preferredPixelX + searchRadius;
        if (rightX <= maxPixelX && !HasCollision(rightX, pixelY, placedPoints, OVERLAP_DETECTION_RADIUS))
        {
            return (rightX, pixelY);
        }
        double leftX = preferredPixelX - searchRadius;
        if (leftX >= minPixelX && !HasCollision(leftX, pixelY, placedPoints, OVERLAP_DETECTION_RADIUS))
        {
            return (leftX, pixelY);
        }
    }
    double clampedX = Math.Max(minPixelX, Math.Min(maxPixelX, preferredPixelX));
    return (clampedX, pixelY);
}
Retrieve company logo images using the resource stream
In this project, incorporating company logo images enhances the visual clarity of the Beeswarm chart, allowing users to quickly associate volatility data points with specific companies. This approach makes the financial data more intuitive and easier to interpret, as visual brand elements communicate company identity faster than text labels alone.
private void LoadCompanyLogos(List<BeeswarmModel> data, string companyLogoName)
{
    foreach (var stock in data)
    {
        stock.CompanyLogo = GetCompanyLogo(companyLogoName);
    }
}

private static IImage? GetCompanyLogo(string resourcePath)
{
    try
    {
        Assembly assembly = typeof(BeeswarmViewModel).GetTypeInfo().Assembly;
        string fullPath = $"Beeswarm.Resources.Images.{resourcePath}.png";
        using Stream? stream = assembly.GetManifestResourceStream(fullPath);
        if (stream != null)
        {
            return PlatformImage.FromStream(stream);
        }
        return null;
    }
    catch (Exception ex)
    {
        Console.WriteLine($"Error loading logo {resourcePath}: {ex.Message}");
        return null;
    }
}
Step 3: Configure the Syncfusion® MAUI Toolkit
Let’s configure the Syncfusion® MAUI Toolkit control using the official documentation. To create the beeswarm effect, the X and Y Axes will be set as a NumericalAxis for volatility values and their company positioning.
<chart:SfCartesianChart>
    <chart:SfCartesianChart.XAxes>
        <chart:NumericalAxis>
        </chart:NumericalAxis>
    </chart:SfCartesianChart.XAxes>
    <chart:SfCartesianChart.YAxes>
        <chart:NumericalAxis>
        </chart:NumericalAxis>
    </chart:SfCartesianChart.YAxes>
</chart:SfCartesianChart>
Step 4: Customizing the Scatter plot series and data binding
The Syncfusion® MAUI Scatter Chart provides advanced customization options, enabling developers to create visually compelling beeswarm representations. Using custom ScatterExt and ScatterSegmentExt classes, the chart delivers company logo images instead of traditional markers, adding corporate identity and visual appeal to each volatility data point.
Create the ScatterExt class that is inherited from the ScatterPlot series. Create ScatterSegmentExt that inherits from ScatterSegment. Override the “Draw” method in ScatterSegmentExt to render company logo images.
public class ScatterExt : ScatterSeries
{
    protected override ChartSegment CreateSegment()
    {
        return new ScatterSegmentExt();
    }
}

public class ScatterSegmentExt : ScatterSegment
{
    protected override void Draw(ICanvas canvas)
    {
        base.Draw(canvas);
        if (Series is ScatterExt && Series.BindingContext is BeeswarmViewModel viewModel)
        {
            var companyData = GetCompanyData(viewModel);
            if (companyData?.CompanyLogo != null)
            {
                float imageSize = Math.Max(PointWidth, PointHeight) * 1.2f;
                float imageX = CenterX - (imageSize / 2);
                float imageY = CenterY - (imageSize / 2);
                canvas.DrawImage(companyData.CompanyLogo, imageX, imageY, imageSize, imageSize);
            }
        }
    }
    private BeeswarmModel? GetCompanyData(BeeswarmViewModel viewModel)
    {
        if (Series.ItemsSource == viewModel.GoogleData && Index < viewModel.GoogleData.Count)
            return viewModel.GoogleData[Index];
        else if (Series.ItemsSource == viewModel.AmazonData && Index < viewModel.AmazonData.Count)
            return viewModel.AmazonData[Index];
        else if (Series.ItemsSource == viewModel.NetflixData && Index < viewModel.NetflixData.Count)
            return viewModel.NetflixData[Index];
        return null;
    }
}
To design the Beeswarm chart, we’ll use multiple ScatterExt instances for each company. Ensure the ViewModel class is properly configured to bind its properties to the chart’s BindingContext. Refer to the following code example, where the ScatterExt is updated with the respective ItemsSource, XBindingPath, and YBindingPath properties.
<ContentPage xmlns="http://schemas.microsoft.com/dotnet/2021/maui"
             xmlns:x="http://schemas.microsoft.com/winfx/2009/xaml"
             xmlns:chart="clr-namespace:Syncfusion.Maui.Toolkit.Charts;assembly=Syncfusion.Maui.Toolkit"
             xmlns:local="clr-namespace:Beeswarm"
             x:Class="Beeswarm.MainPage">
    <chart:SfCartesianChart>
        <local:ScatterExt ItemsSource="{Binding AmazonData}"
                          XBindingPath="XPosition"
                          YBindingPath="DailyVolatility">
        </local:ScatterExt>
        <local:ScatterExt ItemsSource="{Binding GoogleData}"
                          XBindingPath="XPosition"
                          YBindingPath="DailyVolatility">
        </local:ScatterExt>
        <local:ScatterExt ItemsSource="{Binding NetflixData}"
                          XBindingPath="XPosition"
                          YBindingPath="DailyVolatility">
        </local:ScatterExt>
    </chart:SfCartesianChart>
</ContentPage>
Step 5: Chart customization
Enhance the appearance of the Syncfusion® .NET MAUI Charts by customizing its elements, such as the title, axes, and tooltip.
Chart title customization
The Title property in the Syncfusion® .NET MAUI Charts plays a vital role in improving the chart’s clarity and context. It enables you to set a descriptive title that effectively communicates the purpose of the historical visualization, helping users easily grasp the volatility difference data being showcased.
<Border Margin="15,15,15,5"
        Padding="5"
        StrokeThickness="0"
        StrokeShape="RoundRectangle 12">
    <Grid>
        <Grid.RowDefinitions>
            <RowDefinition Height="Auto"/>
            <RowDefinition Height="Auto"/>
        </Grid.RowDefinitions>
        <Grid.ColumnDefinitions>
            <ColumnDefinition Width="50"/>
            <ColumnDefinition Width="*"/>
            <ColumnDefinition Width="Auto"/>
        </Grid.ColumnDefinitions>
        <Border Grid.Row="0"
                Grid.Column="0"
                Grid.RowSpan="2"
                BackgroundColor="#4285F4"
                StrokeShape="RoundRectangle 10"
                WidthRequest="45"
                HeightRequest="45"
                HorizontalOptions="Center"
                VerticalOptions="Center"
                Margin="0,2,0,0">
            <Border.Shadow>
                <Shadow Brush="#4285F4" Offset="0,2" Radius="8" Opacity="0.3" />
            </Border.Shadow>
            <Path Data="{StaticResource UpTrendIcon}" Fill="#FF000000" Margin="10,5,10,10">
                <Path.RenderTransform>
                    <TransformGroup>
                        <TransformGroup.Children>
                            <RotateTransform Angle="0"/>
                            <ScaleTransform ScaleX="1" ScaleY="1"/>
                        </TransformGroup.Children>
                    </TransformGroup>
                </Path.RenderTransform>
            </Path>
        </Border>
        <StackLayout Grid.Row="0"
                     Grid.Column="1"
                     Spacing="3"
                     VerticalOptions="Center"
                     Margin="15,0,10,0">
            <Label Text="Beeswarm Analysis of Stock Market Volatility Patterns"
                   FontSize="{OnPlatform Android=16, Default=20, iOS=16}"
                   FontAttributes="Bold"
                   TextColor="#1A1A1A"
                   LineBreakMode="WordWrap"/>
            <Label Text="Detailed Comparison of Google Volatility Characteristics with Competitors and Market Trends"
                   FontSize="{OnPlatform Android=11, Default=13, iOS=11}"
                   TextColor="#64748B"
                   FontAttributes="None"
                   LineBreakMode="WordWrap"/>
        </StackLayout>
        <StackLayout Grid.Row="0"
                     Grid.Column="2"
                     Spacing="8"
                     VerticalOptions="Center"
                     Margin="10,0,5,0">
            <StackLayout Orientation="Horizontal"
                         HorizontalOptions="End"
                         Spacing="6">
                  <Border BackgroundColor="#EEF2FF"
                          StrokeThickness="1"
                          Stroke="#C7D2FE"
                          StrokeShape="RoundRectangle 10"
                          Padding="8,5">
                    <StackLayout Orientation="Horizontal" Spacing="3">
                        <Label Text="📊"
                               FontSize="{OnPlatform Android=9, Default=12, iOS=9}"
                               VerticalOptions="Center"/>
                        <Label Text="Multi-Company"
                               FontSize="{OnPlatform Android=8, Default=12, iOS=8}"
                               TextColor="#4338CA"
                               VerticalOptions="Center"/>
                    </StackLayout>
                </Border>
                <Border BackgroundColor="#FEF3C7"
                        StrokeThickness="1"
                        Stroke="#FCD34D"
                        StrokeShape="RoundRectangle 10"
                        Padding="8,5">
                    <StackLayout Orientation="Horizontal" Spacing="3">
                        <Label Text="⚡"
                               FontSize="{OnPlatform Android=9, Default=12, iOS=9}"
                               VerticalOptions="Center"/>
                        <Label Text="Real-time"
                               FontSize="{OnPlatform Android=8, Default=12, iOS=8}"
                               TextColor="#D97706"
                               VerticalOptions="Center"/>
                    </StackLayout>
                </Border>
                <Border BackgroundColor="#DCFCE7"
                        StrokeThickness="1"
                        Stroke="#BBF7D0"
                        StrokeShape="RoundRectangle 10"
                        Padding="8,5">
                    <StackLayout Orientation="Horizontal" Spacing="3">
                        <Label Text="🎯"
                               FontSize="{OnPlatform Android=9, Default=12, iOS=9}"
                               VerticalOptions="Center"/>
                        <Label Text="Advanced"
                               FontSize="{OnPlatform Android=8, Default=12, iOS=8}"
                               TextColor="#16A34A"
                               VerticalOptions="Center"/>
                    </StackLayout>
                </Border>
            </StackLayout>
        </StackLayout>
    </Grid>
</Border>
Customizing the axis
Syncfusion® .NET MAUI Charts offers extensive customization options for both XAxes and YAxes, allowing users to define ranges, titles, and label styles for improved clarity and context. The IsVisible property in the axis determines whether the axis line should be displayed.
<!-- X-Axis Configuration -->
<chart:SfCartesianChart.XAxes>
      <chart:NumericalAxis Minimum = "0"
                           Maximum = "1"
                           IsVisible ="False"
                           ShowMajorGridLines ="False" >
       < /chart:NumericalAxis >
</chart:SfCartesianChart.XAxes>

<!-- Y-Axis Configuration -->
<chart:SfCartesianChart.YAxes>
    <chart:NumericalAxis Minimum="3"
                         Maximum="{Binding GetYAxisMaximum}"
                         ShowMajorGridLines="True"
                         ShowMinorGridLines="False">
        <chart:NumericalAxis.Title>
            <chart:ChartAxisTitle Text="{Binding YAxisTitle}"
                                  TextColor="#34495E"
                                  FontSize="{OnPlatform Android=10, Default=12, iOS=10}"/>
        </chart:NumericalAxis.Title>
        <chart:NumericalAxis.LabelStyle>
            <chart:ChartAxisLabelStyle LabelFormat="$0.00"
                                       TextColor="#7F8C8D"
                                       FontSize="{OnPlatform Android=9, Default=10, iOS=9}"/>
        </chart:NumericalAxis.LabelStyle>
        <chart:NumericalAxis.AxisLineStyle>
            <chart:ChartLineStyle Stroke="#BDC3C7" StrokeWidth="1"/>
        </chart:NumericalAxis.AxisLineStyle>
        <chart:NumericalAxis.MajorGridLineStyle>
            <chart:ChartLineStyle Stroke="#ECF0F1" StrokeWidth="1"/>
        </chart:NumericalAxis.MajorGridLineStyle>
    </chart:NumericalAxis>
</chart:SfCartesianChart.YAxes>
Scatter customization
Syncfusion® .NET MAUI Charts offers extensive capabilities for Scatter customization. It helps users to control point sizes and spacing for improved visual clarity and data representation. By defining PointHeight and PointWidth parameters, users can control the size of images displayed in the beeswarm pattern.
<chart:SfCartesianChart>
    <local:ScatterExt ItemsSource="{Binding AmazonData}"
                      XBindingPath="XPosition"
                      YBindingPath="DailyVolatility"
                      Fill="{Binding AmazonColor}"
                      Stroke="Green"
                      StrokeWidth="5"
                      PointHeight="12"
                      PointWidth="12"
                      Label="Amazon"
                      EnableTooltip="True">
    </local:ScatterExt>
    <local:ScatterExt ItemsSource="{Binding GoogleData}"
                      XBindingPath="XPosition"
                      YBindingPath="DailyVolatility"
                      Fill="{Binding GoogleColor}"
                      Stroke="LightGreen"
                      StrokeWidth="5"
                      PointHeight="12"
                      PointWidth="12"
                      Label="Google"
                      EnableTooltip="True">
    </local:ScatterExt>
    <!-- Netflix Data Series -->
    <local:ScatterExt ItemsSource="{Binding NetflixData}"
                      XBindingPath="XPosition"
                      YBindingPath="DailyVolatility"
                      Fill="{Binding NetflixColor}"
                      Stroke="#D32F2F"
                      StrokeWidth="5"
                      PointHeight="12"
                      PointWidth="12"
                      Label="Netflix"
                      EnableTooltip="True">
    </local:ScatterExt>
</chart:SfCartesianChart>
Tooltip customization
Syncfusion® .NET MAUI Charts offer powerful customization options for tooltips, enhancing data visualization and user engagement. Tooltips can display detailed insights for each data point, providing clarity on the underlying historical information. In the example below, tooltips are customized to showcase specific details about volatility.
<local:ScatterExt.TooltipTemplate>
    <DataTemplate>
        <Border BackgroundColor="#FF8F00"
                StrokeShape="RoundRectangle 6"
                Padding="8,6">
            <StackLayout Spacing="2">
                <Label Text="{Binding Item.Company}"
                       FontAttributes="Bold"
                       FontSize="12"
                       TextColor="White"
                       HorizontalTextAlignment="Center"/>
                <Label Text="{Binding Item.FormattedVolatility, StringFormat='Volatility: {0}'}"
                       TextColor="White"
                       FontSize="10"
                       FontAttributes="Bold"/>
                <Label Text="{Binding Item.Low, StringFormat='Low : ${0:f2}'}"
                       TextColor="White"
                       FontSize="10"
                       FontAttributes="Bold"/>
            </StackLayout>
        </Border>
    </DataTemplate>
</local:ScatterExt.TooltipTemplate>
After executing the previous code examples, the output will look like the following image.
.NET MAUI Beeswarm Chart Visualizing Stock Price Volatility
GitHub reference
For more details, refer to the project on GitHub.
Conclusion
Thank you for reading! In this blog, we’ve explored how to build a fully customized .NET MAUI Beeswarm Chart to visualize stock price volatility using Syncfusion’s powerful charting tools. This approach enhances data clarity and adds visual branding for better user engagement. We strongly encourage you to follow the steps outlined in this blog and share your feedback in the comments section below.
Existing customers can download the new version of Essential Studio® on the license and downloads page. If you are not a Syncfusion® customer, try our 30-day free trial to check our incredible features.
If you require any assistance, please don’t hesitate to contact us via our support forum, support portal, or feedback portal. We are always eager to help you!
Related Blogs
How to Build Variance Indicators Using .NET MAUI Toolkit Charts for Natural Gas Price Volatility
Create Professional Layered Column Charts for Accommodation Trends Using .NET MAUI
Easily Build an SIP Calculator Using the Syncfusion® .NET MAUI Toolkit Charts
Analyze and Track Investment Portfolios with .NET MAUI Toolkit Charts
Subscribe to my newsletter
Read articles from syncfusion directly inside your inbox. Subscribe to the newsletter, and don't miss out.
Written by
syncfusion
syncfusion
Syncfusion provides third-party UI components for React, Vue, Angular, JavaScript, Blazor, .NET MAUI, ASP.NET MVC, Core, WinForms, WPF, UWP and Xamarin.