System Design 101 : Scale from Zero to Millions of Users

Raghav  ShuklaRaghav Shukla
16 min read

In the past three years, I’ve mostly worked with startups, and the common approach was always “build fast, optimize later.” It definitely helped us move quickly, but when the user base started growing, we ran into scaling issues that were tough to handle in production.

That’s when I realized—it’s not about choosing between speed and scale. The real trick is finding a balance: shipping fast while also putting just enough foundation in place so the system can handle growth. After all, every startup dreams of reaching a million users, and being a little prepared early makes the ride much smoother.

Recently, while learning more about system design and reading the ByteByteGo book, I picked up a few lessons that I think are worth sharing.

Single Server Setup

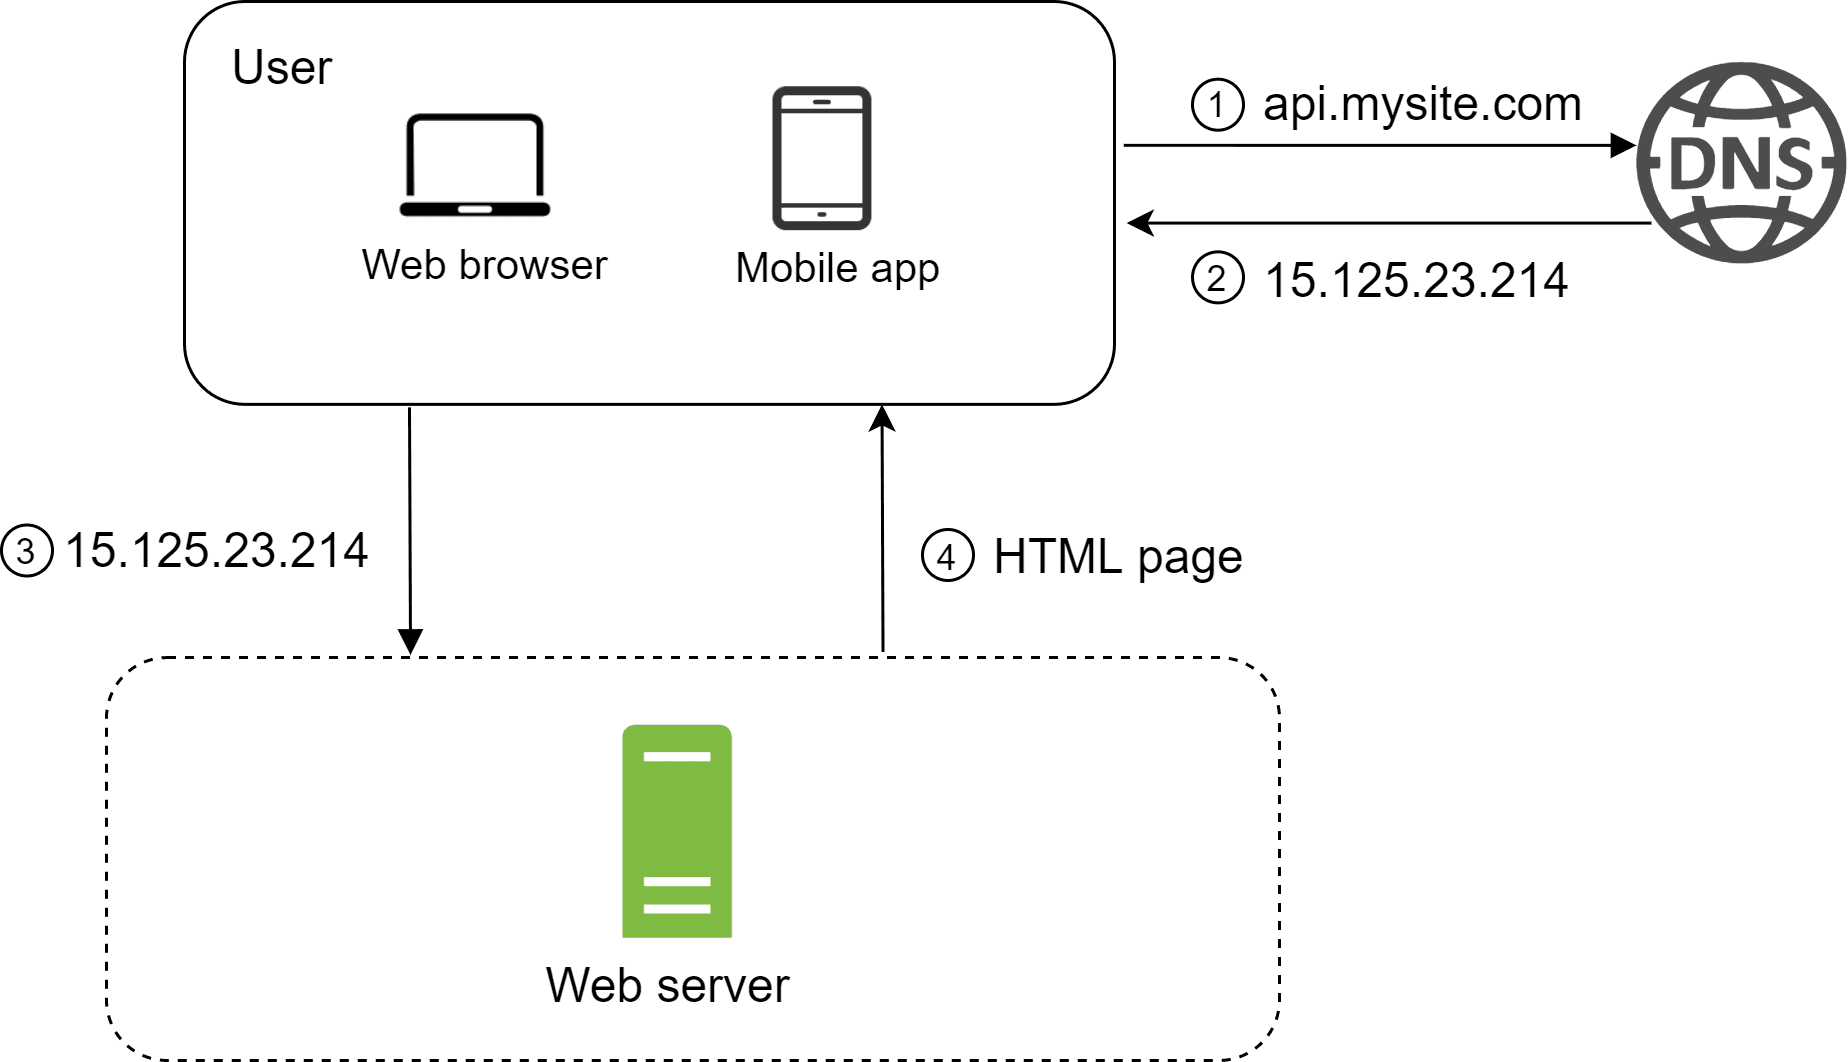
To keep things simple, we’ll start by running everything on a single server. When a user accesses the website by entering a domain name like raghavdev.in, the DNS server returns the corresponding IP address. Once the IP is received, the browser sends an HTTP request to our server, which then responds with either HTML or JSON for rendering. This forms the initial setup of our system.
This is how the initial setup will look like.

Image represents a simplified client-server architecture diagram illustrating the process of accessing a website.  A user, represented by a web browser and a mobile app icons within a rounded rectangle labeled 'User,' initiates the process.  The user's device first sends a request (1) to a DNS server with the domain name 'api.mysite.com'. The DNS server responds (2) with the IP address '15.125.23.214'.  The user's device then uses this IP address (3) to connect to a web server, depicted as a green rectangle labeled 'Web server' within a dashed-line box.  The web server sends back an HTML page (4) to the user's device, completing the request.  The arrows indicate the direction of information flow, showing the request and response between the user's device, the DNS server, and the web server.  Numbers in circles correspond to the steps in the process.

Database

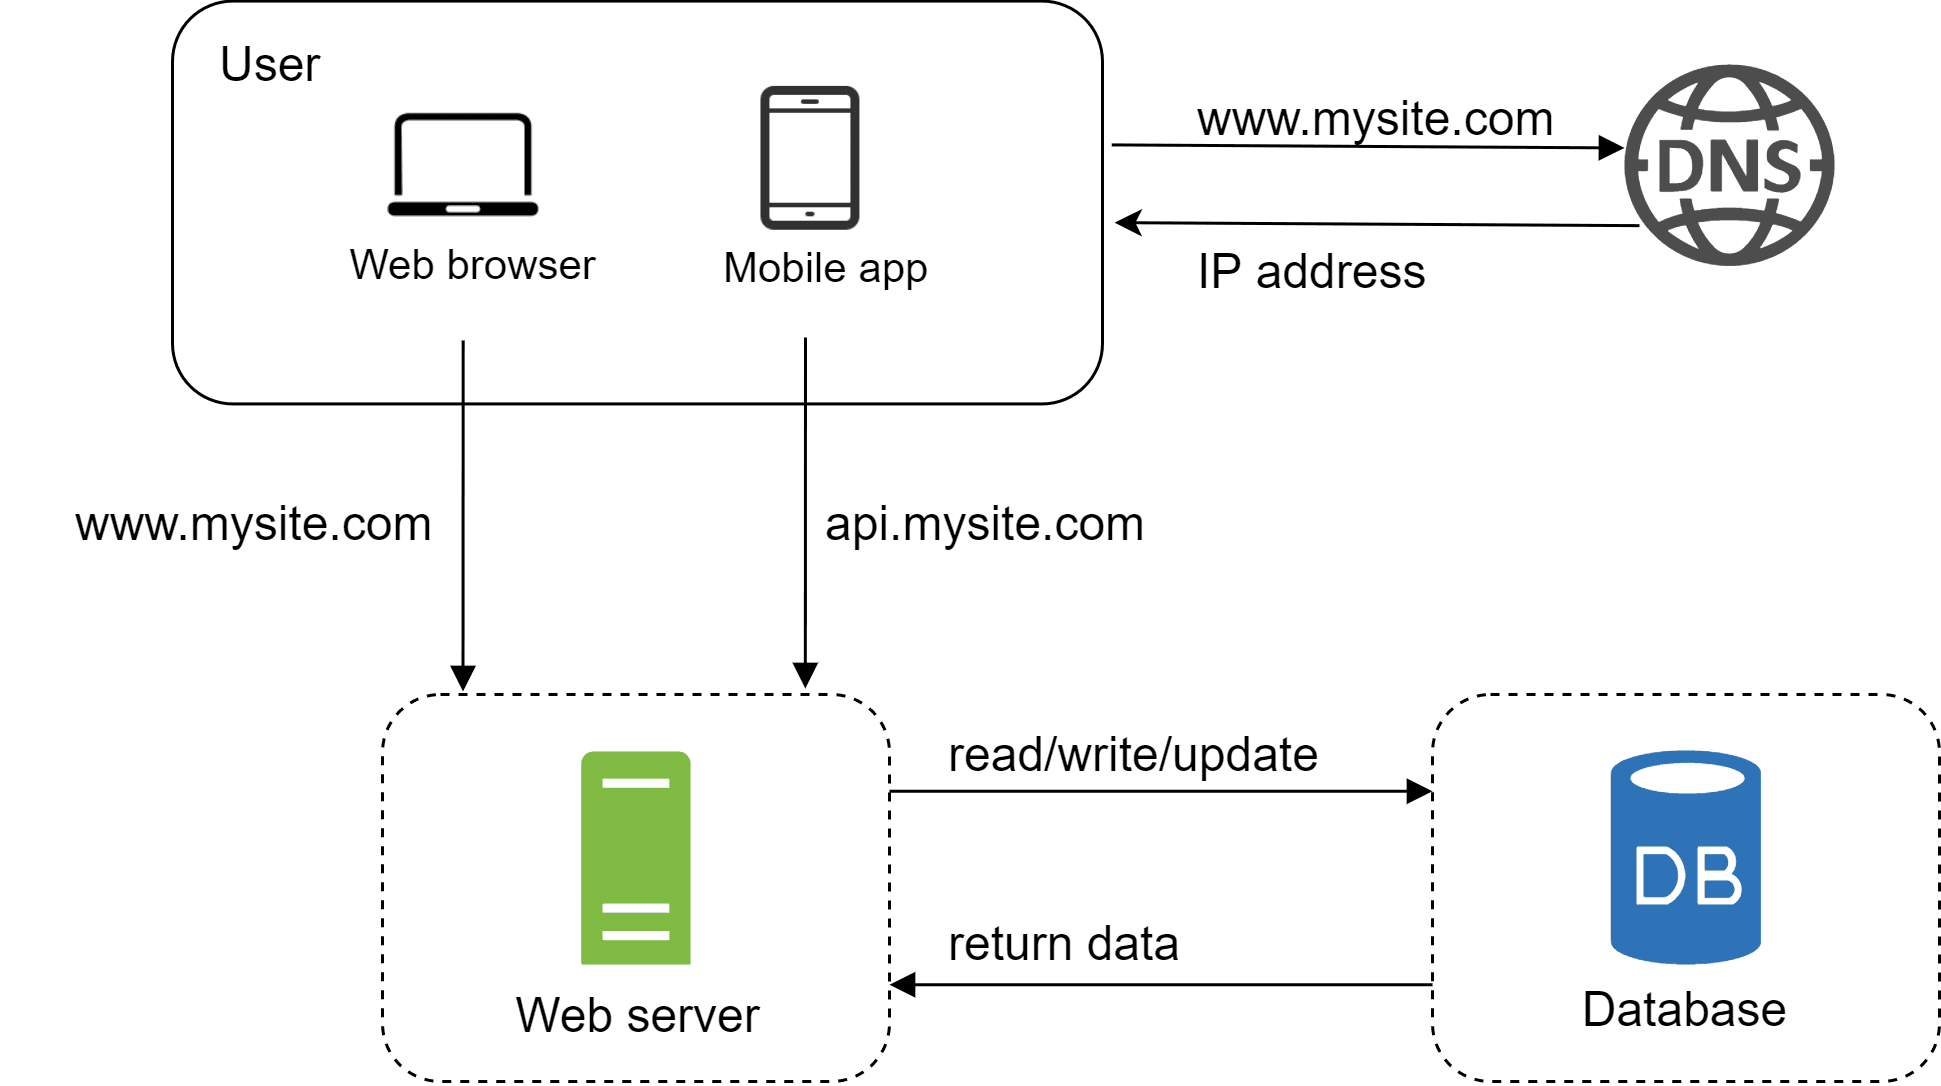
As we discussed earlier, the single server setup works well in the beginning, but it quickly becomes a limitation once the user base starts growing. To scale more effectively, we need to separate the web server and the database so that each can grow independently.

Image represents a simplified system architecture diagram showing the interaction between a user, a website, and a database.  A user, accessing via either a web browser or a mobile app, initiates a request to . This domain name is resolved to an IP address via a DNS (Domain Name System) server. The request then reaches a web server, labeled as such, which handles  requests.  Simultaneously, the mobile app makes a request to , which also points to the same web server. The web server acts as an intermediary, sending  requests to a database (labeled 'DB') and receiving 'return data' in response.  The dashed lines around the web server and database suggest these are separate components or services.  The overall flow depicts a typical client-server architecture with a database backend.

Now big question arises

Which Database to choose?

Basically there are 2 types of database :

  • SQL (Relational Databases) → Store data in tables with rows and columns. Popular examples are MySQL and PostgreSQL.

  • NoSQL (Non-Relational Databases) → Store data in more flexible formats like key-value pairs, documents, graphs, or columns. Examples include MongoDB, Cassandra, Neo4j, CouchDB, and Amazon DynamoDB.

    The right choice depends on the project’s requirements, and in many cases, teams even combine multiple databases to meet different use cases.
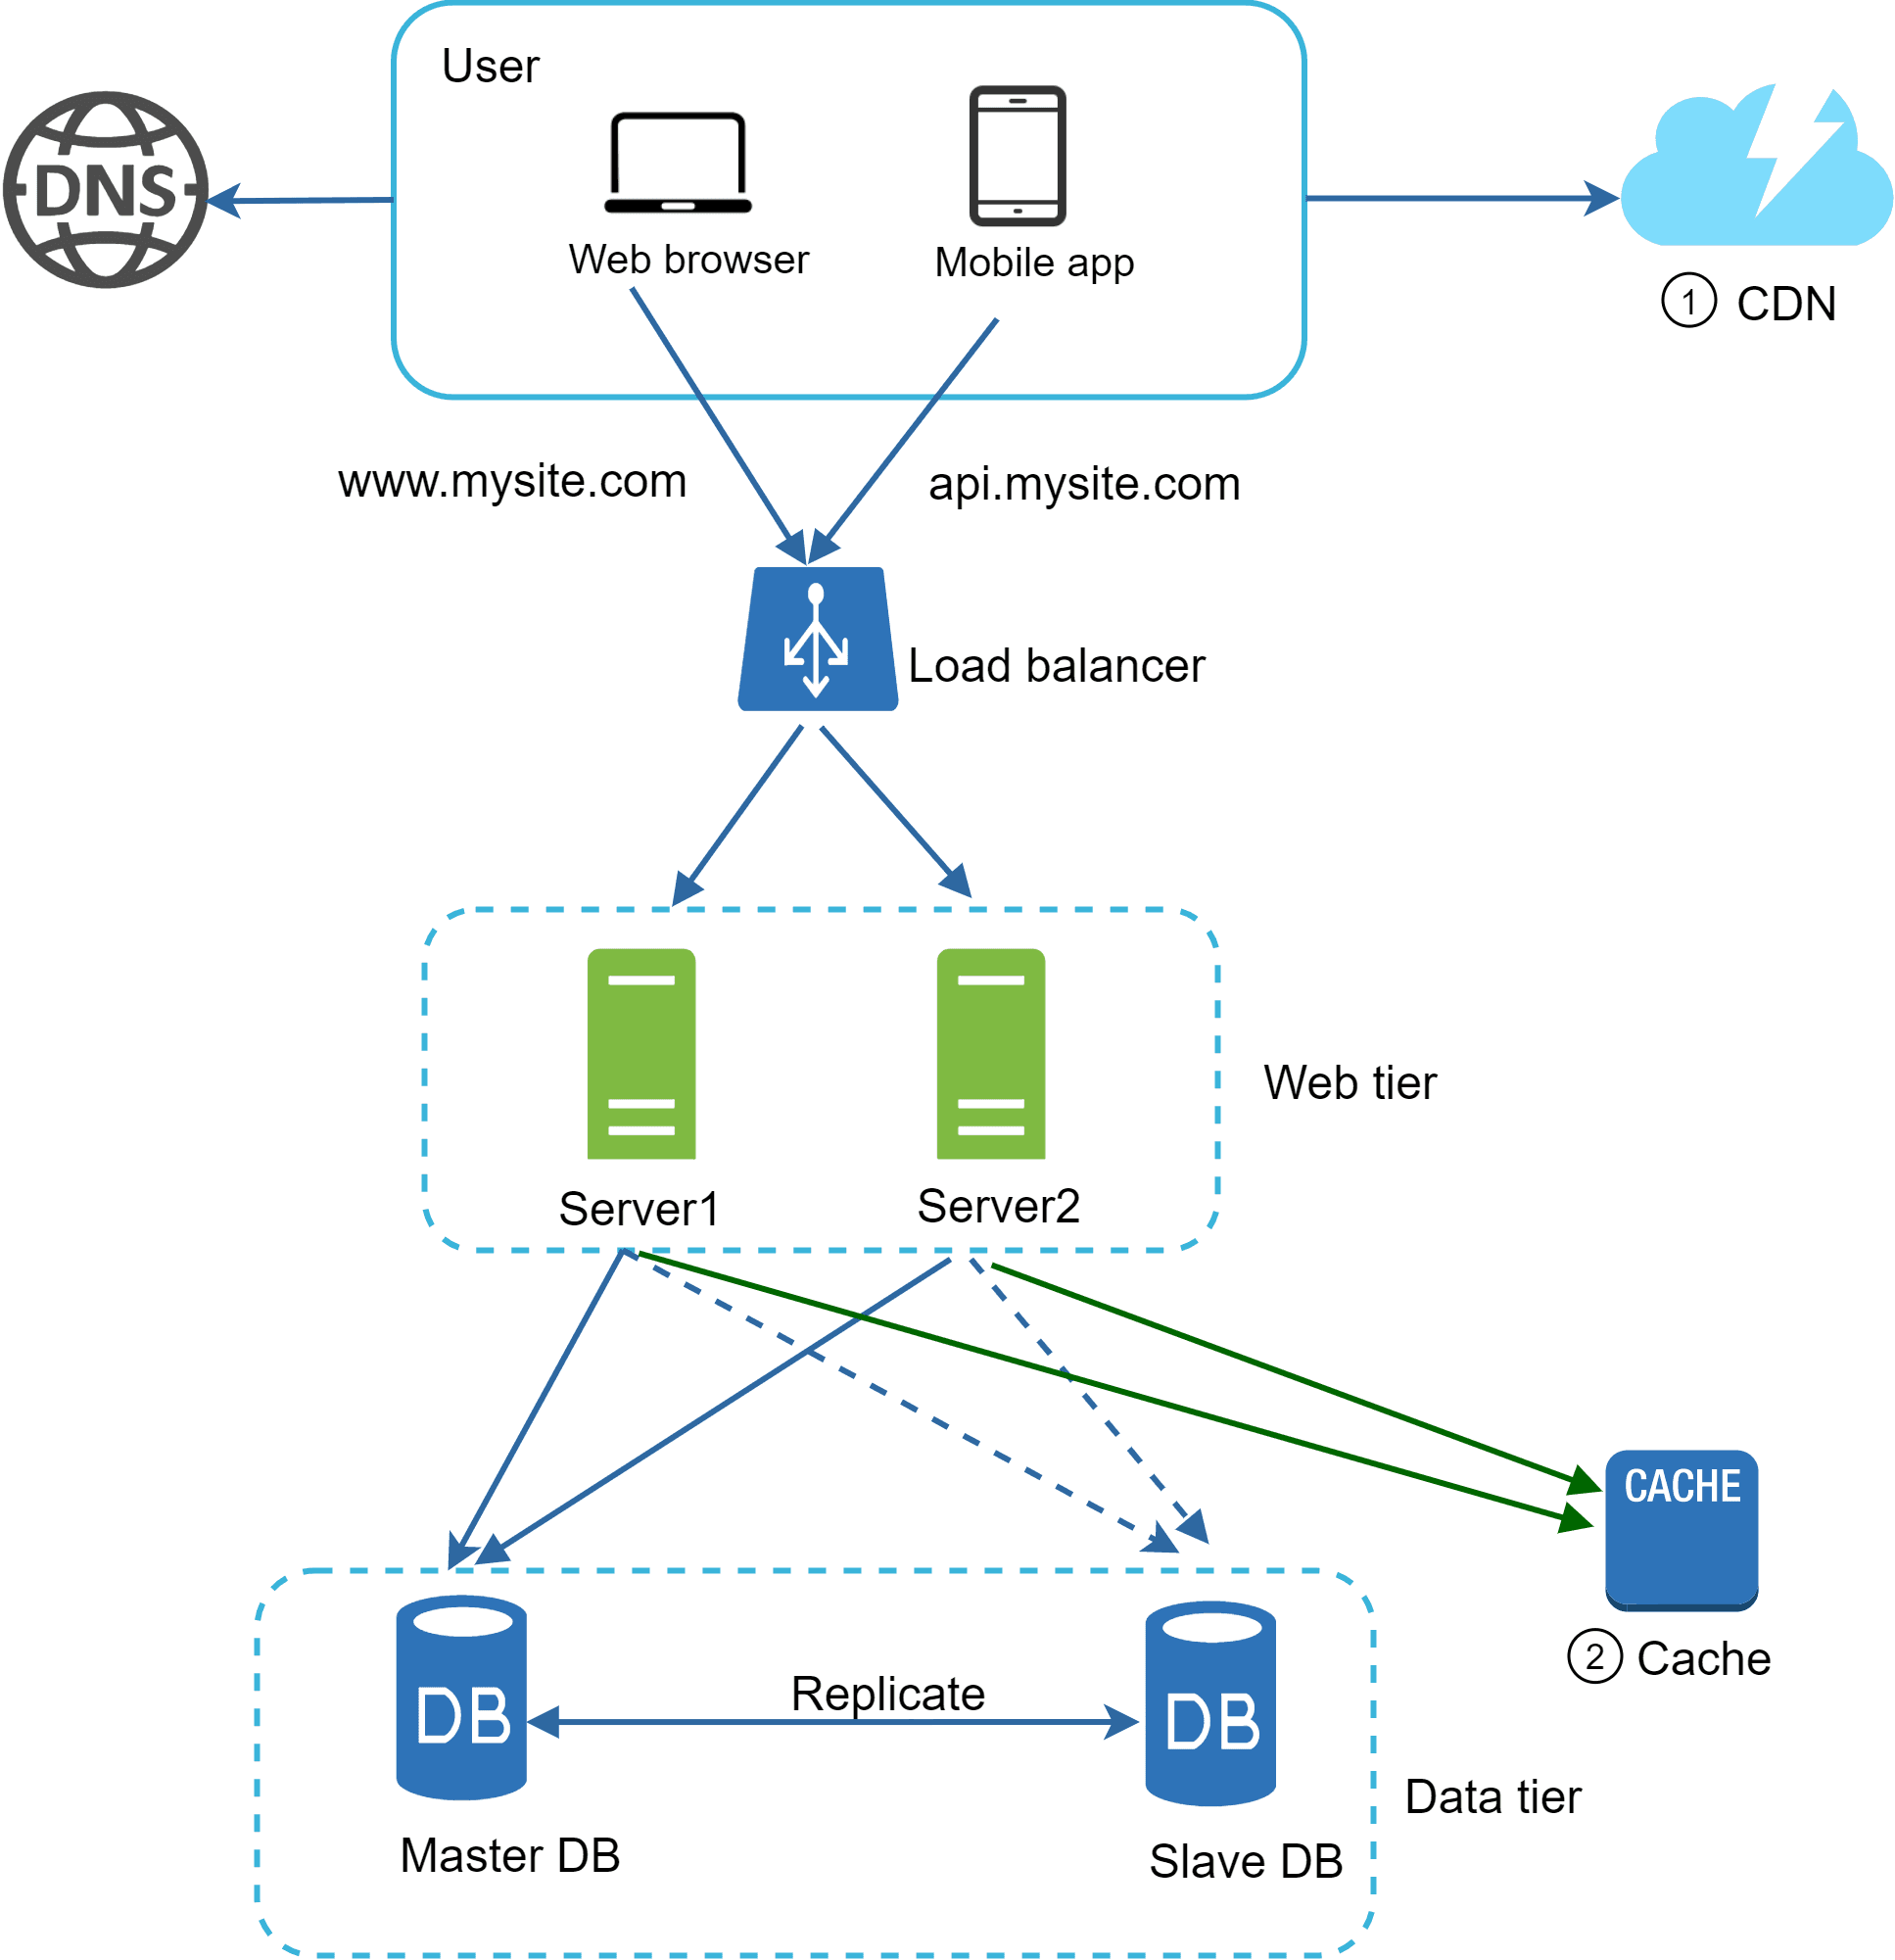
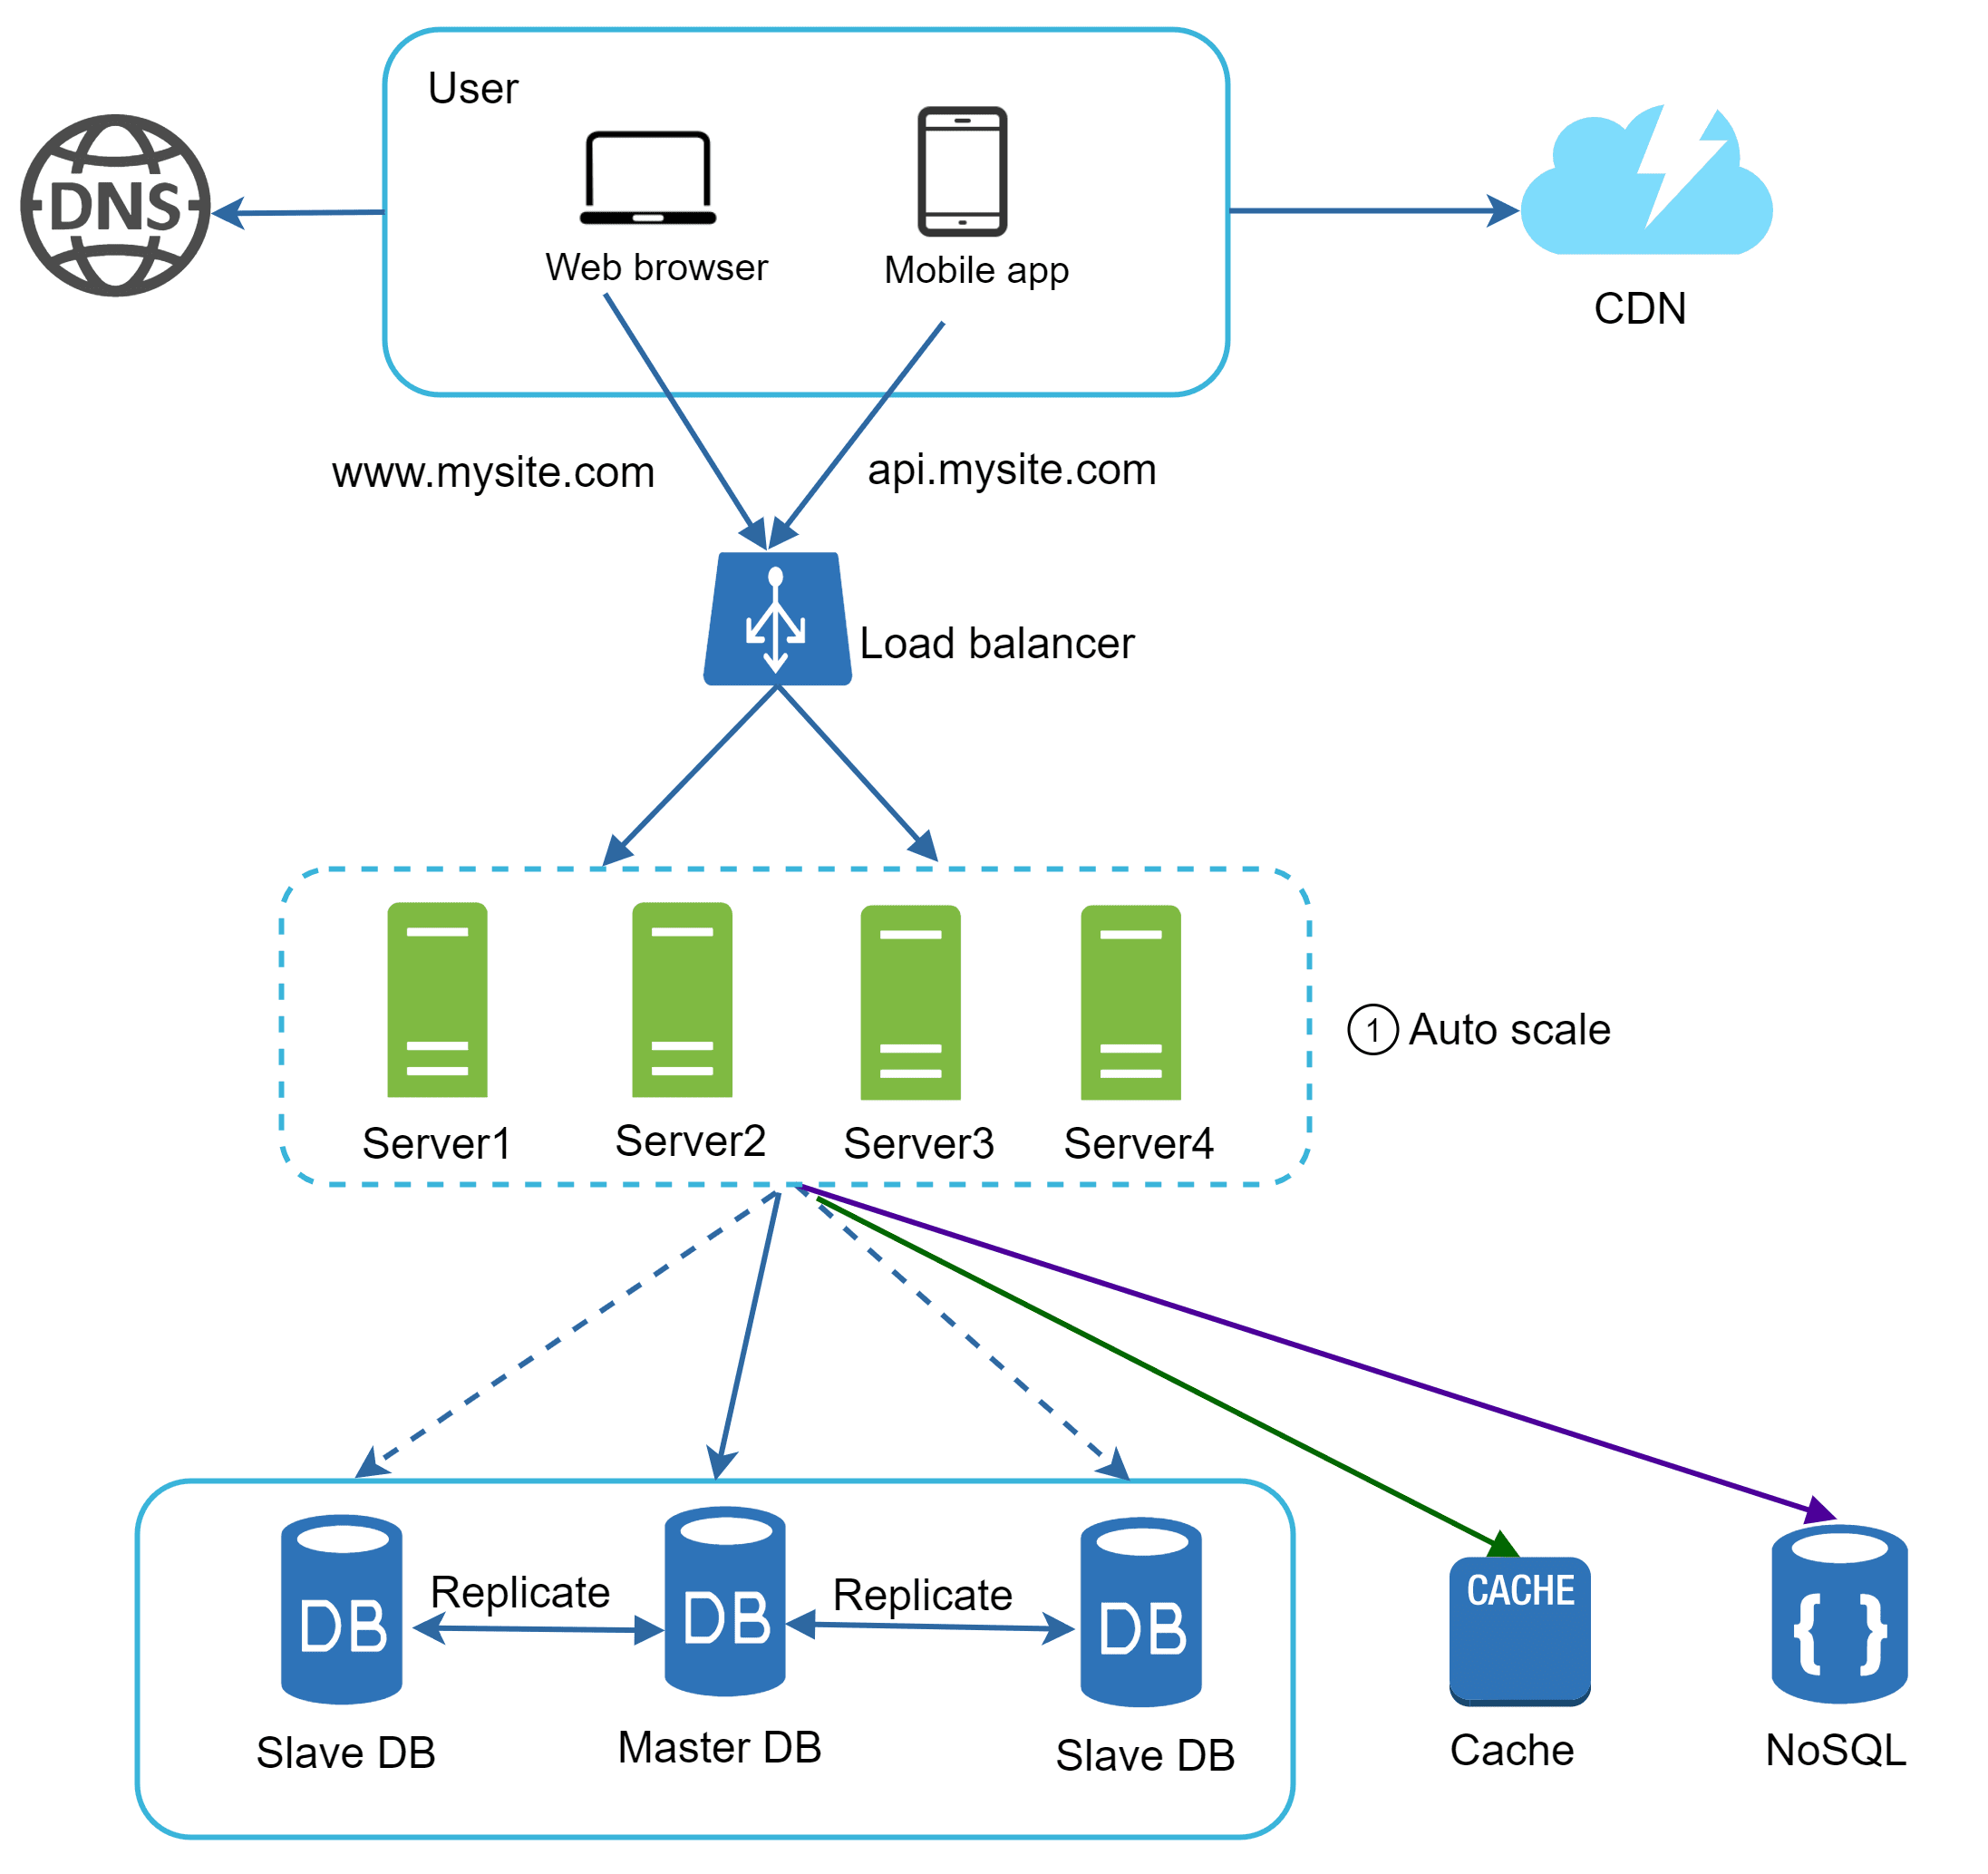
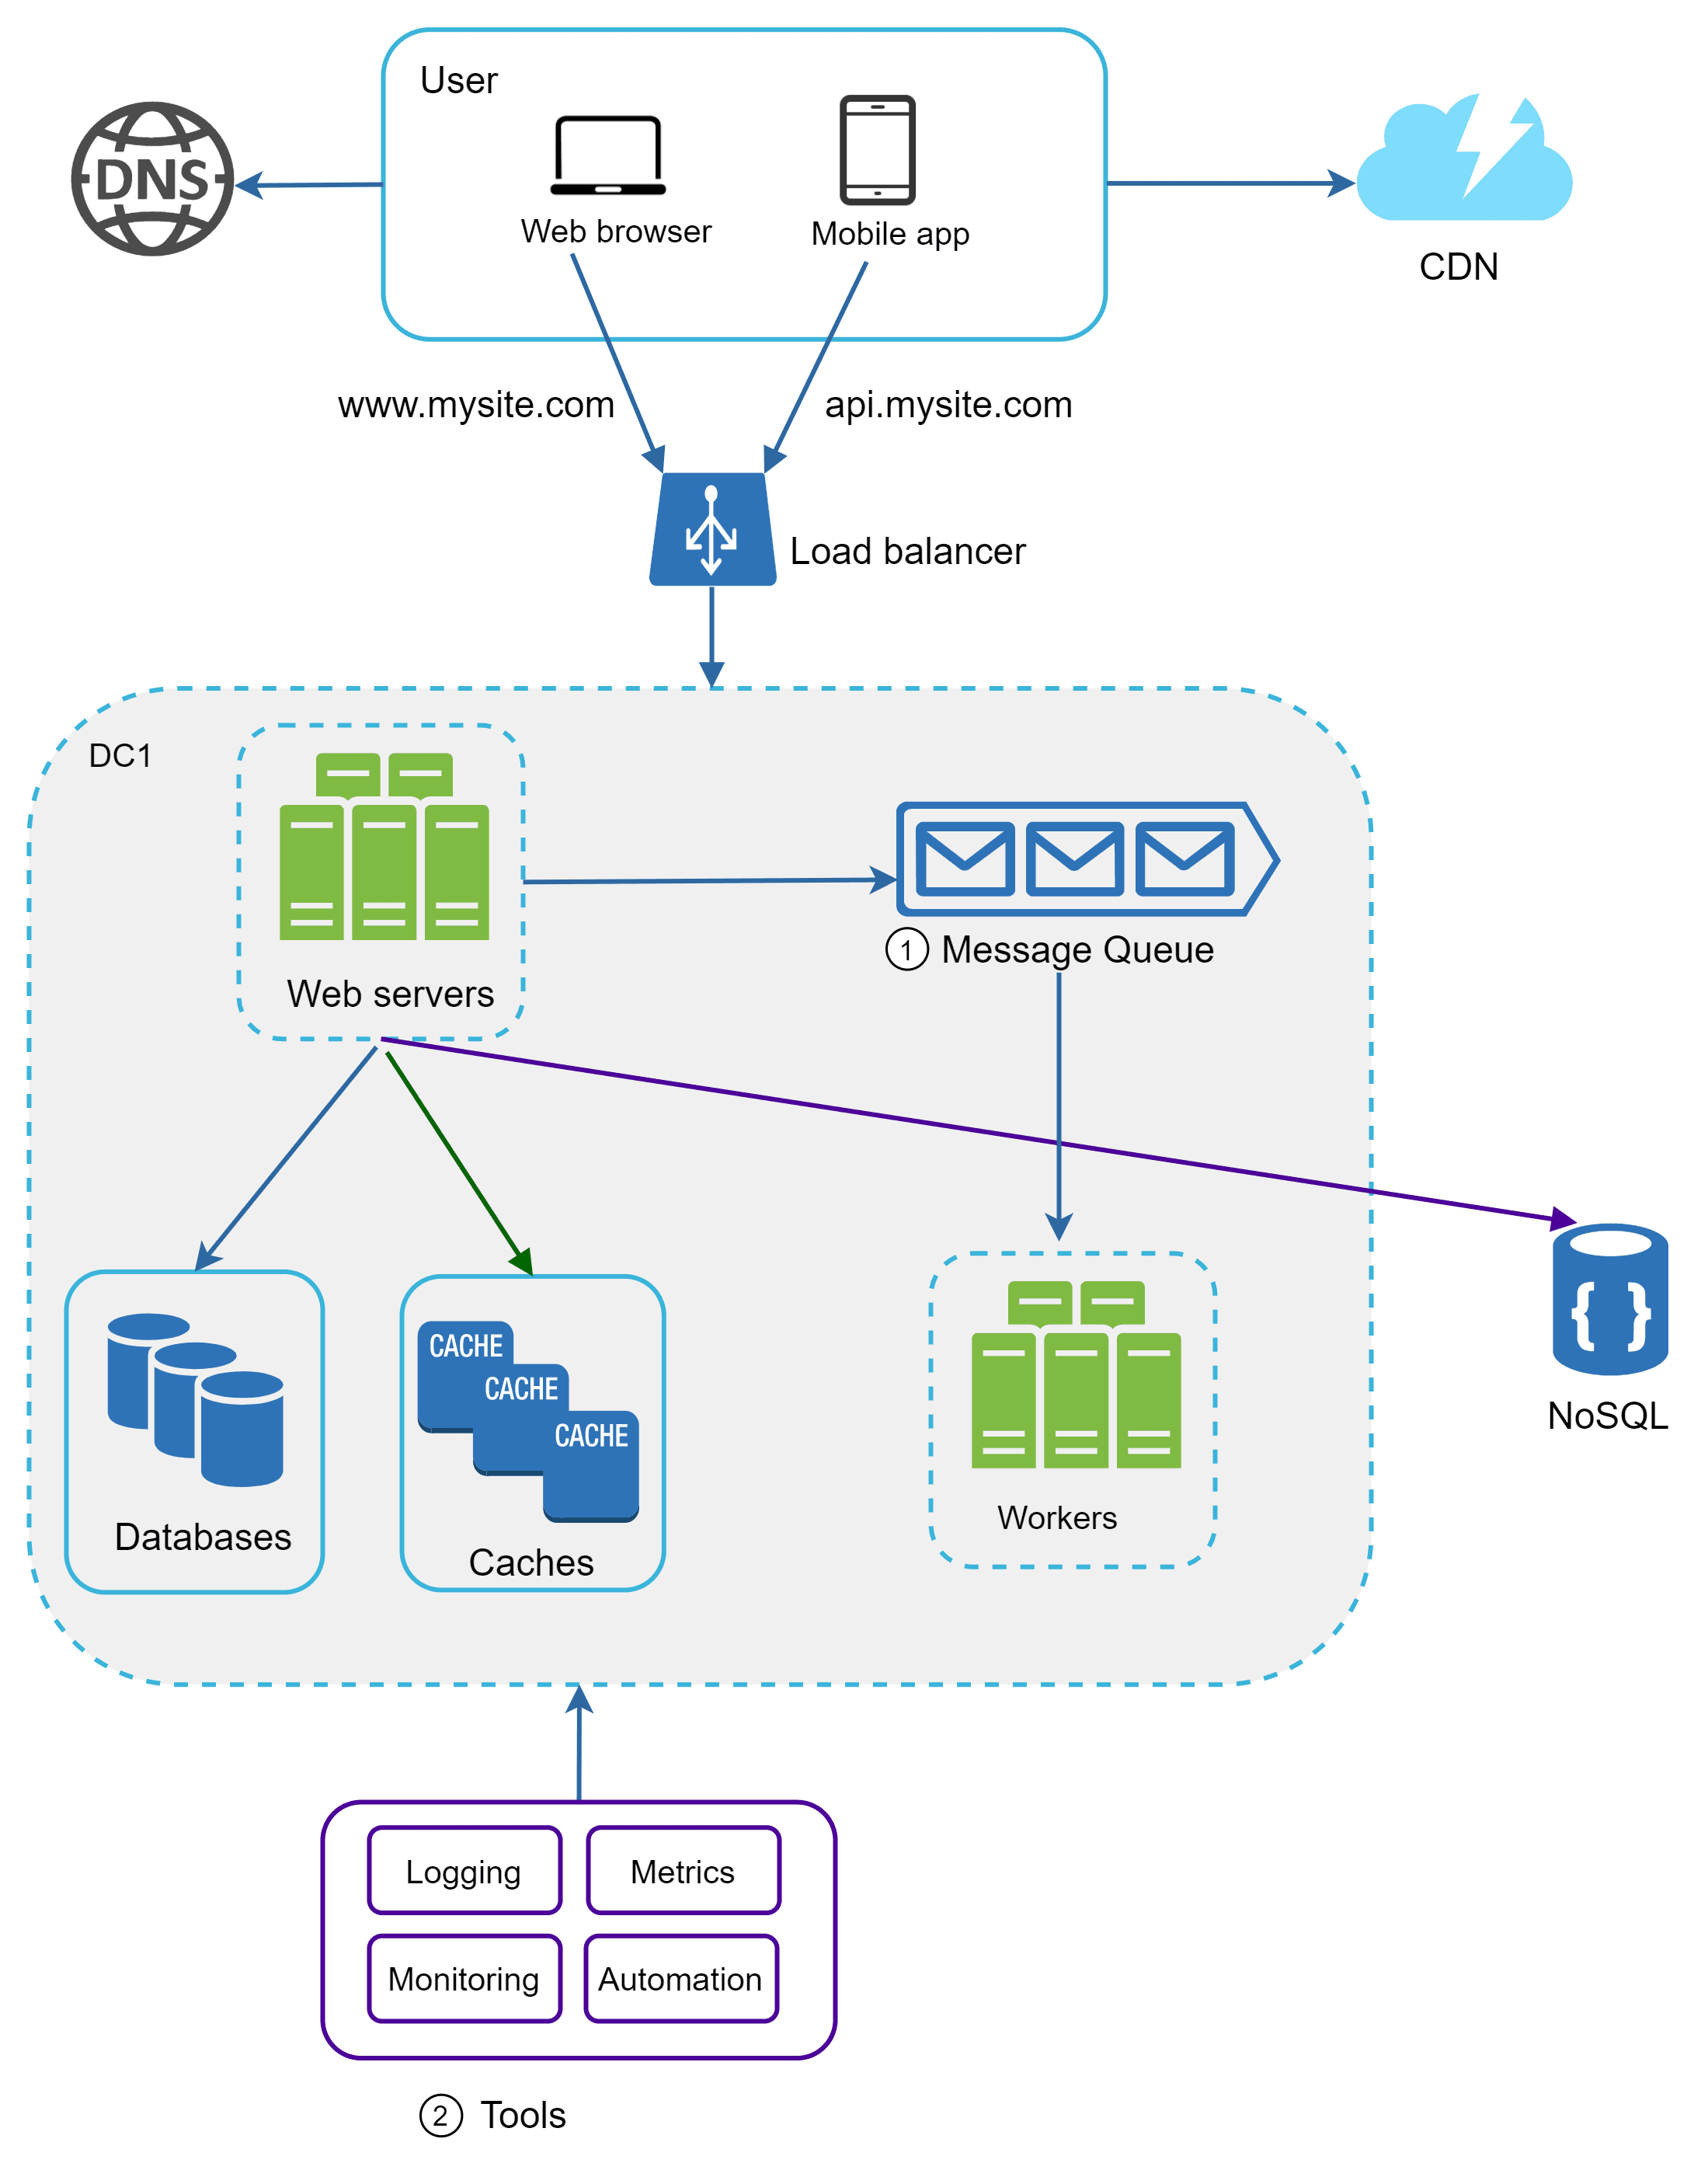
Load Balancer

Now that the web server and database are separated, a new problem arises when many users access the website at the same time. Once the server limit is reached, responses slow down, which is something we don’t want. To handle this, we add a Load Balancer that evenly distributes incoming traffic across multiple servers.

Image represents a simplified client-server architecture with load balancing.  A user, accessing via either a web browser or mobile app, initiates a request to . This request first goes to a DNS server, which resolves the domain name  to its corresponding public IP address, .  This IP address points to a load balancer, which receives the request from the user over the public IP. The load balancer then forwards the request to one of two servers (Server1 or Server2) using their private IP addresses ( and  respectively), distributing the load between them.  A table shows the domain name and its associated IP address mapping used by the DNS server.  The two servers are grouped within a dashed-line box, visually representing their internal network.  The arrows indicate the direction of information flow.

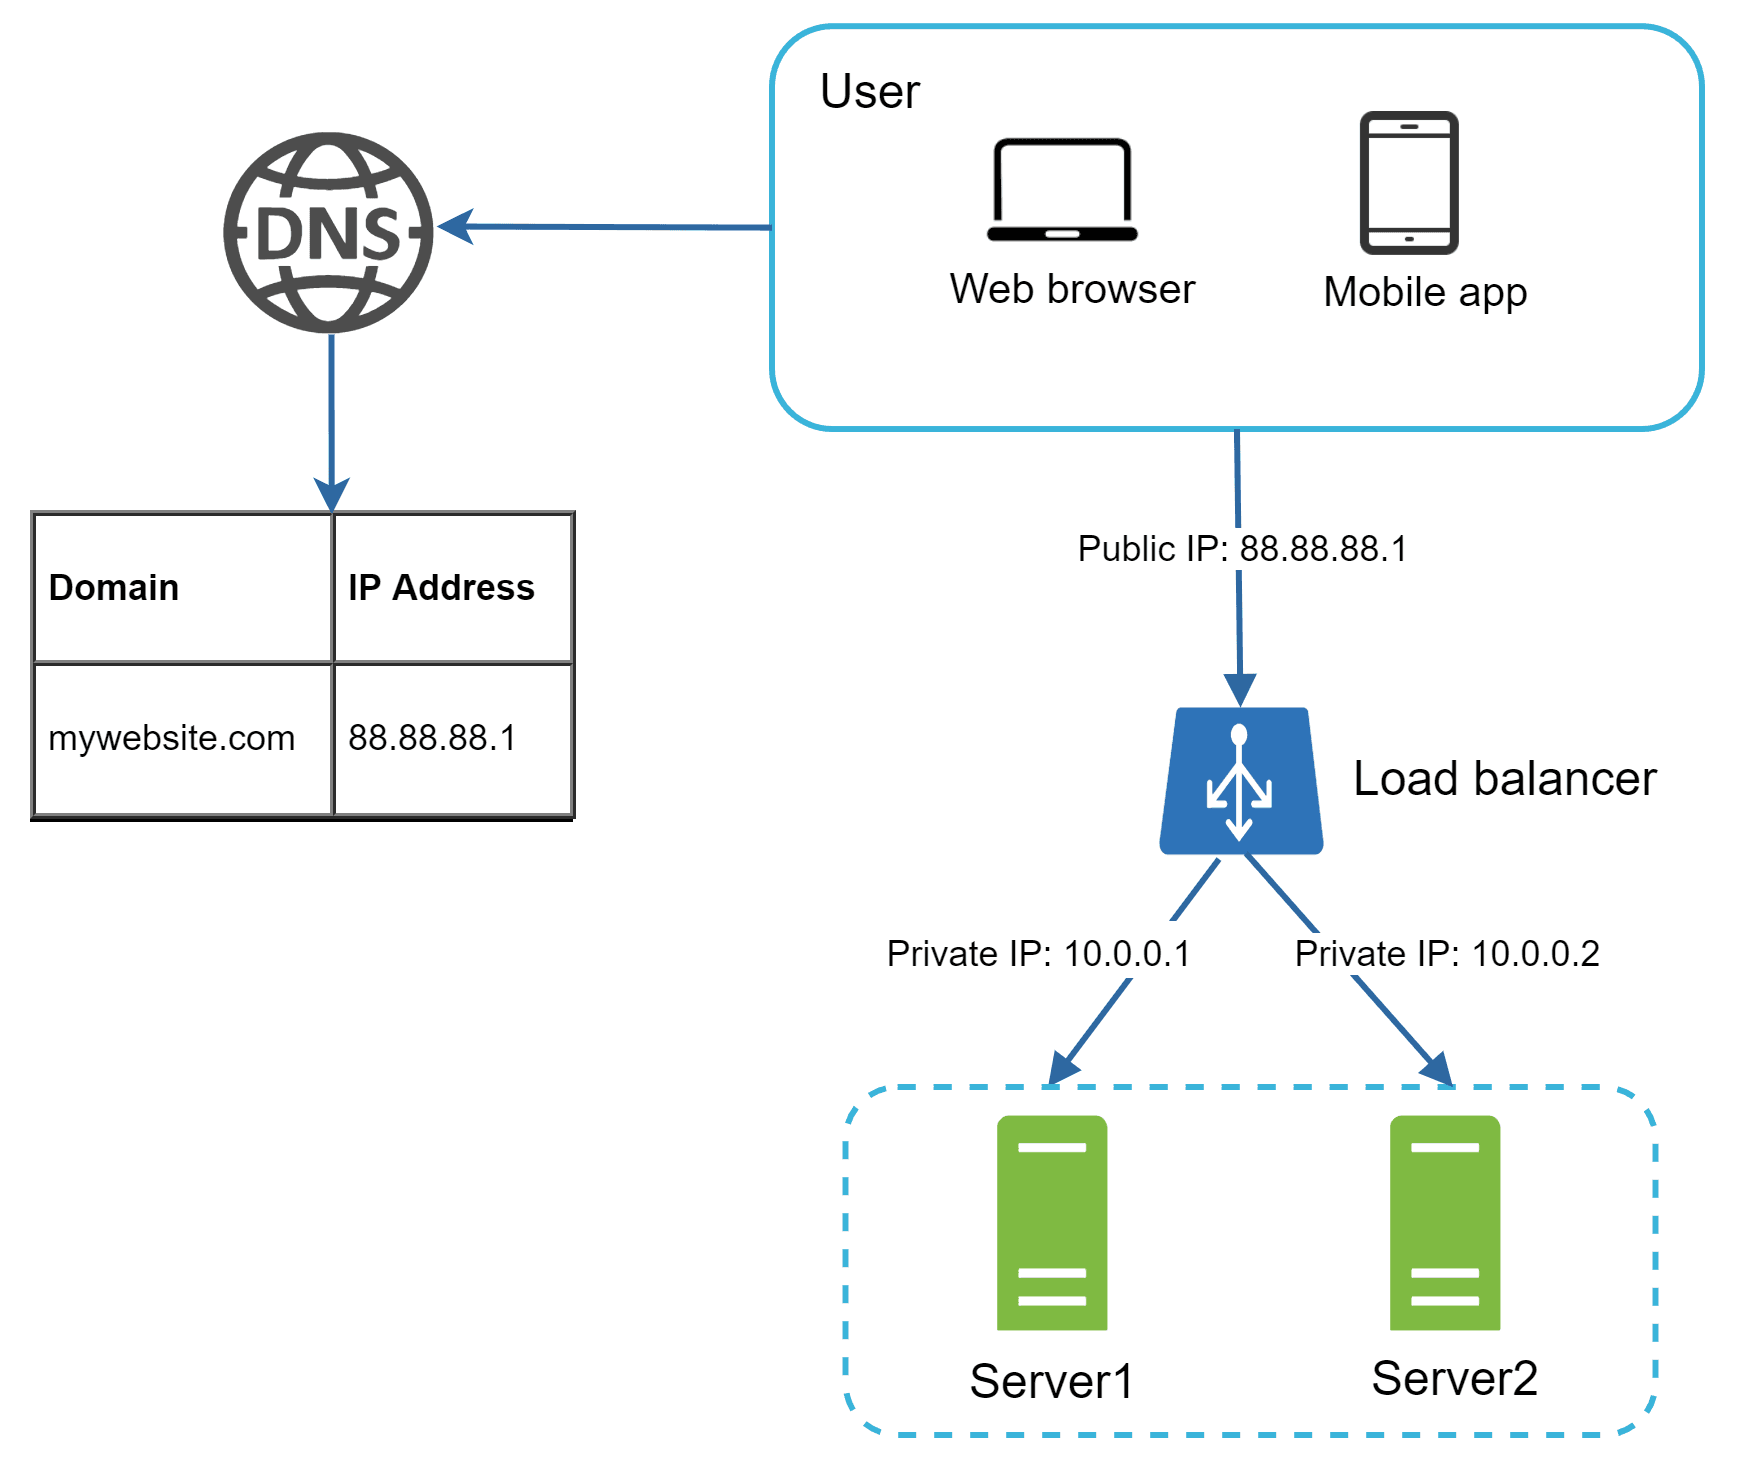
Now the users connect only to the Load Balancer (public IP) and not directly to the servers. It communicates with the web servers through private IPs within the same network, making the servers unreachable from outside.

A Load Balancer also prevents downtime if one server goes offline. If Server 1 fails, all requests are automatically redirected to Server 2, ensuring users don’t face interruptions.As traffic grows, we can keep adding more servers, and the load balancer will use its algorithm to distribute requests evenly among them. This makes the system both scalable and highly available.

Database Replication

With the Load Balancer in place, we solved the issue of servers going offline. But what if the same thing happens to our database? A single database failure would still bring the whole system down, which we need to avoid.

To keep the database safe, we can use Database Replication, where databases follow a master–slave relationship. The Master DB holds the original data and handles all write operations (insert, update, delete), while the Slave DBs maintain copies of that data and serve read operations. Since most systems perform more reads than writes, the number of slave databases is usually greater than the number of masters.

Image represents a simplified web application architecture.  A user, accessing via a web browser or mobile app, initiates a request to . This domain name is resolved to an IP address via a DNS server. The request then reaches a load balancer, which distributes traffic across two web servers ( and ) labeled as the 'Web tier'.  These servers communicate with a database system ('Data tier') consisting of a master database () and a slave database ().  The web servers send write requests to the master database and read requests to either the master or slave database. The master database replicates data to the slave database, ensuring data consistency and redundancy.  The load balancer uses  as the internal endpoint for communication with the web servers.  The entire architecture is visually divided into three tiers: the user tier (user and their access methods), the web tier (load balancer and web servers), and the data tier (master and slave databases).  The arrows indicate the flow of requests and data between components, with labels like 'Write,' 'Read,' and 'Replicate' clarifying the type of interaction.

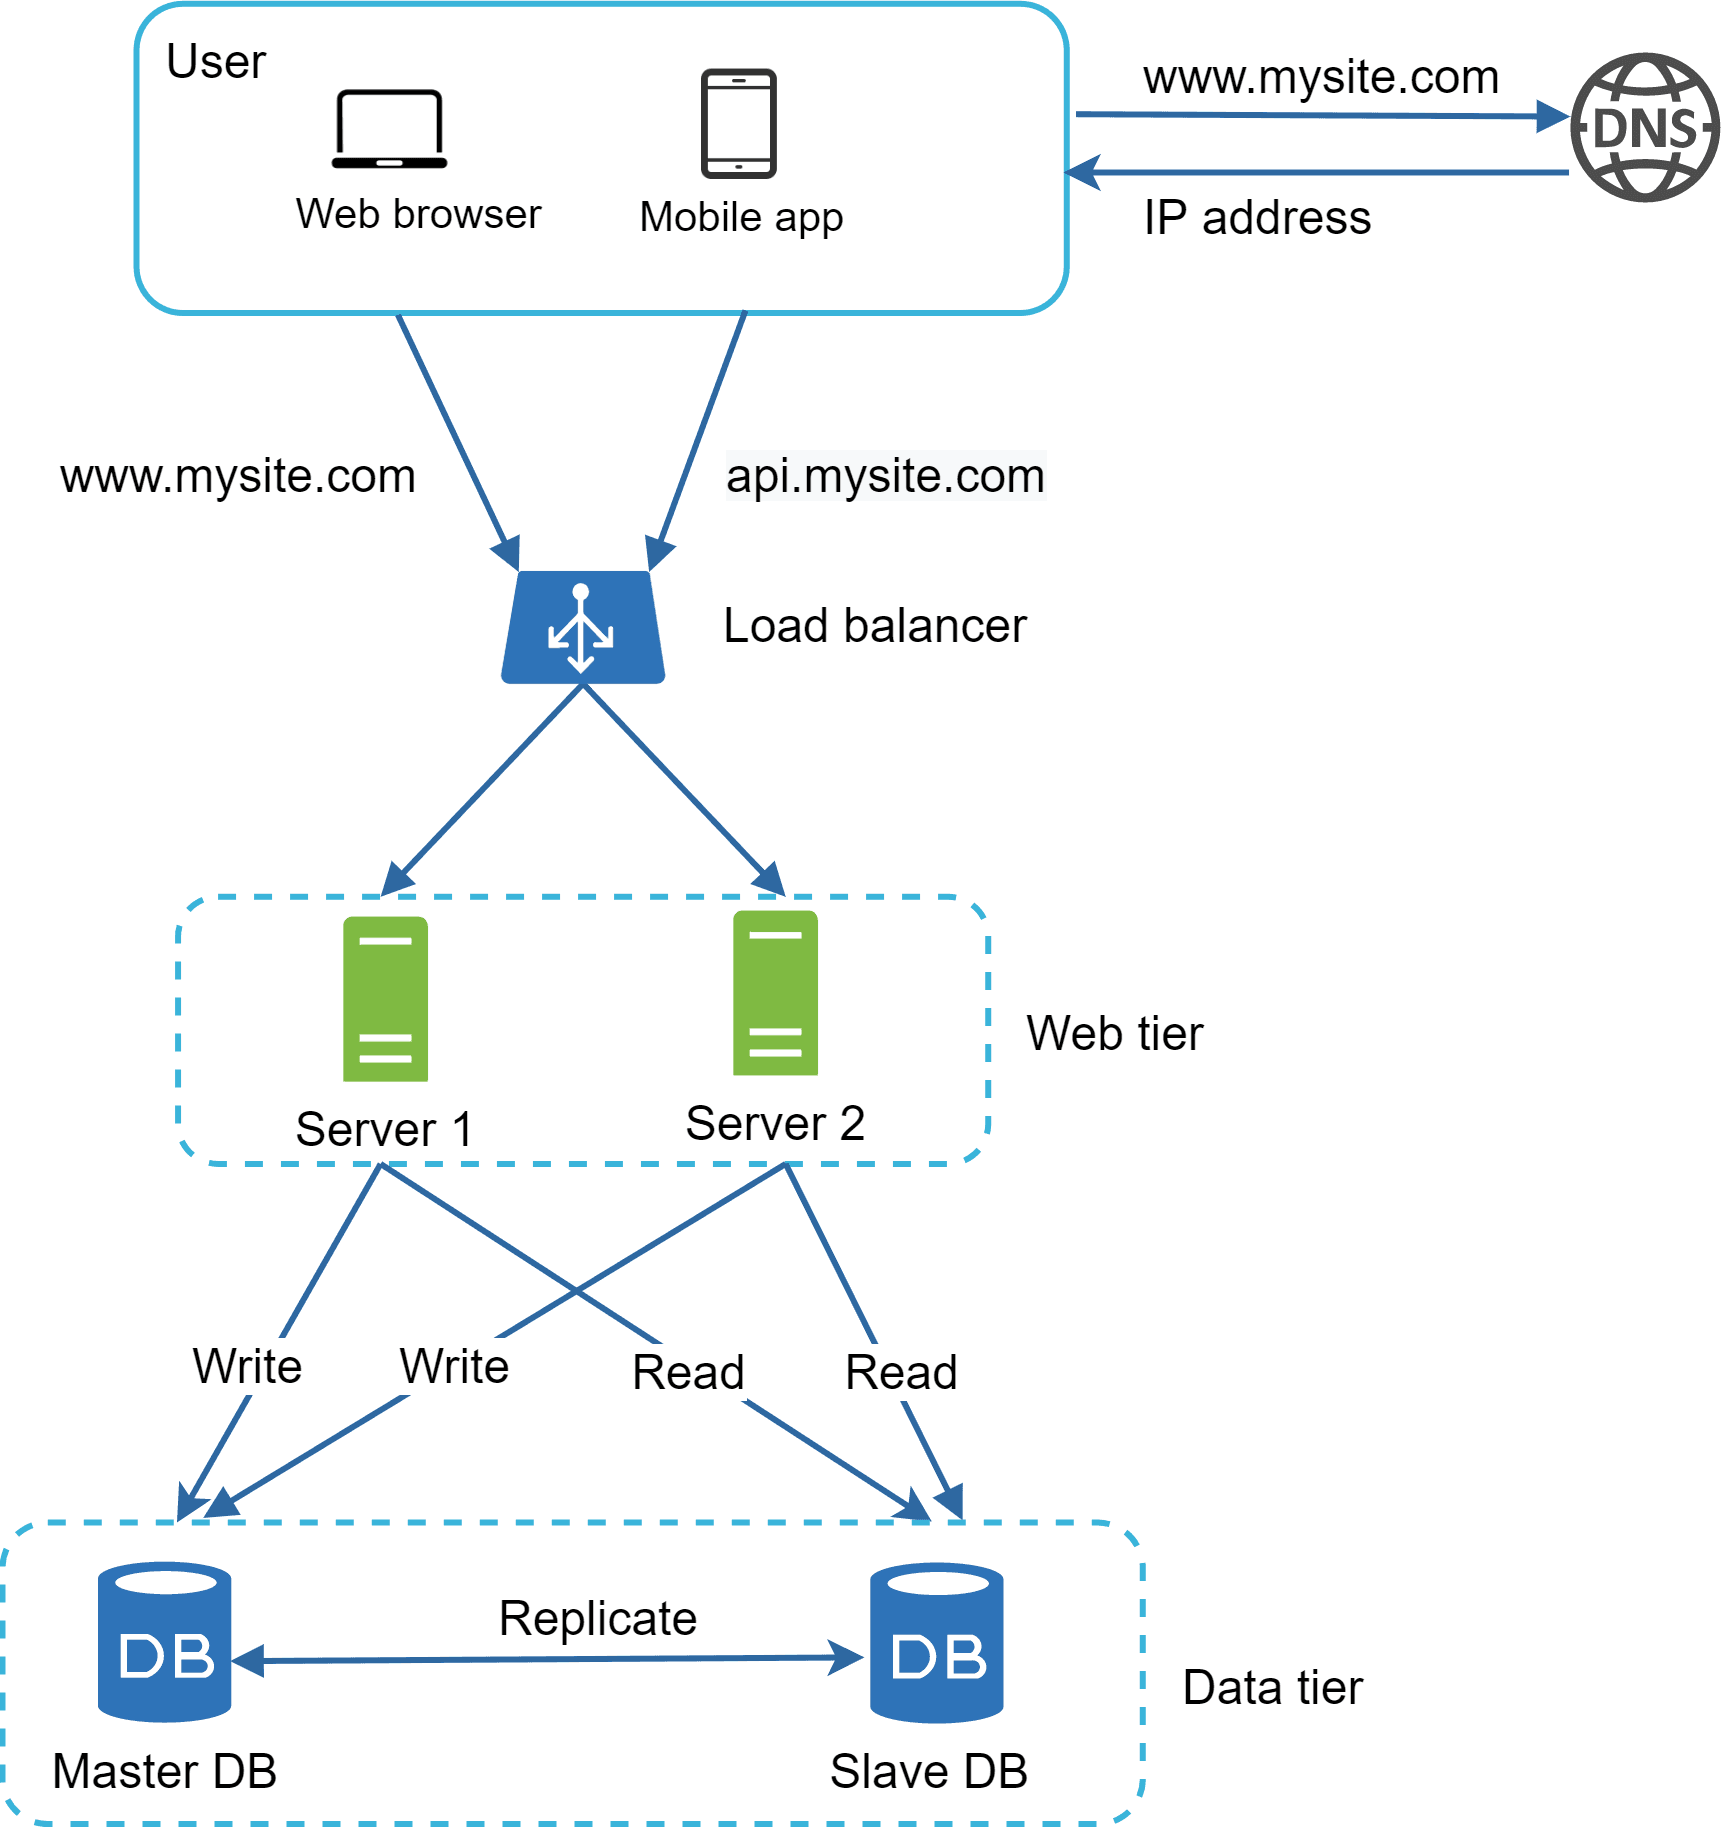
As we discussed earlier, the Load Balancer improves system availability for servers, and replication does the same for databases. If a Slave DB goes offline, the reads can temporarily go to the master, and if the Master DB fails, one of the slaves can be promoted to master so the system continues to run without downtime.

Cache

By now we’ve achieved good availability, but the next challenge is improving response time. To do this, we add a caching layer on top of the database. A cache is a high-speed storage layer that keeps frequently accessed or recently used data so it can be served much faster than fetching it directly from the database, disk, or an external API.

Image represents a simplified system architecture illustrating data retrieval from a cache and database.  The diagram shows three main components: a green rectangular 'Web server,' a blue square labeled 'CACHE' representing a cache, and a blue cylindrical 'Database' component labeled 'DB.'  A green arrow connects the cache to the web server, labeled '1. If data exists in cache, read data from cache,' indicating data flows from the cache to the web server. A blue arrow connects the database to the cache, labeled '2.1 If data doesn't exist in cache,...,' showing data retrieval from the database to the cache when the data is not found in the cache. Another blue arrow connects the cache back to the web server, labeled '2.2 Return data to the web server,' indicating the data's return path to the web server after being fetched either from the cache or the database.  The overall flow depicts a common caching strategy where the web server first checks the cache; if the data is present, it's directly returned; otherwise, the database is queried, the data is retrieved, stored in the cache, and then returned to the web server.

When a request comes in, the web server first checks the cache. If the data is found, it’s returned immediately; if not, the server fetches it from the database, stores it in the cache, and then sends it to the client. This is called a read-through cache. Depending on the use case, different caching strategies can be applied, and we can store things like JSON responses, JS files, or other static content to speed up performance.

When to use caching ?

  • Frequent Reads – The same data is requested repeatedly, so caching avoids recomputing or re-fetching it.

  • Slow Data Source – The original source (like a database, disk, or external API) is slower than memory, so caching speeds things up.

  • High Latency – If accessing the main source takes noticeable time, caching reduces response times.

  • Performance Improvement – By serving data from cache, you reduce load on the server or database.

  • Cost Efficiency – If data queries or API calls are expensive, caching lowers usage and costs.

Content delivery network (CDN)

A CDN is a global network of servers that cache and deliver static content like images, CSS, JS, or videos. Instead of always fetching files from the origin server, users get them from the nearest CDN server, which makes websites load much faster. For example, a user in Delhi will get content quicker from a Mumbai CDN server than from one in the US.

Image represents a system architecture illustrating how a Content Delivery Network (CDN) serves images to users.  Two users, labeled 'User A' and 'User B,' are depicted as laptops.  Each user requests an image ('image.png') from the CDN, represented as a light-blue cloud with a lightning bolt symbolizing speed. Solid arrows indicate the requests (labeled '1. get image.png' and '5. get image.png') and responses ('4. return image.png' and '6. return image.png') between the users and the CDN.  If the CDN doesn't have the image, dashed arrows show a request ('2. if not in CDN, get image.png from server') to a green rectangular 'Server' component, which then sends the image to the CDN ('3. store image.png in CDN').  This ensures that subsequent requests for the same image from other users are served quickly from the CDN's cache, improving performance and reducing load on the server.

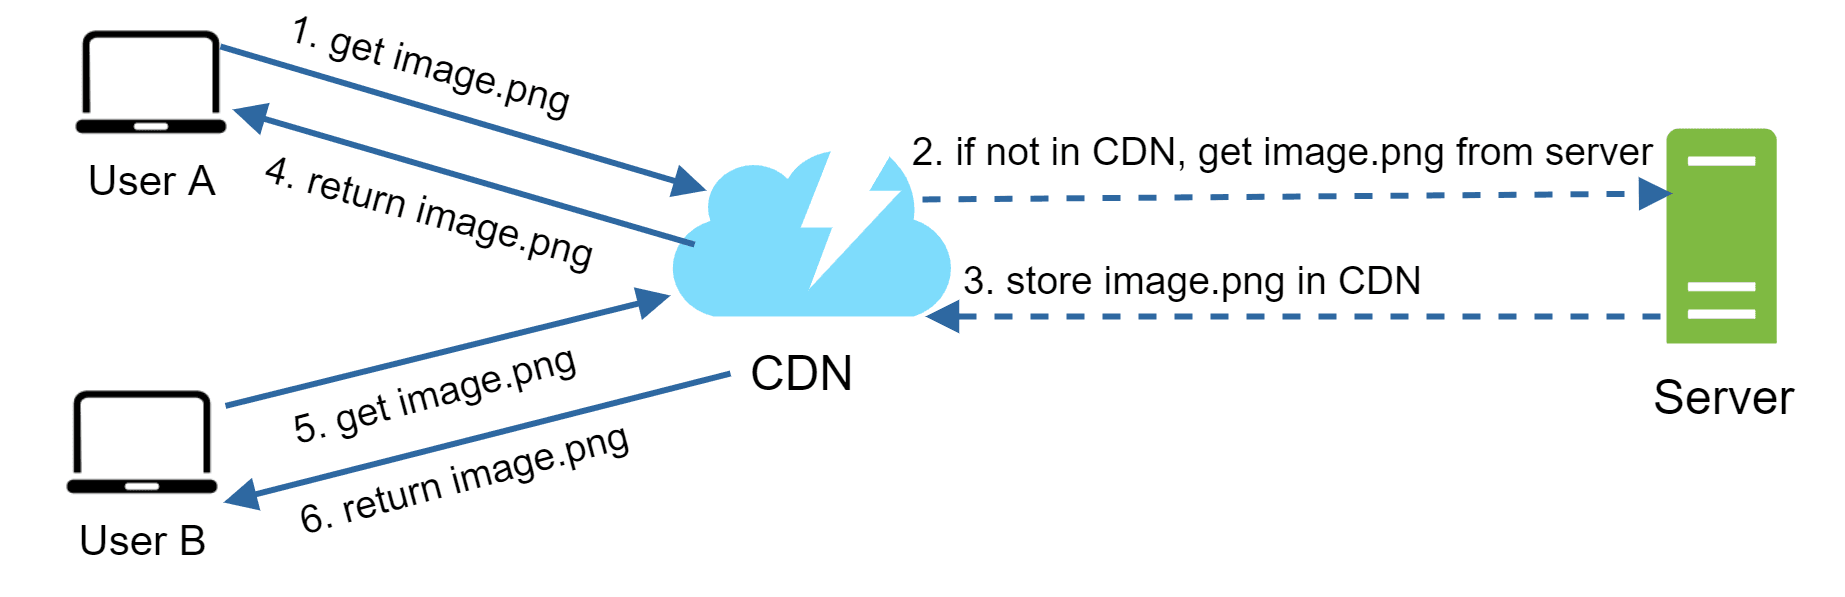
  • User Request – User A requests an image via a CDN URL (e.g., CloudFront or Akamai).

  • Cache Miss – If the CDN doesn’t have it, it fetches the file from the origin server/storage (e.g., Amazon S3).

  • Origin Response – The origin sends the file with a TTL (how long it should stay cached).

  • CDN Cache – The CDN stores the file and delivers it to User A.

  • Another Request – User B requests the same image.

  • Cache Hit – The CDN serves the image directly from its cache (until TTL expires).

Image represents a system architecture diagram illustrating a typical web application deployment.  The diagram starts with a user accessing the application via a web browser or mobile app, which then sends a request to a DNS server.  The DNS resolves the domain names (www.mysite.com and api.mysite.com) and directs the request to a load balancer. The load balancer distributes traffic across two web servers (Server1 and Server2) within a 'Web tier'. These servers communicate with a database system in a 'Data tier', consisting of a master database (Master DB) and a slave database (Slave DB) with replication occurring from the master to the slave.  Both web servers also connect to a separate cache (labeled 'CACHE') for improved performance.  The entire system is connected to a CDN (Content Delivery Network) for faster content delivery to users globally.  Solid lines represent primary data flow, while dashed lines indicate secondary or replicated data flow.  Green lines highlight the connection between the web servers and the cache.

Stateless Architecture

In a stateful architecture, the server remembers client data from one request to the next. For example, in an online banking system, the server keeps track of your session—like login details, account info, and transactions—across multiple steps. While in stateless architecture the HTTP request can be shared to any of the server and it will not maintain the cleint data.

By moving state data out of the web servers, we make auto-scaling much easier. Now, servers can be added or removed based on traffic load without worrying about losing session data, making the system more flexible and scalable.
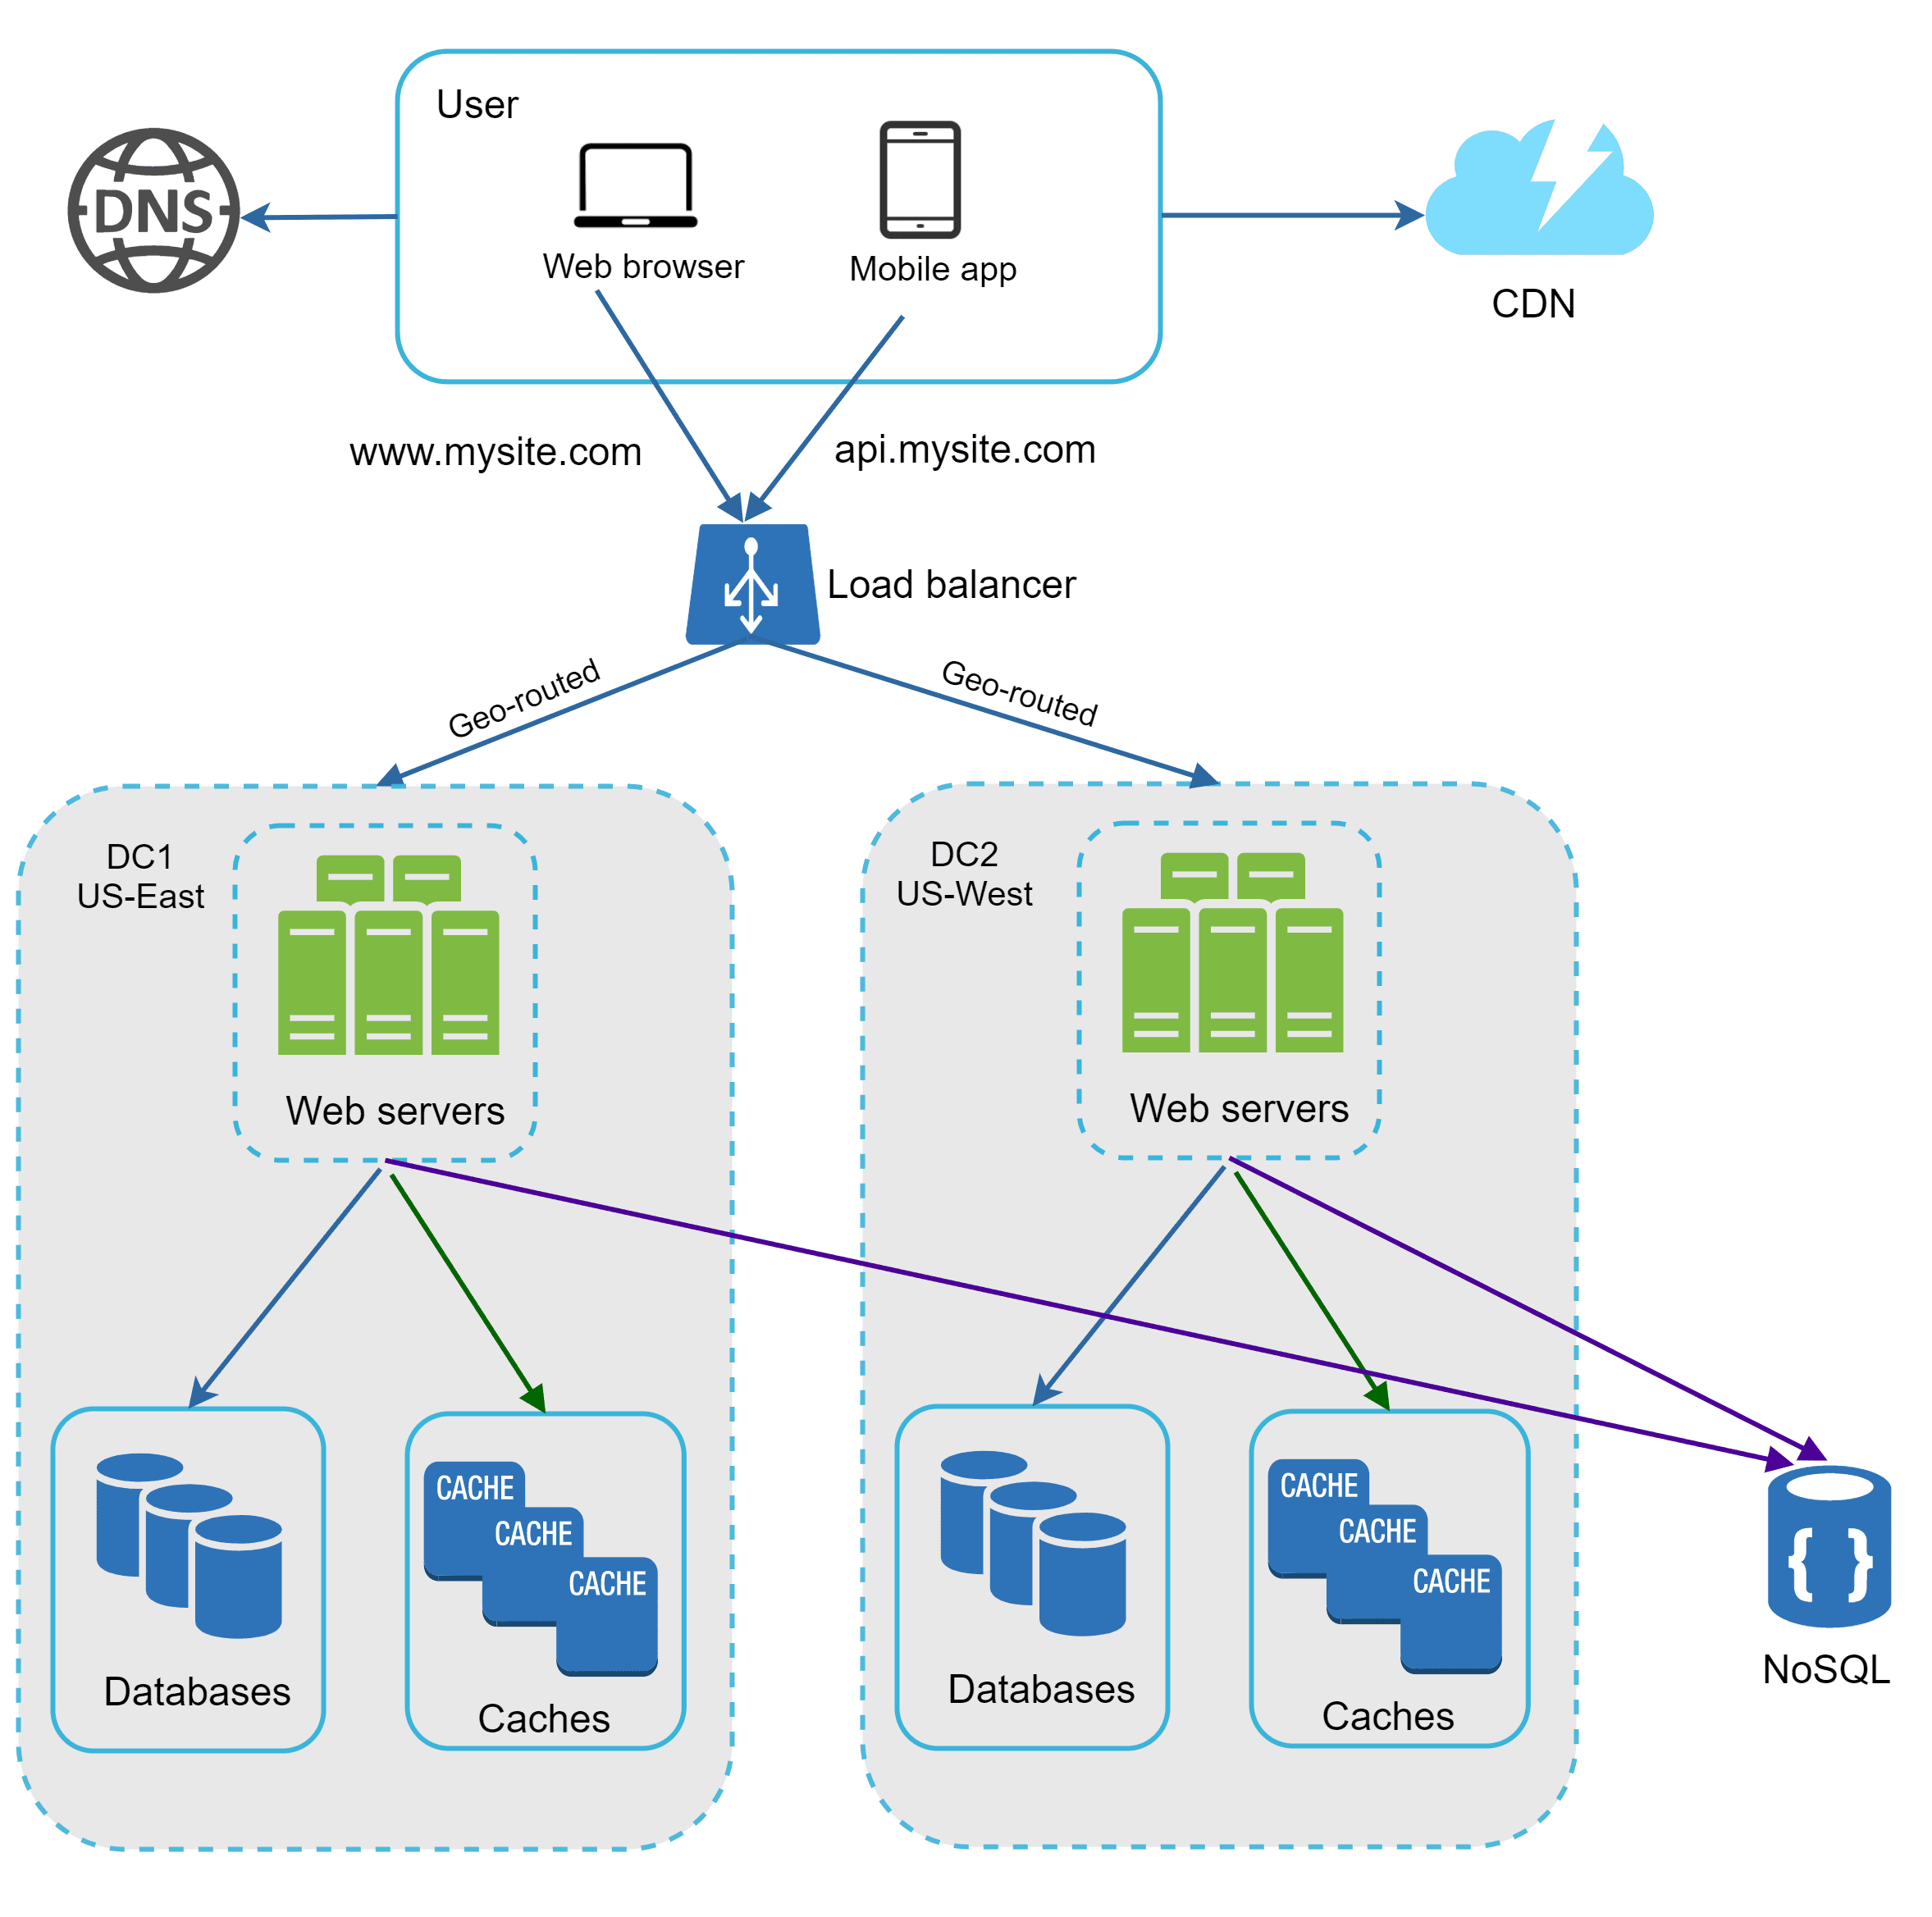
Image represents a system architecture diagram for a web application.  Users access the application via web browsers or mobile apps, initially resolving  (for web) or  (for mobile) through a DNS server.  These requests are then routed to a CDN (Content Delivery Network) for faster content delivery.  The requests subsequently reach a load balancer, distributing traffic across four application servers (Server1-Server4) which are auto-scaled (indicated by '① Auto scale').  These servers connect to a database system consisting of a master database and two slave databases, with replication occurring between the master and slaves.  Additionally, the servers interact with a cache for improved performance and a NoSQL database, likely for specific data storage needs.  Connections between the servers and databases are shown as dashed lines, suggesting asynchronous communication.  The green line indicates a connection from Server3 to the cache, while the purple line shows a connection from Server3 to the NoSQL database.  The blue lines represent the main flow of requests and data.

Data Centers

As the user base grows globally, a single server location is no longer enough. To reduce latency, we add multiple data centers around the world. Suppose a website has Data Center 1 in Mumbai and Data Center 2 in New York.

  • A user in Delhi is routed to the Mumbai data center → faster response.

  • A user in San Francisco is routed to the New York data center.

When a user request comes in, it flows through DNS, then to the nearest CDN, and finally reaches the Load Balancer, which uses geo-routing to direct it to the closest data center. Inside, the web servers work with caches and databases to serve the response. If one data center fails, traffic is automatically rerouted to a healthy one, while data synchronization ensures consistency across all centers.

Image represents a system architecture diagram for a website.  A user, accessing via web browser (www.mysite.com) or mobile app (api.mysite.com), initiates a request that first resolves through a DNS server.  The request then proceeds to a CDN (Content Delivery Network) for caching and faster delivery.  From the CDN, the request hits a load balancer, which distributes traffic across two geographically separate data centers (DC1: US-East and DC2: US-West) based on geo-routing. Each data center contains multiple web servers, which in turn access databases and caches for data retrieval.  The web servers are connected to their respective databases and caches.  Additionally, both data centers' web servers connect to a central NoSQL database via thick purple lines, suggesting a shared data layer or a specific data synchronization mechanism.  The connections between web servers and their respective caches are shown in green and blue, while the connections to the NoSQL database are shown in purple.  The load balancer uses geo-routing to direct requests to the closest data center, optimizing latency.

Message Queues

A Message Queue is a system that stores messages and lets services communicate asynchronously. It helps decouple producers and consumers, making applications more scalable and reliable, since messages can still be processed even if one side is temporarily unavailable. Producers publish messages to the queue, and consumers pick them up whenever they’re ready to process them.

Image represents a producer-consumer architecture using a message queue.  A rectangular box labeled 'Producer' is connected via a solid arrow labeled 'publish' to a hexagonal box representing a 'Message Queue'.  Inside the message queue are three envelope icons, symbolizing messages.  The message queue is connected to a rectangular box labeled 'Consumer' via two arrows. A solid arrow labeled 'consume' indicates the flow of messages from the queue to the consumer. A dashed arrow labeled 'subscribe' points from the consumer back to the message queue, illustrating the consumer's subscription to the queue for receiving messages.  Below the diagram, the text 'Viewer MessageQueue.svg 1.1.1' indicates the diagram's source and version.

A message queue is like a waiting line where tasks (messages) are stored until someone picks them up.Ex: When we place an order on an e-commerce platform, the inventory update and report generation don’t happen instantly but are handled in background queues.

Logs , Metrics , Automation

As our website is grown now and we need to invest in logging and metrics

  • Logging → Keeps a record of what’s happening in the system (errors, requests, events). Needed for debugging, audits, and finding issues fast.

  • Metrics → Numbers that show system health (CPU, memory, response time, traffic). Needed to measure performance and know when to scale or fix something.

  • Automation → Automatically handles deployments, scaling, monitoring, and recovery. Needed to reduce human error, speed up processes, and keep systems reliable.

Image represents a system architecture diagram for a web application.  A user, accessing via web browser (www.mysite.com) or mobile app (api.mysite.com), initiates a request that first goes through a DNS server.  The request then reaches a load balancer, distributing traffic to multiple web servers within a data center (DC1).  The web servers interact with databases and caches for data retrieval.  A green arrow shows the web servers using caches. A blue arrow shows the web servers using databases.  A purple arrow indicates that after processing, the web servers send messages to a message queue.  These messages are then processed by a set of workers, which subsequently write data to a NoSQL database.  The entire system is fronted by a CDN (Content Delivery Network) for faster content delivery.  Finally, a separate component labeled 'Tools' (2) at the bottom shows monitoring, logging, metrics, and automation functionalities, suggesting a robust operational monitoring and management system.

Database scaling

As the data grows bigger now , it’ll get overloaded and we need some ways to fix this issue. We can implement following approaches.

Vertical scaling

It means improving a single server’s capacity by adding more resources like CPU, RAM, or storage Example: Upgrading memory from 8 GB to 32 GB allows the server to handle more traffic.

Horizontal scaling

It means adding more servers instead of making one server stronger. For instance, you can deploy 5 servers and use a Load Balancer to spread the traffic among them.

Sharding

It is a way of splitting a large database into smaller pieces (called shards), where each shard holds a portion of the data.Example: Instead of one database storing data for all users, you split it so users A–M are stored in Shard 1, and users N–Z are stored in Shard 2.

Image represents a system architecture diagram for a web application.  A user, accessing via web browser (www.mysite.com) or mobile app (api.mysite.com), initiates a request that first resolves through a DNS server. The request then goes to a CDN (Content Delivery Network) before reaching a load balancer distributing traffic across multiple web servers within a data center (DC1).  These web servers interact with a sharded database (labeled 'Databases,' numbered 1), a cache layer for improved performance, and a message queue.  Data is also written to a NoSQL database (labeled 'NoSQL,' numbered 2).  A separate set of workers processes tasks from the message queue.  Finally, a 'Tools' section at the bottom shows components for logging, metrics, monitoring, and automation, suggesting a robust system monitoring and management infrastructure.  The connections between components show the flow of requests and data, with green lines indicating data flow to the cache, purple lines indicating data flow to the NoSQL database, and blue lines representing the main request flow.

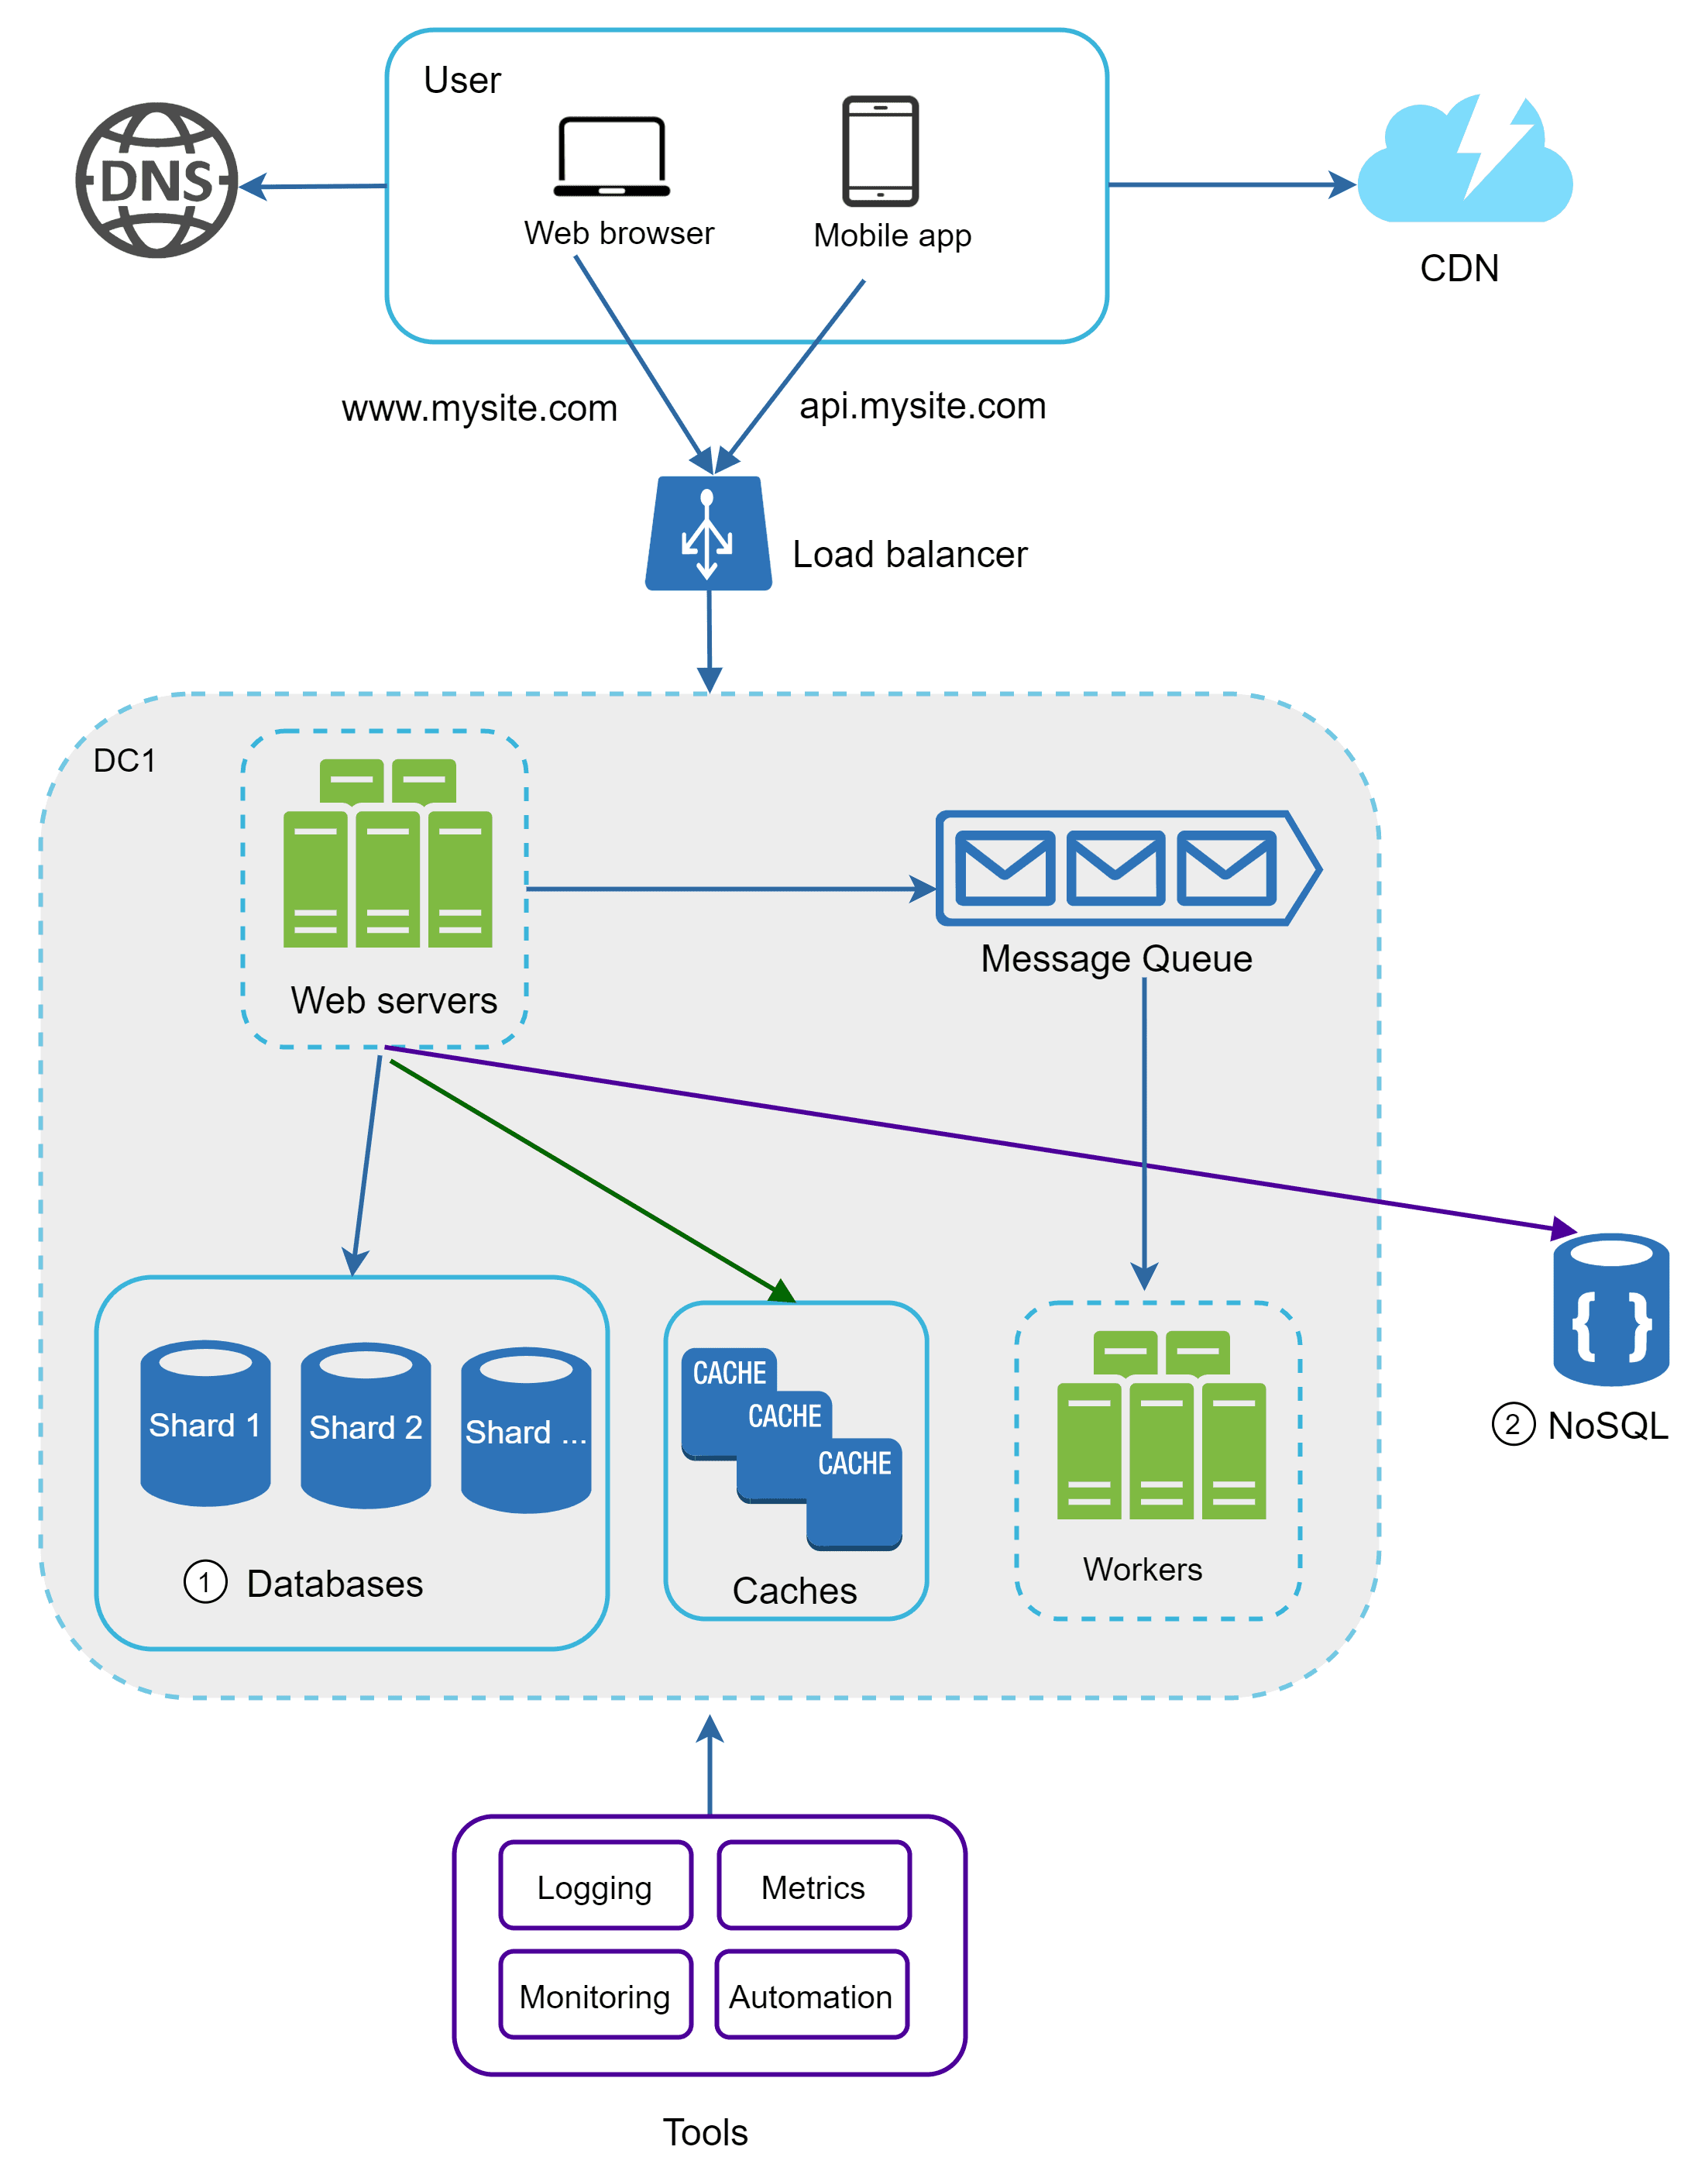
After implementing these steps, our architecture can gracefully handle millions of users and beyond. But system design is never truly “finished” , it’s an iterative process where we continuously refine, decouple layers, add more caching strategies, and adjust components as the system grows.

Thanks for reading! 🎉 A lot of these learnings are inspired by the amazing content from ByteByteGo.If you’re serious about system design, I highly recommend checking out their course.

0
Subscribe to my newsletter

Read articles from Raghav Shukla directly inside your inbox. Subscribe to the newsletter, and don't miss out.

Written by

Raghav  Shukla
Raghav Shukla

Passionate software developer crafting elegant solutions through code and innovation.