Increase Infrastructure Visibility Using DataDog
 Jeremy Hall 🖥️ ⌨️🖱️
Monitoring All the Things
As an engineer with over a decade and a half in the enterprise space, I have come to learn some really important things when talking about monitoring, and how your monitoring data can be the hero that saves the company money when you encounter issues with infrastructure, or even bugs on your application(s).
The data your infrastructure & applications generate all day and night is not only useful, but it is telling you how it is doing day to day. It shares what is wrong with its parts, it tells you what it needs changed, it shares so much - but those who can manipulate the data and really understand it will be able to get really useful insights out of that firehose of metrics. Data is king and if your company has bad monitoring becuase they do not want to pay for it, or they only have basic monitoring for disk space, CPU limits, etc. I would advise you to begin looking for somewhere else to work. I'm not even kidding. If that is your personal policy, well, shame on you. You're robbing yourself of critical information that could make your operations and development far better.
I want to share why this is such a huge issue, how it can be resolved, and then dive into how you should be viewing your data to make those important discoveries that you can then turn into monitors and alarms to alert you early when a problem is coming your way.
Think about earthquake early alert systems or tornado alerting systems. They exist to ensure most if not all people can stay safe in the midst of a large and dangerous weather pattern. They may not all work perfectly on the first try, but with time and effort, those systems can alert millions of people and save hundreds of lives. Sure, most monitoring is not going to save someone from dying, but it could save you from spending time diagnosing an issue all night instead of playing basketball with your kids after work.
Lessons Learned: Free for All
Infrastructure and application monitoring data can also be preventative in nature, not only reactive. The most advanced shops out there look for patterns, accuracy issues, better alternative collection methods or even another dataset that is more helpful than standardized metrics/alerts/rules. If you have not read it yet, I highly suggest you read the online free copy of Site Reliability Engineering Written by SRE Team Members at Google.
The Foundations chapter (Click Me) covers so many things Google had to learn to get right, and not only is that book free and open sourced to all, it has all kinds of methods Google had to learn from trial and error in their real production environments and shared it with us. When I managed a team a while back, I made reading a chapter of this book mandatory and Friday afternoon we would go over that chapter and I wanted to hear all the things my engineers learned so we could openly talk about how we could apply those invaluable lessons at the company I was at.
ddagent installed
Let's get down to business. That is why you are here after all. About 3 months ago I got really mad at some issues I was having with my lab here at my home office. I run typical things like Plex, a torrent box (for Linux ISOs only), and a handful of containers that I find extremely useful. I realized one night when I was trying to understand what the heck was going on with one of my servers that I had no monitoring setup, and if I had that historical data to know and understand what was going on, I likely could have scripted the problem away.
I quickly went to my "go to" monitoring service - DataDog, and signed up for a free account so I could install the agent in my lab. I added a few integrations that would help me monitor specific applications without extra effort on my part, and tossed the installer out over the network to get all my boxes online.
The initial installation of ddagent takes 5 minutes - they have scripts to make your life ever the more simple if you can't be bothered to script it yourself.
Waiting Period
Once the installation and configuration was done, I waited.
The best thing you can do when you install monitoring on a new environment is to collect data before you start running around fixing monitors and canceling or even ignoring alerts. Why? Simple!
If you start sending out false positive alarms to people - what is their first thought? "Great, another page on my day off... let's see what it is... Oh, this is a false alarm. Back to my day off!"
I've been there and done that - but it is the worst thing you can do as an engineer. To correctly setup thresholds you need to wait. Let the metrics come in for a week and then you can begin to look for patterns against the standard deviation of a metric, which will cause far fewer false alarms becuase it knows on the weekend you have less traffic overall and it can adjust the alert based on historical data. If you want people to take alerts seriously, you need to ensure you are not sending bad alerting data to them and that you can validate the issue before paging someone.
An example of a poor alert is for CPU bursting: you have new servers and you put CPU limits of 85% for the monitor - but those servers are running a NoSQL DB and CPU is very spiky - it will go above your 85% monitor limit, but then 20 seconds later it is back to 10%. You need to take an average for multiple minutes in this case to validate the issue is ongoing and is a problem. You can see where I am heading with this.
Then, when your pager goes off you can know with absolute certainty something is on fire.
All the Things
One thing I love about DataDog is the built up default dashboards. They provide an excellent template to get all the basics for a service like Kafka into a clear and legible board you can display on your NOC monitors. Then you can take those basic boards and copy JSON from other boards you setup as well and merge them together. The syntax is so easy and becuase you can write them in JSON, you can back them up and version them in a repository. You can know how and who changed the board last and then go ask them why they never made sure all the metrics showed up, or why they changed the default view to 1 week instead of the last 4 hours.
Example of DataDog JSON of a Section of My Dashboard
{
    "viz": "timeseries",
    "requests": [
        {
            "style": {
                "palette": "semantic",
                "type": "solid",
                "width": "thick"
            },
            "type": "line",
            "formulas": [
                {
                    "formula": "query1"
                }
            ],
            "queries": [
                {
                    "is_normalized_cpu": false,
                    "data_source": "process",
                    "name": "query1",
                    "metric": "process.stat.cpu.total_pct",
                    "query_filter": "Plex",
                    "limit": 50
                }
            ],
            "response_format": "timeseries"
        },
        {
            "style": {
                "palette": "dog_classic",
                "type": "solid",
                "width": "normal"
            },
            "type": "line",
            "formulas": [
                {
                    "alias": "Stolen CPU Clock Cycles",
                    "style": {
                        "palette_index": 7,
                        "palette": "warm"
                    },
                    "formula": "query0"
                },
                {
                    "alias": "System CPU Load %",
                    "style": {
                        "palette_index": 7,
                        "palette": "dd20"
                    },
                    "formula": "query1"
                },
                {
                    "alias": "CPU Interrupt",
                    "style": {
                        "palette_index": 7,
                        "palette": "purple"
                    },
                    "formula": "query2"
                },
                {
                    "alias": "DPC Total %",
                    "style": {
                        "palette_index": 4,
                        "palette": "orange"
                    },
                    "formula": "query3"
                }
            ],
            "response_format": "timeseries",
            "queries": [
                {
                    "query": "avg:system.cpu.stolen{host:PLEXER}",
                    "data_source": "metrics",
                    "name": "query0"
                },
                {
                    "query": "avg:system.cpu.system{host:PLEXER}",
                    "data_source": "metrics",
                    "name": "query1"
                },
                {
                    "query": "avg:system.core.interrupt.total{host:PLEXER}",
                    "data_source": "metrics",
                    "name": "query2"
                },
                {
                    "query": "avg:system.core.dpc.total{host:PLEXER",
                    "data_source": "metrics",
                    "name": "query3"
                },
                {
                    "query": "avg:system.core.user.total{host:PLEXER}",
                    "data_source": "metrics",
                    "name": "query4"
                }
            ]
        },
        {
            "style": {
                "palette": "semantic",
                "type": "solid",
                "width": "normal"
            },
            "response_format": "timeseries",
            "queries": [
                {
                    "query": "avg:system.cpu.user{*}",
                    "data_source": "metrics",
                    "name": "query0"
                }
            ]
        },
        {
            "style": {
                "palette": "dog_classic",
                "type": "solid",
                "width": "normal"
            },
            "type": "line",
            "formulas": [
                {
                    "style": {
                        "palette": "grey"
                    },
                    "formula": "query0"
                },
                {
                    "style": {
                        "palette": "red"
                    },
                    "formula": "query1"
                }
            ],
            "queries": [
                {
                    "is_normalized_cpu": true,
                    "data_source": "process",
                    "name": "query0",
                    "metric": "process.stat.cpu.user_pct",
                    "query_filter": "command:qbittorrent",
                    "limit": 10
                },
                {
                    "is_normalized_cpu": true,
                    "data_source": "process",
                    "name": "query1",
                    "metric": "process.stat.cpu.total_pct",
                    "query_filter": "command:qbittorrent",
                    "limit": 10
                }
            ],
            "response_format": "timeseries"
        }
    ],
    "yaxis": {
        "include_zero": false
    },
    "markers": []
}
I personally believe that dashboards are used by managers as nice shiny things that "show their team's work" to all who view it. However, that is not the right way to leverage dashboards, and also why people do not pay attention to them. Any dashboard that is worth the time and effort to make should be something you can glance at and immediately know if anything is going south or is already has blown up.
Show Me Yours, I'll Show You Mine
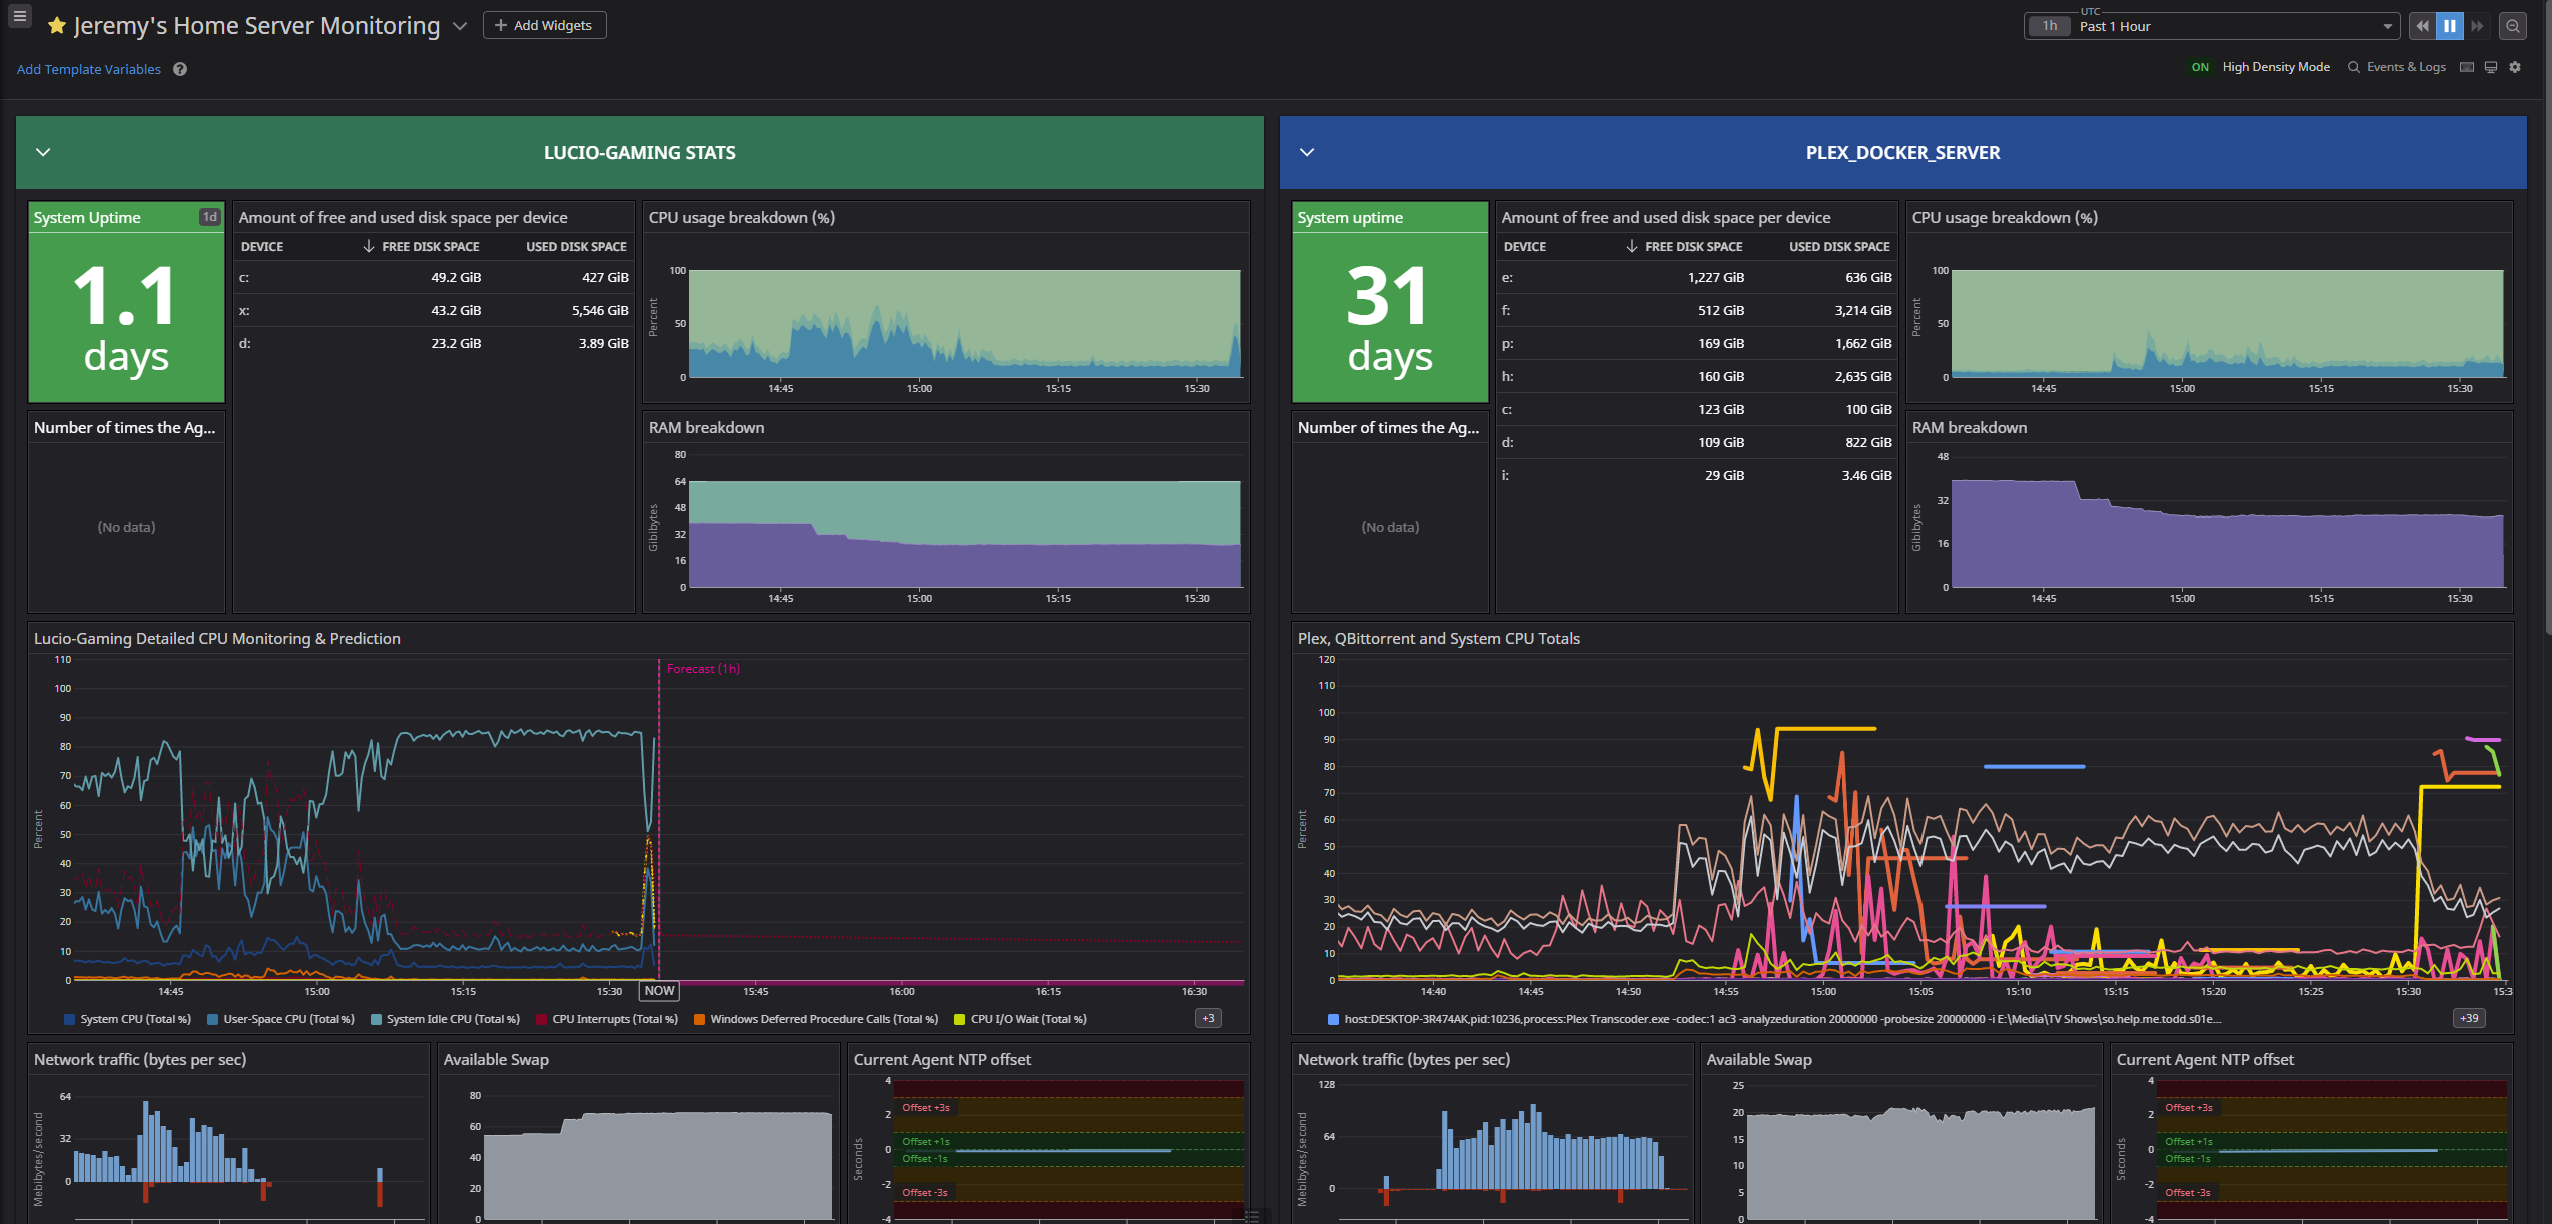
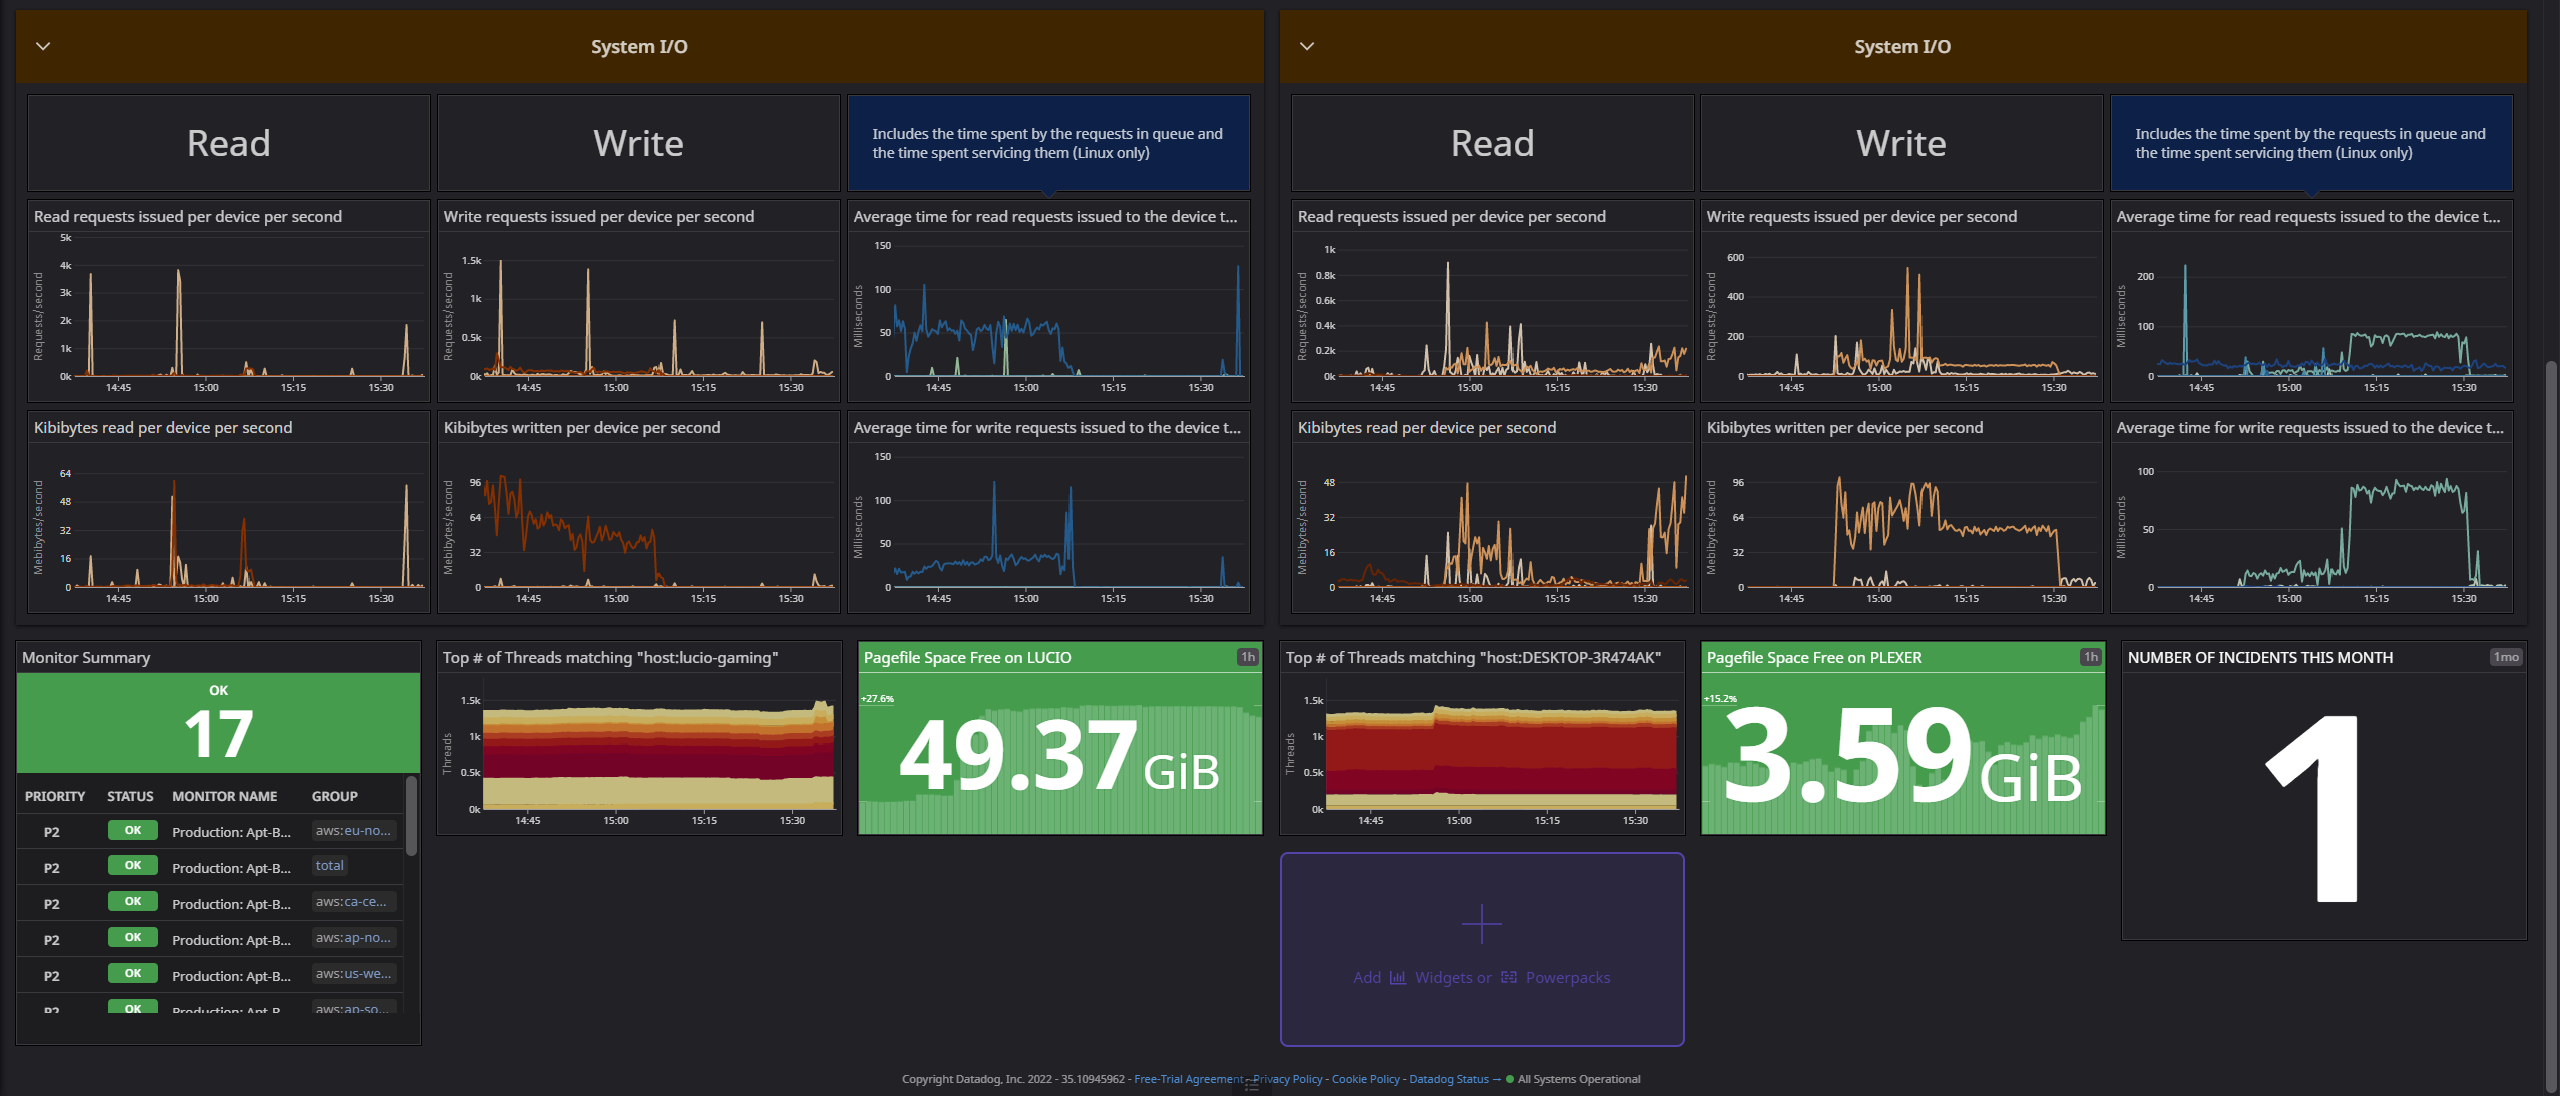
So here is my main, every day Dash that I have on my tab-open list, and I stare at it through the day as I work, and I can see it via the DataDog app on my phone. It is very helpful when we are watching an episode on my Plex server that is encoded in 10-bit color, Dolby Vision, and is in 4k and it has issues with buffering. Is it the server or the client? How can I tell? Well, below you can see my server board - the client metrics I have not added but I am about to. I use Tautulliand boy, it's great for getting metrics out of other devices and the mobile app is a joy to use.
Anyway, check this out. Oh, it's in two screenshots so you can see the top and bottom clearly.


Wrapping Up
So now we've talked about metrics, alerting, dashboards. What is next?
Next week we will be taking apart DataDog and the setup I use. What integrations do I use, how is my config setup on each machine? Do I ever get alerts?
I will cover all this and more next week - so be ready for a longer post than this week. Again, I want to really share the Google SRE books - they have 3 now and all are openly available on the site Google hosts, or you can order them. I suggest having both becuase the physical copy is all marked up, has post-it notes in it, I mean it's used and abused. The virtual copy is cool becuase they have an "Updates" section (this link) and you can see the little things they have changed since the last major release.
The books are (in order):
- Site Reliability Engineering
- This book covers metrics, systems to collect data in fault tolerant ways and how Google failed big time when they tried some very cutting edge things that are now normal and seen all over. It's written by SRE team members at Google and its my favorite book. Hands down. I warned you. You will get sucked in and obsess over this material if you love working as an architect, syseng, devops eng, SRE, or even someone in a NOC. Just read it. You will learn so much from Google's failures, and it will help you get work! Also, it's free so if you do not read it, shame on you.
- If you've read it before, and only want to see what has been updated: click here!
- The Site Reliability Engineering Workbook
- This is a part two love letter to those who love this work as I do. It talks about some things like being on call and how to really do that the right way, or pagers, how to do that so people pay attention to them. It is way shorter, but it talks about things you need to know. This is a must read. It is also free and shame on you if you do not take free knowledge.
- Building Secure & Reliable Systems
- This book is one I am reading and think of it as a part 2 to the first SRE Google book. It brings more things into the picture we are faced with today like security and how to really build secure systems that are automatable and repeatable when you need to scale out fast. This book is 600 pages so this is another recommended buy the physical book once you are hooked on the online PDF, or you can put the PDF copy on a Kindle!
Subscribe to my newsletter
Read articles from Jeremy Hall 🖥️ ⌨️🖱️ directly inside your inbox. Subscribe to the newsletter, and don't miss out.
Written by

Jeremy Hall 🖥️ ⌨️🖱️
Jeremy Hall 🖥️ ⌨️🖱️
I built my first pc when I was six, and have been working on them ever since. I began a repair and consulting business at age 12, and hired my mother to drive me to each site. When I completed high school I immediately had a constant position in Los Angeles that I used to catapult my career and see all the different datacenters, network types, Linux config, you name it. I have over 20 years of experience in engineering and enterprise operations, devops, and site reliability engineering. Some highlights of the places I've worked are MySpace, Internet Brands, Toyota NA, Toyota Connected, and I am currently at AWS.