FASTQ Files: Everywhere You Look in Bioinformatics
 Lucas Taniguti
I dare say that every bioinformatician working with genomics has encountered FASTQ files. Usually, after ordering DNA sequencing, we receive these files filled with tons of reads. But what exactly are these files? Where do they come from? And most importantly, what we can do with them? These are the questions I aim to elucidate in this article.
What they are?
The FASTQ format is a variation of the standard fasta format. Both are plain text and can hold sequence data, but FASTQ also holds additional quality information. Each entry in a file consists of four lines:
A sequence identifier, which begins with the '@' character.
The sequence itself.
A line with the '+' character.
A string of characters that represent the quality scores for each position in the sequence.
The quality scores are encoded using ASCII characters to compactly represent numerical values. This encoding has varied slightly between different platforms and periods. You can find a table describing the quality score each ASCII character represents in the table from this Wikipedia page, in the "encoding" section.
Here is an example of FASTQ record, which originated from the sequencing of SARS-CoV-2 through ONT Nanopore.
@06491f56-754b-4803-9f7a-124efd698d90
GTGTGCTTGGTTCGATTTGCATGGAAGAATTTGGGTGTTTGGCTTACAGAAACCTAGAAGGCACCGTATCGTTTTCGCATTTATCGTGAAACGCTTTCGCGTTTCGTGCGCCGACTTCACCACGGAGTCTCCAAAGCCACGTACGAGCACGTCGCGAACCTGTAAAACAGGCAAACTGAGTTGGACGTGTGTTTTCTCGTTGAAACCAGGGACAAGGCTCTCCATCTTACCTTTCGGTCACACCCGGACGAAACCTAGATGTGCTGATGATCGGCTGCAACACGGACGAAACCGTAAGCAGCCTGCAGAAGATGAGCGAGTTACTCGTGTCCCTGTCAACGACAGTAATTAGTTATTAATTATACTGCGTGGGTGTACTAAGCATGGCCAGTGACAGCCACACAGTTTTAAGTTCTGATTGAACAGATCTGCAGAGATCC
+
#%#&$##(#&0''(##'*$$&0*-'&$#&'+1,0+(570/'''$$%%$$-1*8(*5'0&0141:8464CB>CFKF=?JCDB73A@;;?:J@?:12487.-+.59-):.(&''-)-172$$0,8,/(40=AD?6843C:7?:87:311;@>3B=10835C0559;>C?504<<6828+-%*2=489=>9:C>BJJFE<3/?.-*40:5/8C:4;45727=<AD>?CE>=<J;9AB@.*=1+-**>A5:>4((2ADB827.6)/++.85A::A137A145'*6798;=:51+&989=BB,627B???9.06,IB9,,,1$$(66314;7D5?B=;;<B;,/>HF-%4<5566,-,=<=C@ABBA+&9=94/3$&(4&'-//01%&#$%'*&$&7('/*%%%'*))'$),+)%&$(,%"%"*%##'<45EE:4#'/&*88>?'
It's important to note that FASTQ files can be found in three formats. When in the Illumina context they can be single or paired-end. The single end will always have only one FASTQ file per collection of reads. It's common to have more than one just because they produce one file per lane in Flowcell.
The paired end usually are delivered as two files, the R1 and R2. They represent the nucleotide content of both ends of your DNA fragments. So, for each sequence in one of the collections you will have its pair in the other file. Unfortunately, some tools require you to work with your FASTQ pairs in a format called interleaved. In this format, both pairs are in the same file. Check this thread for more details.
Note that in paired-end sequencing, it's important for your DNA fragments to be larger than the total length of the two reads combined. Otherwise, you run the risk of the two reads 'overlapping' in the middle and essentially sequencing the same part of the fragment twice. This duplication can complicate downstream analyses. Furthermore, if one read completely covers the fragment and reaches into the region where the adapter was ligated, it might sequence part of the adapter. This adapter contamination is an artifact that can usually be spotted when visualizing the alignment. If you're interested, I can delve deeper into these issues in another post!
A smart use of this artifact can be found in the software tool Fraguracy (https://github.com/brentp/fraguracy). This program exploits the overlap in paired-end reads to estimate the true error rate of sequencing. By comparing the 'duplicate' sequences from the overlapping regions, Fraguracy identifies discrepancies, providing a unique insight into potential sequencing errors.
Where do they come from?
It was developed at the Wellcome Trust Sanger Institute to bundle a FASTA formatted sequence and its quality data - explained in our previous post. This institute was one of the leading contributors to the Human Genome Project. The project ran officially from 1990 to 2003.
Nowadays, FASTQ files are generated through the process of interpreting the raw signals captured during DNA sequencing. To make it more concrete:
For Illumina sequencers, the machine stores one BCL file for each cycle of each tile of each lane in its flow cell. As you can imagine, it's not easy to work with these files. They are binary and not easily human-readable, but they are the true raw data of Illumina sequencing. The conversion from BCL to FASTQ is usually done using the software bcl2fastq, provided by Illumina.
Broad Institute also has its software, called IlluminaBasecallsToSam, that converts BCLs to unmapped BAMs.
BCLs are often discarded after conversion to FASTQ to save storage space.
For Nanopore sequencers, the machine stores pod5 files (previously FAST5) with the raw electrical signal produced when the DNA molecules are passing through the pore. This signal is then processed to predict which sequence of nucleotides was passing. The output file is our beloved FASTQ.
Just for your curiosity: the read accuracy is often improved by simply using a better model during the base-calling process. This has been demonstrated with significant improvements in newer versions of Guppy. It's already kind of outdated, but check these twitter posts:
There are many sequencing technologies available, such as PacBio and IonTorrent, but these are not part of my daily work so would be more time-consuming for me to write about them.
What we can do with them?
Given that FASTQ files have become the de facto standard for storing DNA sequencing reads, there's a wealth of analysis possibilities at our fingertips. In fact, it's safe to say that nearly every journey in genomics or any project involving DNA sequencing begins with these vital bioinformatics files. They serve as the essential first step in unlocking the wealth of information hidden within our DNA.
Quality control of the sequencing
The first thing we usually do when start working with sequencing data is to assess its quality. In this topic I'll list some of the tools:
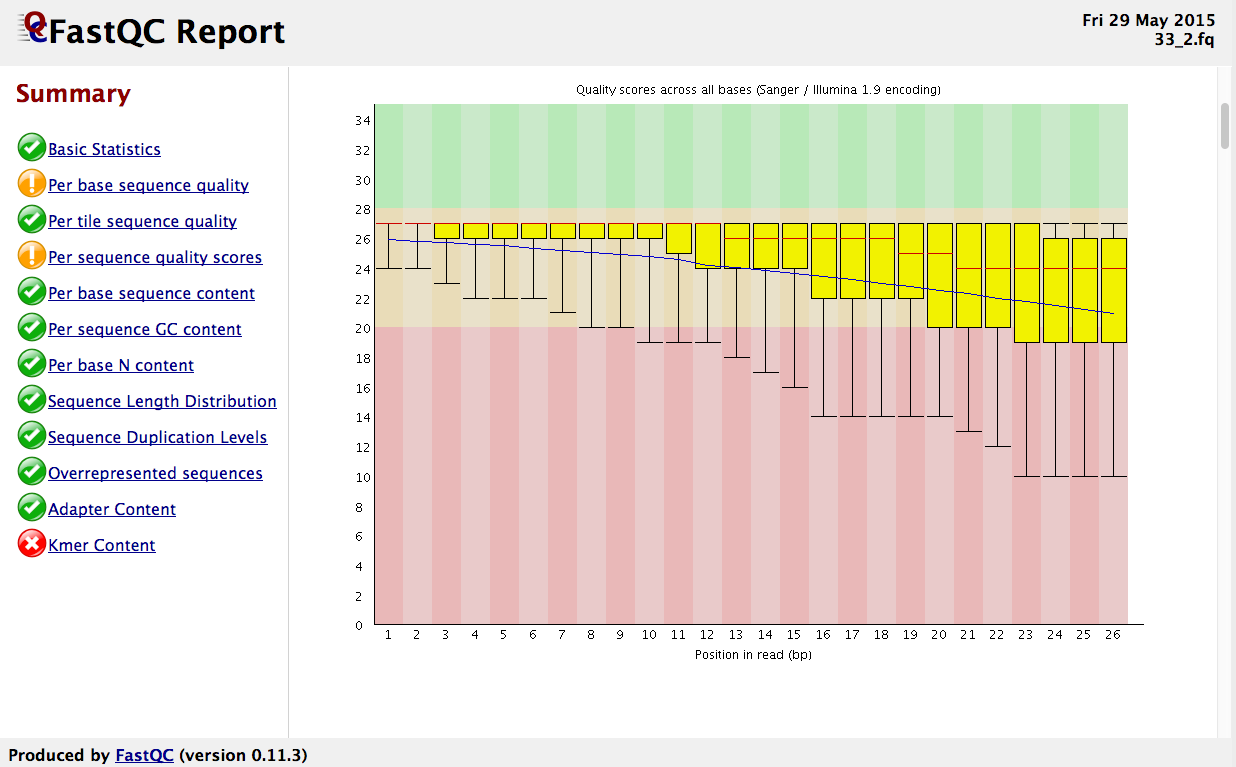
FASTQC - Probably it's the most popular software used to visualize the overall quality of the reads stored in FASTQ files. It has a graphical interface that's really handy for people not familiar with the command line. It also has access through the command line.

As you can see in the image above, the tool examines several aspects of your reads and provides feedback with "ok", "warning", and "problem" flags. Understanding the reasons behind these warnings and problems is crucial, but keep in mind that these issues don't necessarily compromise your analyses. They serve as checkpoints to guide your next steps in data processing and interpretation.
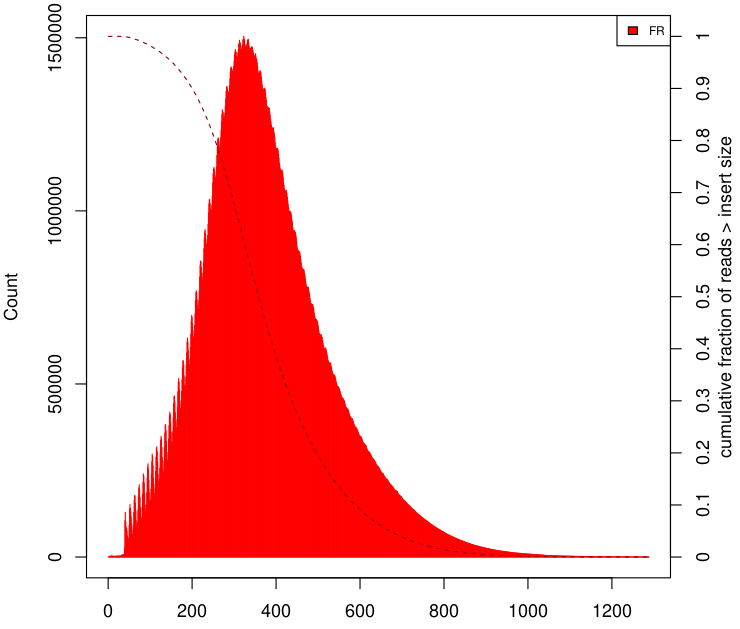
Picard (CollectInsertSizeMetrics) - As previously discussed, when working with paired-end reads, it's possible to estimate the size of your DNA fragments. This useful feature of the Picard toolkit relies on having an alignment, a topic we'll delve into in upcoming posts. Below you can see an example of a histogram made by this tool.

Visit this really good blog post from thegenomefactory to go a little deeper into paired-end reads, especially to understand what is insert size.
Alignment
When working with known species (like humans, pigs, sorghum, corn, etc.), you can leverage the availability of a reference genome to analyze your data. The step of finding the best match location for each sequencing read within the reference genome is known as 'alignment'.
Using a reference genome unlocks a wealth of pre-existing information – from chromosomes, genes, and proteins, to repetitive elements and more. Beyond providing a robust framework for analysis, it also empowers clearer communication of your findings. For instance, you could report: 'We've discovered a novel mutation in this population – an expansion of X kilobases on chromosome N, starting at position Y – which exhibits a strong correlation with the observed phenotype.' This use of a common reference facilitates precise, universally understood statements about genetic discoveries.
For aligning short reads obtained from a genome sequencing experiment I think BWA is the most used software. It is part of the Broad Institute's best practices for genotyping. A few years ago they released the bwa-mem2 and it's worth checking it.
When it comes to aligning short reads from a transcriptome sequencing experiment, STAR (Spliced Transcripts Alignment to a Reference) software is likely your go-to choice. Unlike genome reads, RNA sequences typically consist of only the exon portions of genes, a feature that requires specialized alignment. This is precisely where STAR shines – it is designed to handle this unique aspect of RNA-sequencing data effectively.
When it comes to aligning long reads generated from genome sequencing experiments, Minimap2 is a compelling choice. It supports sequencing data from both PacBio and Nanopore platforms and has been engineered to manage noisy reads, a characteristic inherent to long-read sequencing technologies.
Genome Assembly
For certain species, a fully assembled genome is still a missing piece in the puzzle, sometimes lacking even a closely related available genome for reference. This is often the circumstance where researchers start putting to work their FASTQ reads from genome sequencing experiments, taking on the daunting task of assembling the whole genome.
However, this endeavor can be challenging, particularly when the genome is riddled with repetitive elements. It's here that long-read sequencing technologies, such as PacBio and Nanopore, step up to the plate. These platforms excel at resolving these complexities, shedding light on even the most intricate genomic landscapes.
An insightful remark was once shared with me: "When you observe a plethora of tools striving to address the same problem, it's a clear indication that the problem is yet to be fully resolved."
It seems to me that we're still in this phase when it comes to genome assemblers. Navigating this realm will require testing a variety of tools, each deploying different strategies, to discover the one that most accurately interprets your genome or data. One strategy I find interesting is to combine short and long reads. Some tools I already have tried are: Soapdenovo2, Canu, Flye and Spades.
That's it for today. In our upcoming post, we're likely to delve into the intricate world of alignment formats: SAM, BAM, and CRAM. Stay tuned!
Subscribe to my newsletter
Read articles from Lucas Taniguti directly inside your inbox. Subscribe to the newsletter, and don't miss out.
Written by

Lucas Taniguti
Lucas Taniguti
I am a bioinformatician and backend developer at Mendelics, a leading genetic diagnostic company in Latin America.