Log Aggregation for Cumulocity IoT Microservices
 TECHcommunity_SAG
Table of contents
Overview
In my last article about Microservice Monitoring I explained 2 ways how you can achieve a proper monitoring for your microservices hosted in Cumulocity. I explicitly excluded logging and log aggregation from that topic because it is another article worthy - which follows now!
What is Microservice Logging & Log Aggregation?
In general Logging for Microservices means that relevant information is printed out to the console and/or to some log files. Relevant information is everything that is defined worthy to be logged by the developer of that microservice.
Ideally a log framework is used which allows to define with which severity log entries are created and can be configured to output logs to multiple target destinations like console or files.
If you have multiple instances of several microservices running, it is probably very hard to check all the log files of them separately. Therefor log aggregation tools have been invented. Their main purpose is to collect logs from all microservices or applications and allow an easy context-based search in all of them.
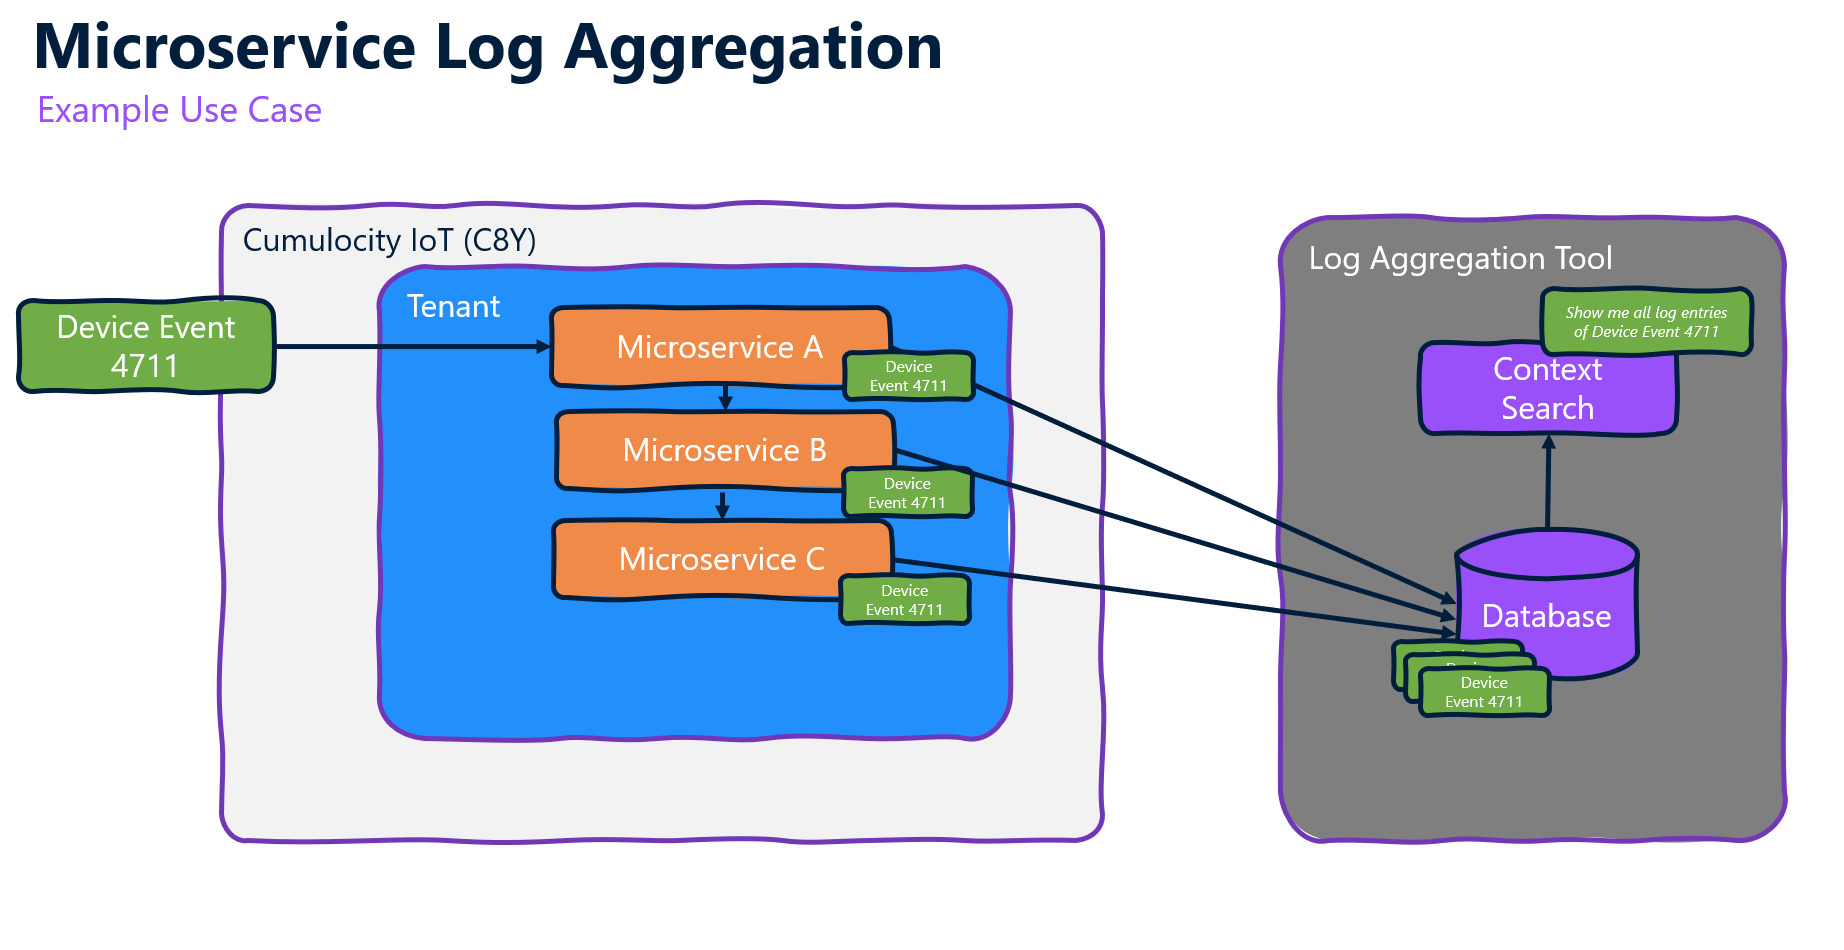
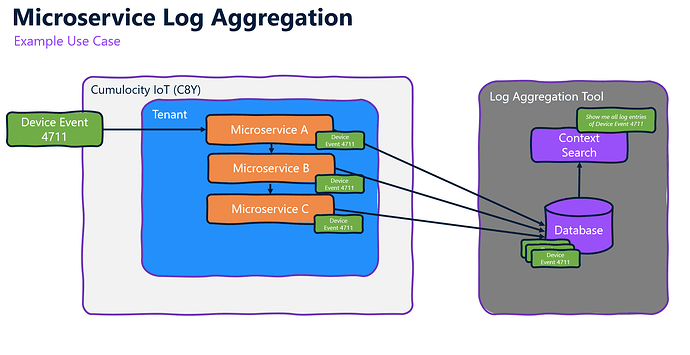
A very good example is that you have a device event that is processed by multiple microservices. Without log aggregation you would need to go to all the microservices, check the logs and search for the specific event each time. With log aggregation you probably search just for the event ID and get all the log entries of all microservices at one place and can very easily do you analysis.
Why is Microservice Log Aggregation important?
For microservices writing log entries into the filesystem (of that container) as log files is not recommended as they most likely run in containers which could be dynamically started and stopped, meaning, everything which is stored in file system will be overwritten. Therefor the best practice is to log everything to the console, so container management systems like Kubernetes or Docker can manage the logs and make them accessible during runtime. Still, if the container is restarted or shut down all the logs of the application running within the container are lost. To prevent that you need to store them in a log aggregation system. So, without log aggregation operating microservice in Cumulocity would be really hard. I would even argue that it is a must-have for productive microservice to proper operate and support them. Just think about the case your microservice get’s restarted due to application crash (OOM etc.). You don’t have the chance to do an root cause analysis without having the logs just before the crash.
Log Aggregation systems
There are plenty of log aggregation systems available. Cumulocity isn’t bound to any specific protocol or system so mostly all of them can be used. They are also offered in multiple variants like:
- open-source
- commercial license required
- as SaaS
- as CaaS
- and other variants
You can freely choose if you are fine by installing any open-source software by yourself, you need to buy a commercial tool and want to host it yourself or subscription-based using a cloud-service.
The main requirement the log aggregation tools have is that they need some storage and needs to be accessible by the application/microservices running somewhere to dump there logs to the tool.
The most comprehensive list of log aggregation tools I found can you find here: Top 46 Log Management Tools for Monitoring, Analytics and more.
In my previous guide about microservice monitoring I demonstrated to implement it based on the tools of Prometheus & Grafana. I want stick to the technology stack and will use Loki as an open-source log aggregation tool provided as a free offering as part of the Grafana cloud to demonstrate how to achieve that.
Guide to implement Log Aggregation for Cumulocity IoT hosted microservices
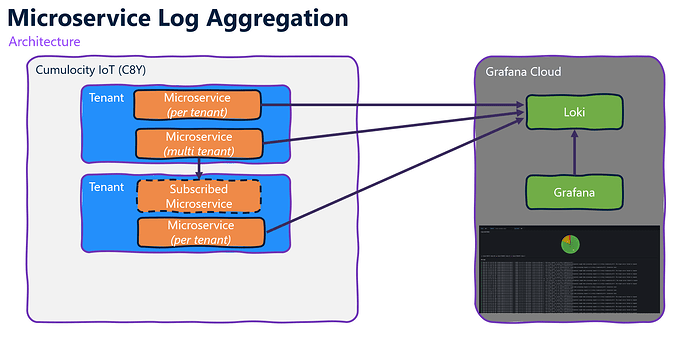
In this guide I will implement the following architecture by using one or multiple microservices, configures them to push their logs to Loki and use Grafana to visualize and search the logs.
Prerequisites
To follow my guide you need to following:
- A Cumulocity Tenant where Microservice hosting is enabled
- A free account for the Grafana Cloud
- Basic knowledge in microservice development (using Microservice SDK for Java)
Microservice implemented with Java Microservice SDK
Let’s start with the most easiest part by using the Java Microservice SDK to implement a microservice for Cumulocity IoT. The SDK uses Spring Boot which makes it easy to monitor and also to integrate log aggregation plugins.
Prepare your microservice
First step would be to add a new dependency to your pom.xml to add a log appender. As we use the SDK mainly logback is used in Spring Boot. If you are also using logback you can go for the following appender.
    <dependency>
        <groupId>com.github.loki4j</groupId>
        <artifactId>loki-logback-appender</artifactId>
        <version>1.4.2</version>
    </dependency>
Please note: Current microservice SDK version 1020.x uses Spring Boot 2.7.17 which uses logback 1.2.x. Therefor we need to use 1.4.2 of the appender and not the latest 1.5.1 which doesn’t support logback 1.2.x anymore.
If you use log4j or other logging frameworks you can give this appender a try: GitHub - tkowalcz/tjahzi: Java clients, log4j2 and logback appenders for Grafana Loki
Next we need to add the logback configuration file to our project. Add a logback-spring.xml to configure the loki appender accordingly in the src/main/resources folder of your project:
    <?xml version="1.0" encoding="UTF-8"?>
    <configuration>
        <include resource="org/springframework/boot/logging/logback/defaults.xml"/>
        <include resource="org/springframework/boot/logging/logback/console-appender.xml" />
        <springProfile name="dev">
            <logger name="org.springframework.web" level="INFO" />
            <logger name="org.apache.commons.httpclient" level="INFO" />
            <logger name="httpclient.wire" level="DEBUG" />
            <logger name="${package}" level="DEBUG" />
            <logger name="com.cumulocity" level="DEBUG" />
        </springProfile>

        <springProfile name="test">
            <logger name="org.springframework.web" level="INFO" />
            <logger name="org.apache.commons.httpclient" level="INFO" />
            <logger name="httpclient.wire" level="INFO" />
            <logger name="${package}" level="DEBUG" />
            <logger name="com.cumulocity" level="DEBUG" />
        </springProfile>

        <springProfile name="prod">
            <logger name="com.cumulocity" level="INFO" />
            <logger name="${package}" level="INFO" />
        </springProfile>

        <appender name="LOKI" class="com.github.loki4j.logback.Loki4jAppender">
            <batchMaxBytes>65536</batchMaxBytes>
            <http>
                <url>{GrafanaCloudHost}/loki/api/v1/push</url>
                <auth>
                    <username>{user]</username>
                    <password>{token}</password>
                </auth>
                <requestTimeoutMs>15000</requestTimeoutMs>
            </http>
            <format>
                <label>
                    <pattern>app={AppName},host=${HOSTNAME},level=%level</pattern>
                    <readMarkers>true</readMarkers>
                </label>
                <message>
                    <pattern>l=%level c=%logger{20} t=%thread | %msg %ex</pattern>
                </message>
            </format>
        </appender>

        <root level="INFO">
            <appender-ref ref="LOKI" />
            <appender-ref ref="CONSOLE" />
        </root>
    </configuration>
You need to replace the user, token and GrafanaCloudHost with the credentials provided in your grafana cloud account. Also please add a meanigful AppName to the label pattern so you can easily filter the logs in Grafana later on.

If you want, you can adapt the message pattern matching to the one you wanted to have in grafana cloud.
Important: Next you need to copy the
logback-spring.xmlfile tosrc/main/configurationfolder and rename it to<artifactID>-logging.xml. Example:dynamic-mapping-service-logging.xml. This is necessary due to this issue: Microservice Java SDK overwriting logback config?!
If you now (re)deploy your microservice to Cumulocity with the correct configuration the logs should be forwarded to Grafana Cloud.
Configure Grafana to visualize logs
In your Grafana cloud you can start Grafana and check if logs are retrieved by clicking on Explore. Select your loki instance and filter on the label App selecting the app you have defined in the step before. Click on Run Query to check the logs retrieved.
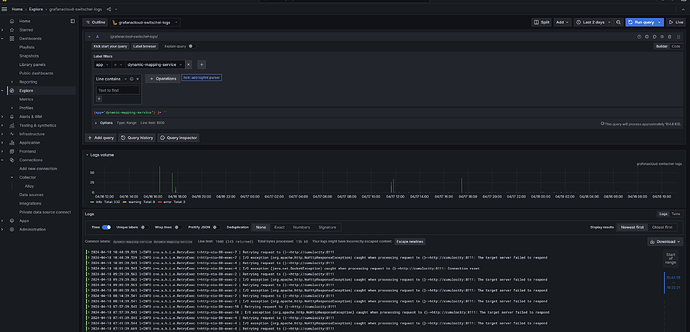
Now it’s time to create our very simple first Log Dashboard within Grafana!
Click on Dashboards → New → Import to import the following basic Dashboard
    {
      "__inputs": [
        {
          "name": "DS_GRAFANACLOUD-SWITSCHEL-LOGS",
          "label": "grafanacloud-switschel-logs",
          "description": "",
          "type": "datasource",
          "pluginId": "loki",
          "pluginName": "Loki"
        }
      ],
      "__elements": {},
      "__requires": [
        {
          "type": "grafana",
          "id": "grafana",
          "name": "Grafana",
          "version": "11.1.0-69372"
        },
        {
          "type": "panel",
          "id": "logs",
          "name": "Logs",
          "version": ""
        },
        {
          "type": "datasource",
          "id": "loki",
          "name": "Loki",
          "version": "1.0.0"
        },
        {
          "type": "panel",
          "id": "piechart",
          "name": "Pie chart",
          "version": ""
        }
      ],
      "annotations": {
        "list": [
          {
            "builtIn": 1,
            "datasource": {
              "type": "grafana",
              "uid": "-- Grafana --"
            },
            "enable": true,
            "hide": true,
            "iconColor": "rgba(0, 211, 255, 1)",
            "name": "Annotations & Alerts",
            "type": "dashboard"
          }
        ]
      },
      "editable": true,
      "fiscalYearStartMonth": 0,
      "graphTooltip": 0,
      "id": null,
      "links": [],
      "panels": [
        {
          "datasource": {
            "type": "loki",
            "uid": "${DS_GRAFANACLOUD-SWITSCHEL-LOGS}"
          },
          "fieldConfig": {
            "defaults": {
              "color": {
                "mode": "palette-classic"
              },
              "custom": {
                "hideFrom": {
                  "legend": false,
                  "tooltip": false,
                  "viz": false
                }
              },
              "mappings": [],
              "unit": "none"
            },
            "overrides": [
              {
                "matcher": {
                  "id": "byName",
                  "options": "{level=\"ERROR\"}"
                },
                "properties": [
                  {
                    "id": "color",
                    "value": {
                      "fixedColor": "red",
                      "mode": "fixed"
                    }
                  }
                ]
              }
            ]
          },
          "gridPos": {
            "h": 9,
            "w": 24,
            "x": 0,
            "y": 0
          },
          "id": 2,
          "options": {
            "displayLabels": [
              "value"
            ],
            "legend": {
              "displayMode": "list",
              "placement": "bottom",
              "showLegend": true,
              "values": [
                "value"
              ]
            },
            "pieType": "pie",
            "reduceOptions": {
              "calcs": [
                "count"
              ],
              "fields": "",
              "values": false
            },
            "tooltip": {
              "mode": "single",
              "sort": "none"
            }
          },
          "targets": [
            {
              "datasource": {
                "type": "loki",
                "uid": "${DS_GRAFANACLOUD-SWITSCHEL-LOGS}"
              },
              "editorMode": "builder",
              "expr": "sum by(level) (rate({host=~\"$Host\", level=~\"$loglevel\"} |= `$Search` [$__auto]))",
              "queryType": "range",
              "refId": "A"
            }
          ],
          "title": "Log Level Stats",
          "type": "piechart"
        },
        {
          "datasource": {
            "type": "loki",
            "uid": "${DS_GRAFANACLOUD-SWITSCHEL-LOGS}"
          },
          "gridPos": {
            "h": 20,
            "w": 24,
            "x": 0,
            "y": 9
          },
          "id": 1,
          "options": {
            "dedupStrategy": "none",
            "enableLogDetails": true,
            "prettifyLogMessage": false,
            "showCommonLabels": false,
            "showLabels": true,
            "showTime": true,
            "sortOrder": "Descending",
            "wrapLogMessage": false
          },
          "targets": [
            {
              "datasource": {
                "type": "loki",
                "uid": "${DS_GRAFANACLOUD-SWITSCHEL-LOGS}"
              },
              "editorMode": "builder",
              "expr": "{host=~\"$Host\", level=~\"$loglevel\"} |= `$Search`",
              "queryType": "range",
              "refId": "A"
            }
          ],
          "title": "Log Entries",
          "type": "logs"
        }
      ],
      "schemaVersion": 39,
      "tags": [],
      "templating": {
        "list": [
          {
            "current": {},
            "datasource": {
              "type": "loki",
              "uid": "${DS_GRAFANACLOUD-SWITSCHEL-LOGS}"
            },
            "definition": "",
            "hide": 0,
            "includeAll": true,
            "multi": true,
            "name": "Host",
            "options": [],
            "query": {
              "label": "host",
              "refId": "LokiVariableQueryEditor-VariableQuery",
              "stream": "",
              "type": 1
            },
            "refresh": 2,
            "regex": "",
            "skipUrlSync": false,
            "sort": 0,
            "type": "query"
          },
          {
            "current": {
              "selected": false,
              "text": "",
              "value": ""
            },
            "hide": 0,
            "name": "Search",
            "options": [
              {
                "selected": true,
                "text": "",
                "value": ""
              }
            ],
            "query": "",
            "skipUrlSync": false,
            "type": "textbox"
          },
          {
            "current": {},
            "datasource": {
              "type": "loki",
              "uid": "${DS_GRAFANACLOUD-SWITSCHEL-LOGS}"
            },
            "definition": "",
            "hide": 0,
            "includeAll": true,
            "label": "Log Level",
            "multi": true,
            "name": "loglevel",
            "options": [],
            "query": {
              "label": "level",
              "refId": "LokiVariableQueryEditor-VariableQuery",
              "stream": "",
              "type": 1
            },
            "refresh": 2,
            "regex": "",
            "skipUrlSync": false,
            "sort": 0,
            "type": "query"
          }
        ]
      },
      "time": {
        "from": "now-24h",
        "to": "now"
      },
      "timeRangeUpdatedDuringEditOrView": false,
      "timepicker": {},
      "timezone": "browser",
      "title": "Microservice Logging Dashboard",
      "uid": "edj35g4ey7o5cf",
      "version": 20,
      "weekStart": ""
    }
In the end you have a very basic Logging Dashboard that displays a Pie Chart of all available log levels, log entries by host and a log entries list with all detailed logs in the selected time range. You can filter by either the Host, log level, app or entering a search term to search for specific log entries.
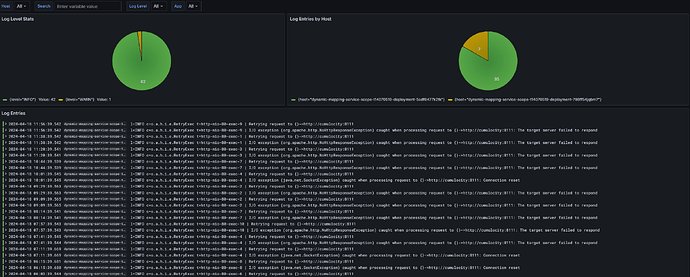
If you want more a comprehensive Dashboard, please follow one of the very good resources of Grafana to do so.
Non-SDK developed microservices
If you implement a microservice not using the official Java SDK, you can check the 3rd Party clients for Loki. There are clients for almost every programming language available. For example you can find clients for Python, C#, Go, JavaScript and many more here:
Send log data to Loki | Grafana Loki documentation
All the steps above are quite the same: You need to add the client to your microservice implementation, configure it accordingly and work with the available log data in Grafana to create Dashboards.
Outlook - Open Telemetry Instrumentation
Instead of adding log appenders for each programming language and logging framework there is a pretty new Open Telemetry Protocol (OTLP) which tries to define a standard for application metrics, logging, traces and more. It also comes with some automatic instrumentation logic for a lot of frameworks which automatically generates via bytecode manipulation etc. all the data to monitor your application. Here is an example for Java & Spring Boot:
Spring Boot
Adopted to Cumulocity IoT Microservices developed with the Java SDK you just need to add the mentioned dependencies, provide a proper configuration like this
    otel.exporter.otlp.protocol=http/protobuf
    otel.exporter.otlp.endpoint=https://otlp-gateway-prod-eu-west-2.grafana.net/otlp
    otel.resource.attributes.service.name=<Microservice Name>
    otel.exporter.otlp.headers=Authorization=Basic xxx
    otel.instrumentation.micrometer.enabled=true
and configure the OTLP appender in your logback.xml like this
        <appender name="OpenTelemetry"
                  class="io.opentelemetry.instrumentation.logback.appender.v1_0.OpenTelemetryAppender">
        </appender>

        <root level="INFO">
            <appender-ref ref="CONSOLE" />
            <appender-ref ref="OpenTelemetry"/>
        </root>
With that you get JVM metrics, logs and even traces pushed via OTLP to the Grafana Cloud of your microservice.
Open Telemetry Instrumentation is available for the common programming languages like Java, JavaScript, Python, and .NET
Zero-code
Important note: Some of the OTLP instrumentations are still in alpha. Also the OTLP Push endpoint in Grafana is pretty new. You can try it for testing purpose out but for monitoring of productive microservice I would still use the classical approach using scrape jobs via prometheus endpoints and log appenders.
Summary
In this article I demonstrated how you can make use of 3rd Party Tools like Grafana Cloud to enable log aggregation for your Cumulocity hosted microservices. Only when you implemented a logging outside of Cumulocity you can make sure that your logs preserved and you can do a proper analysis on issues or in general. This can be seen as an important addition to Microservice Monitoring which I covered in this article:
 Microservice Monitoring in Cumulocity IoT
Overview Cumulocity IoT can be extended with Microservices which are deployed to tenants. Large IoT solutions often consist of multiple microservices serving different purposes and might be critical for the overall success of that solution. In that case, you might not want to rely on “luck” or “prayers” but you want to make sure that your microservices are operating normal and if not instantly get informed about it. In short: You want to monitor your microservices. In this article, I will exp…
Of course using Grafana Cloud and it’s stack is only one option how this can be achieved. There are plenty of other log aggregation tools available and the approach to integrate them is very similar. All of them have clients available for multiple programming languages and offer even more sophisticated search functionality out of the box.
I would be happy to get your feedback about! Which log aggregation tool do you prefer? How do your do your log search?
Special Challenge for the IoT Community Awards
Interested in getting additional 500 points for the IoT Community Awards? Be the first who posts a comment with a screenshot of your Grafana Logging Dashboard for a Cumulocity IoT Microservice or even share your whole Dashboard JSON / ID!
Subscribe to my newsletter
Read articles from TECHcommunity_SAG directly inside your inbox. Subscribe to the newsletter, and don't miss out.
Written by

TECHcommunity_SAG
TECHcommunity_SAG
Discover, Share, and Collaborate with the Software AG Tech Community The Software AG Tech Community is your single best source for expert insights, getting the latest product updates, demos, trial downloads, documentation, code samples, videos and topical articles. But even more important, this community is tailored to meet your needs to improve productivity, accelerate development, solve problems, and achieve your goals. Join our dynamic group of users who rely on Software AG solutions every day, follow the link or you can even sign up and get access to Software AG's Developer Community. Thanks for stopping by, we hope to meet you soon.