Week 5: PySpark Playground - Aggregates and Windows 🏀
 Mehul Kansal
Hey there, fellow data engineers! This week's blog aims to delve into the various methods of accessing columns in PySpark, explore the different types of aggregate functions, and understand the utility of window functions. By the end of this post, you will have a comprehensive understanding of how to leverage these features to manipulate and analyze data effectively.
Accessing columns
- There are various ways of accessing columns in PySpark.
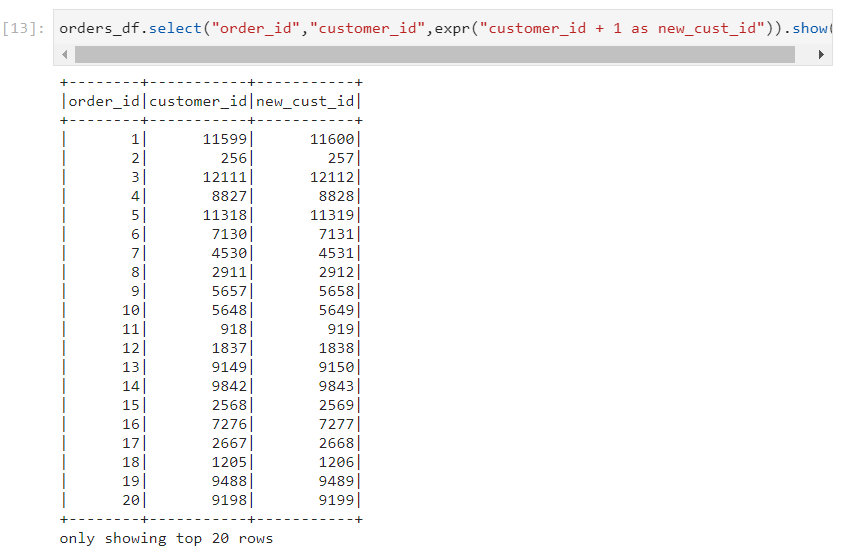
- Consider the following dataframe that we have created from our dataset.
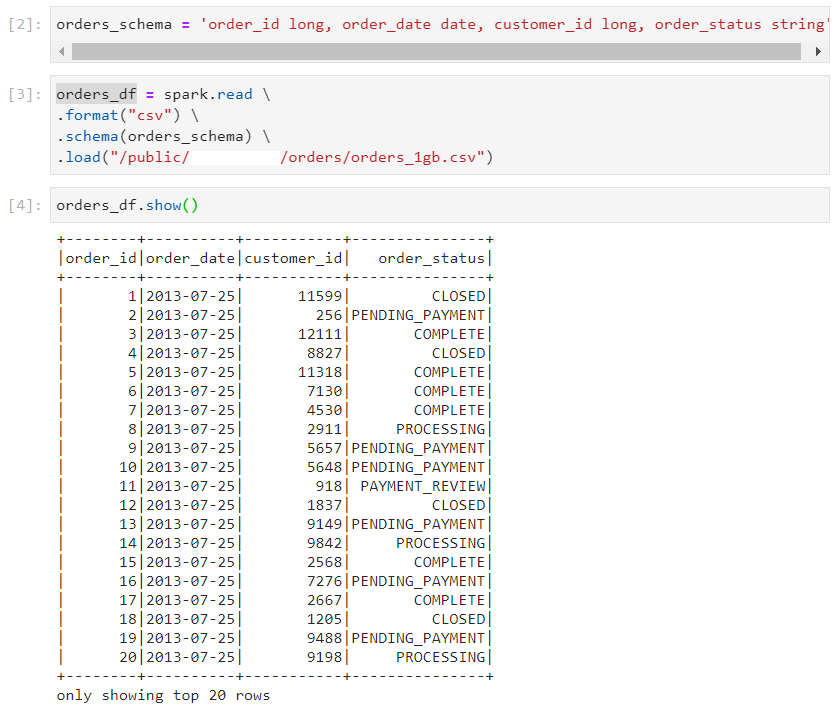
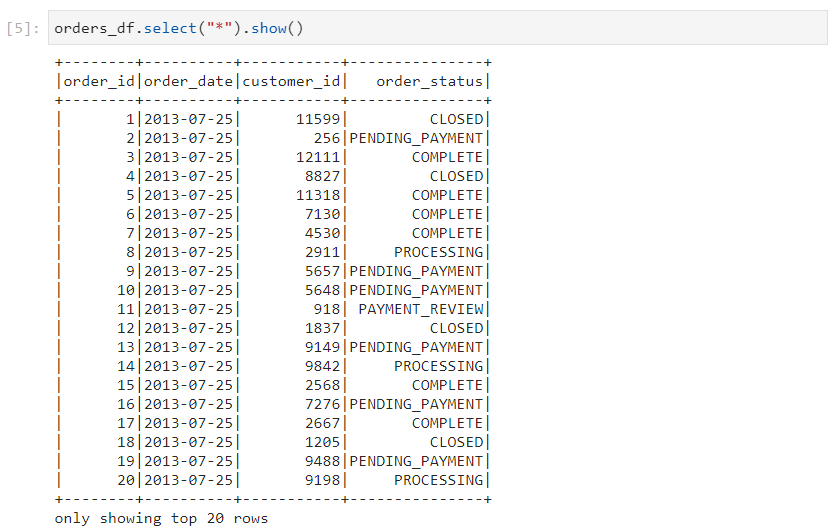
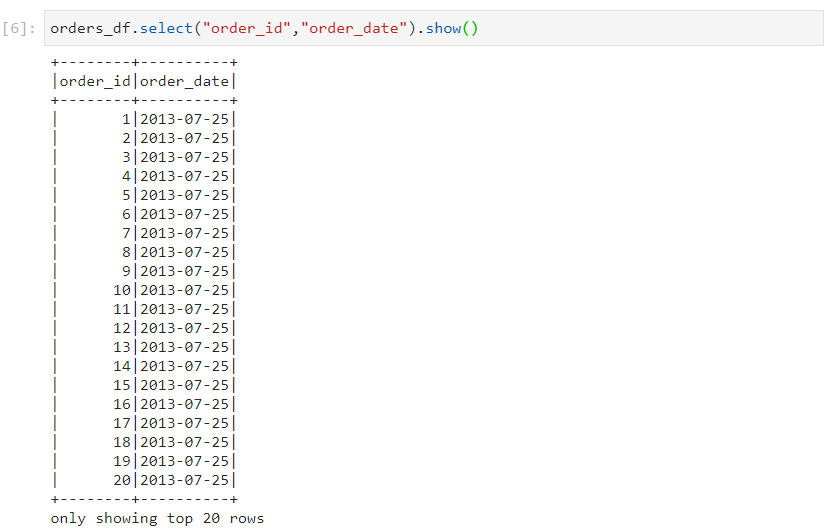
- String notation: This is the most straightforward way of accessing the columns, in which we mention column names directly inside select function.
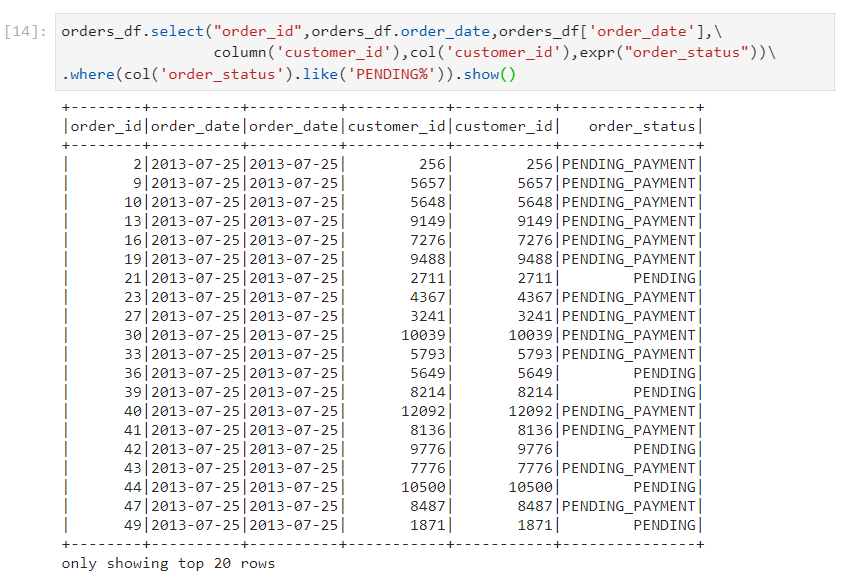
Prefixing column name with dataframe name: In some scenarios, if different dataframes have same column names, an ambiguity may arise. This can be resolved by explicitly mentioning the dataframe name before the column.
Ex: orders_df.order_date
Column object notation: We can also access the column by using predefined functions as follows: column('customer_id') or col('customer_id').
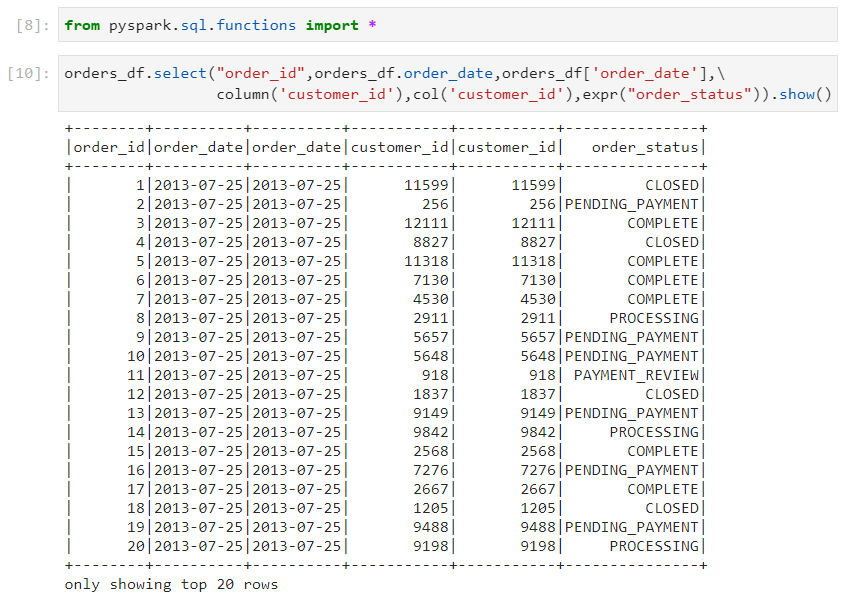
Columns expression: Accessing columns with this method is required when evaluation needs to be performed in a SQL way.
Ex: expr('customer_id + 1 as new_cust_id')
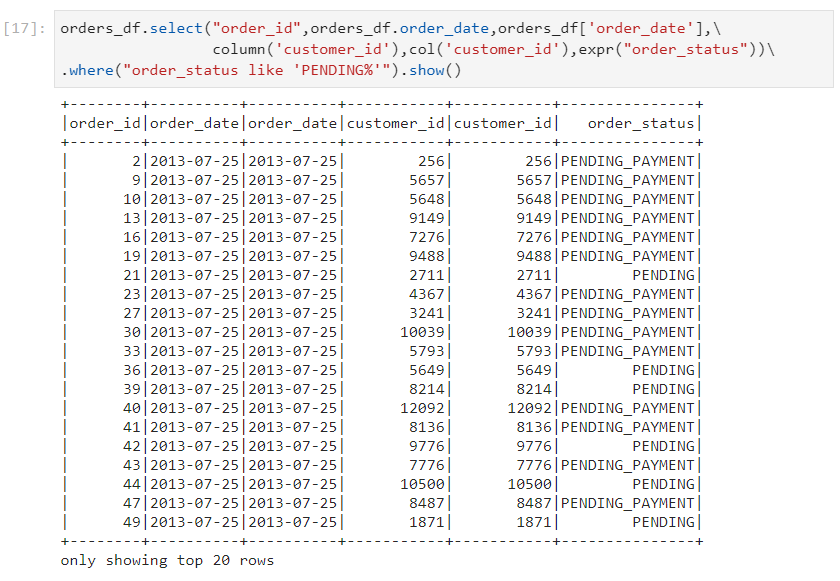
- In column object, we use a programmatic approach. Ex: where(col('order_status').like('PENDING')) or where("order_status like 'PENDING'%'")
Aggregate functions
Aggregate functions provide us with a way of combining multiple input rows together to give a consolidated output.
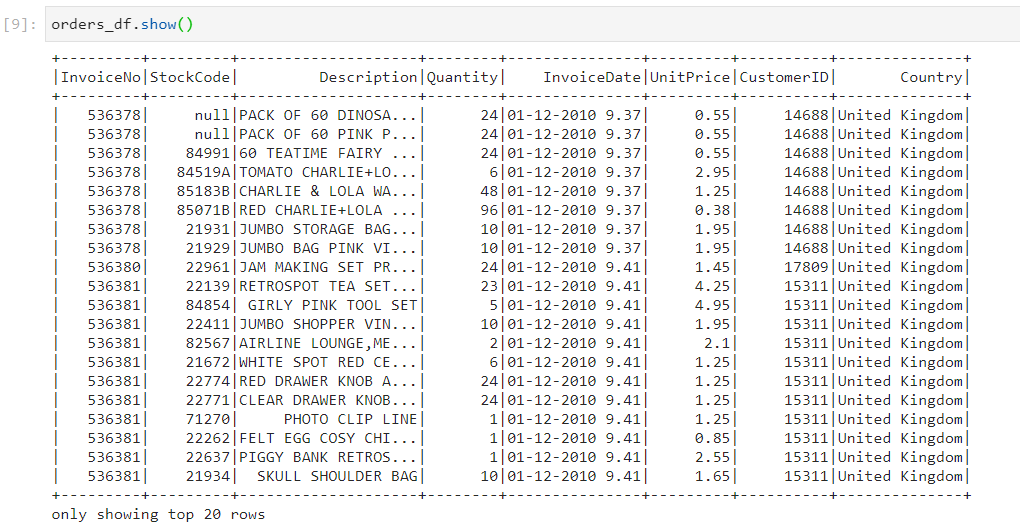
Consider that we have the following orders.csv dataset.
Simple Aggregations
- Simple aggregations accept multiple input rows to give only one output row.
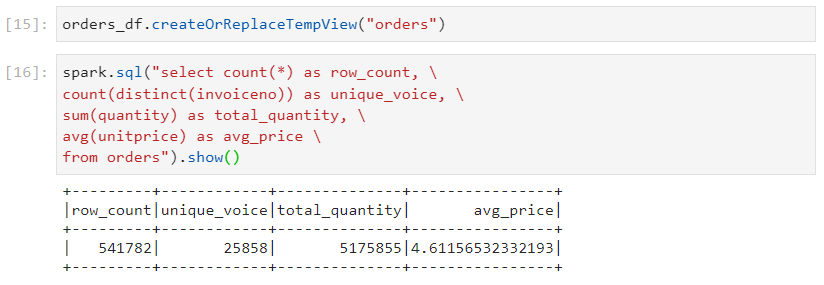
- We are required to count the total number of records, count the number of distinct invoice ids, sum of quantities and average unit price. There are three ways in which we can solve these.
- Programmatic style

- Column expression style

- Spark SQL style
Grouping aggregations
- Grouping aggregations accept multiple input rows belonging to a group. For each group, we get one output row.
Consider that for the same orders.csv dataset, we are required to group on the basis of invoice number and country, and:
find the total quantity for each group
find the total invoice amount (quantity * unit price)
- Programmatic style
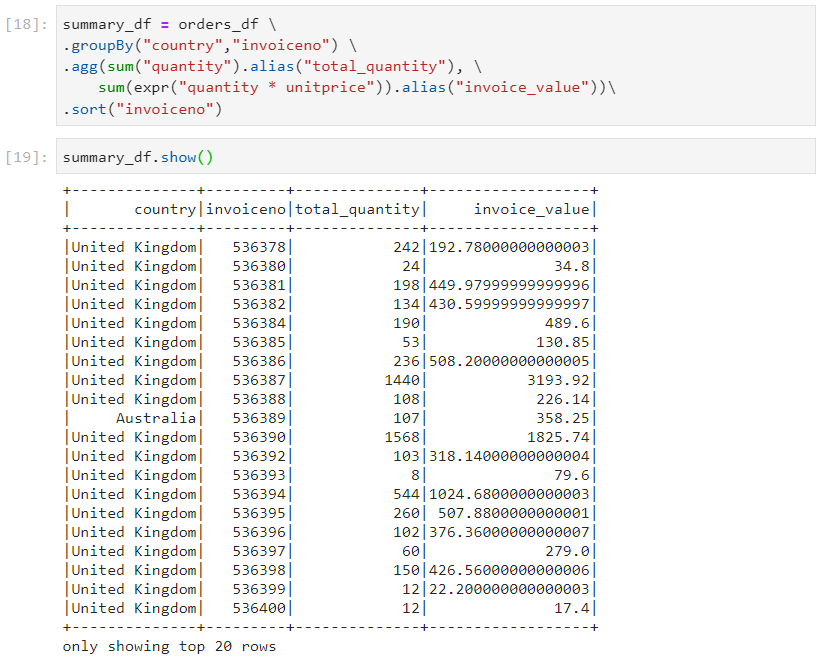
- Column expression style
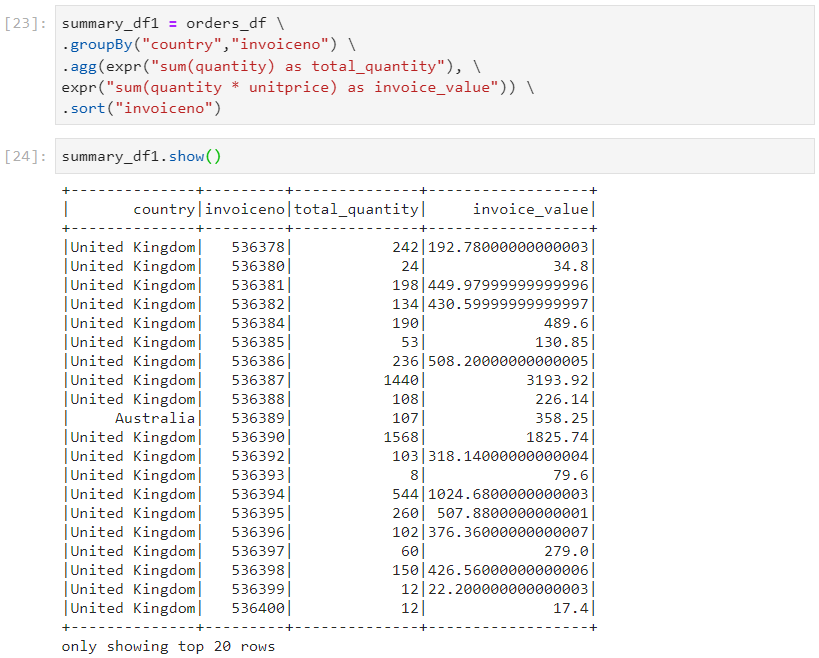
- Spark SQL style
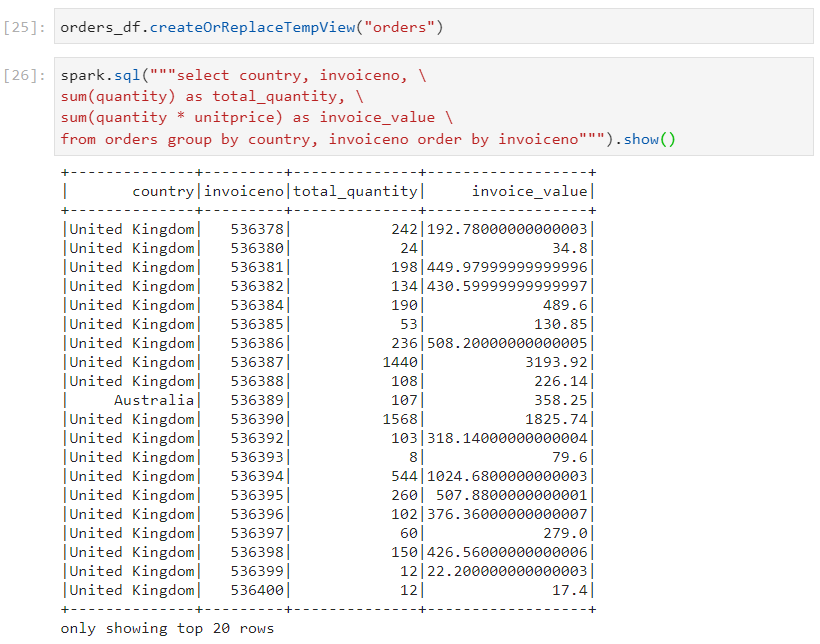
Windowing aggregations
- Windowing aggregations generate output by performing operations on a predefined set of rows within a window.
Consider the upcoming dataset. We are required to define the following three parameters:
partition column: partition by based on country
sorting column: sort based on week number
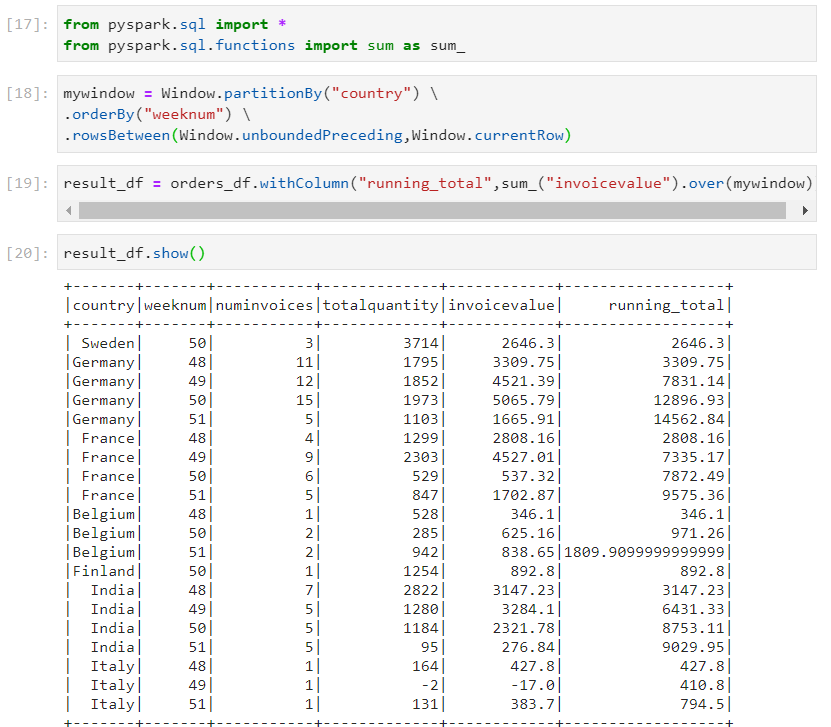
window size: size based on the start row and end row
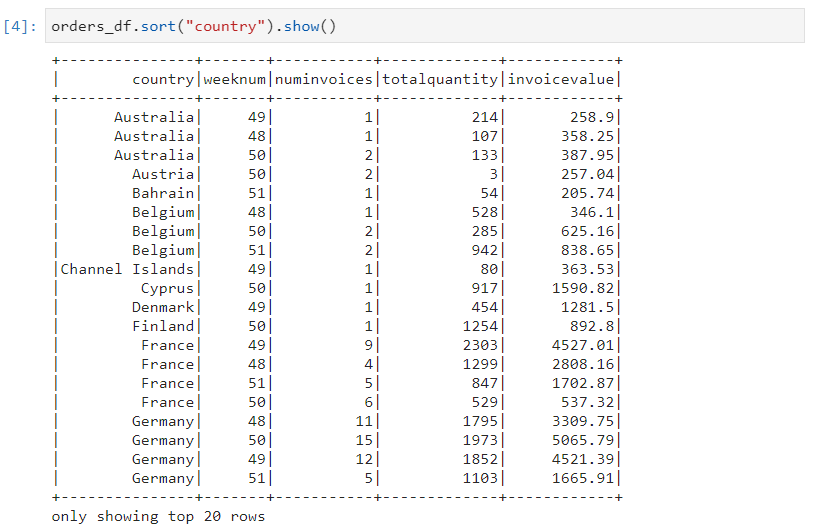
- We need to find the running total of invoice value after considering all of the three parameters mentioned above.
Windowing functions
PySpark windowing functions perform statistical operations such as rank, row number, etc. on a group, frame or collections of rows, and return results for each row individually.
Consider the following dataset.
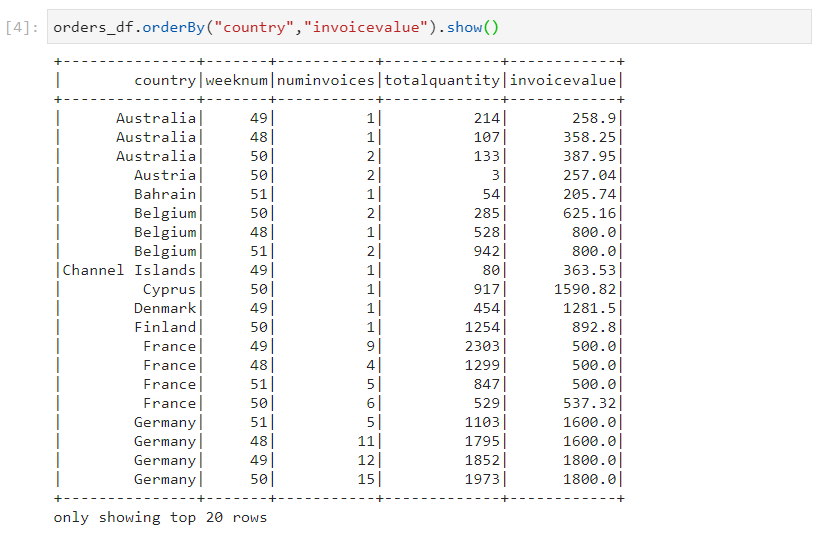
- Rank: In Rank, some ranks can be skipped if there are clashes in the ranks.
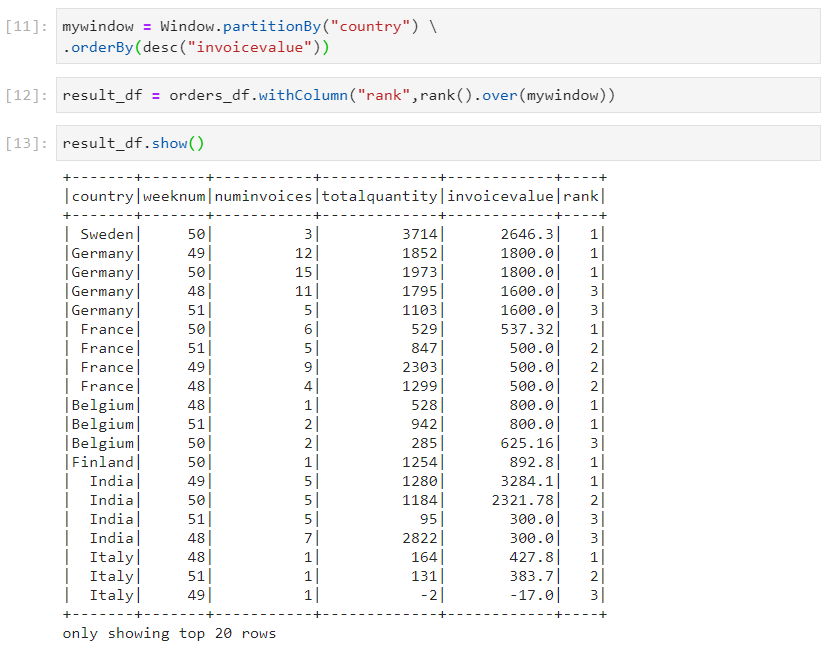
- Dense rank: In dense rank, the ranks are not skipped even if there are clashes in the ranks.
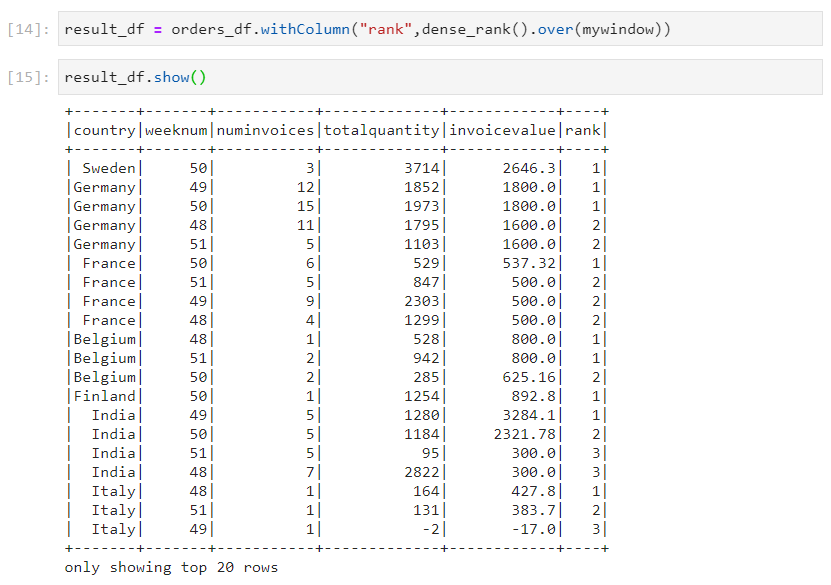
- Row number: In row number, different row numbers are assigned even in case of clashes in ranks. It plays an important role in calculating the top-n results.
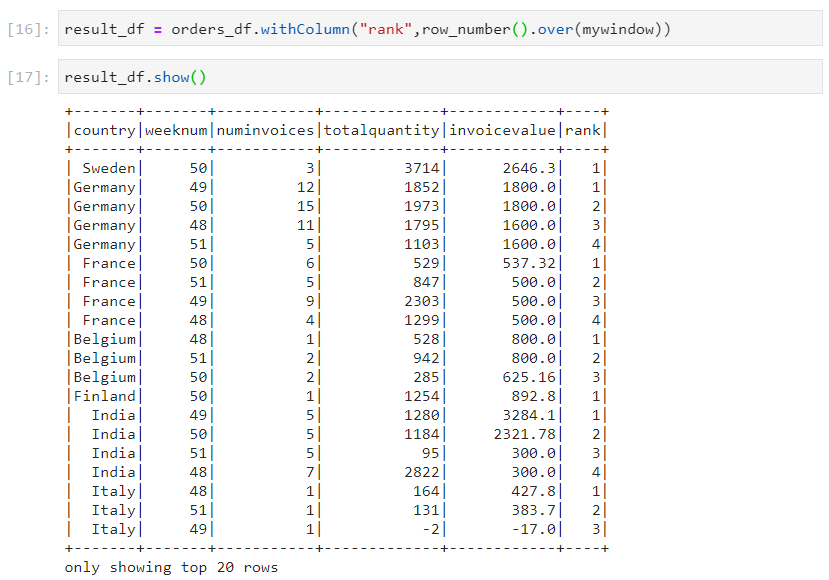
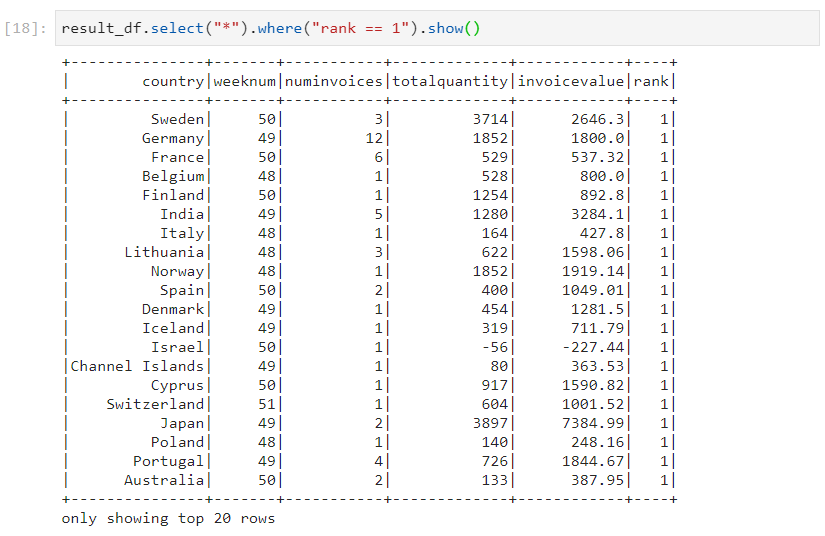
- Top invoice values from each country.
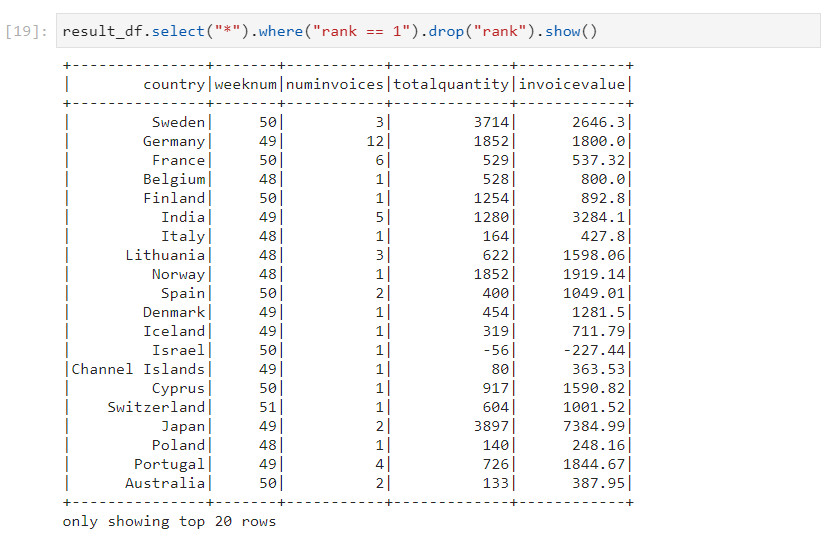
- When its work is done, the rank column can be dropped.
- Consider the same dataset again.
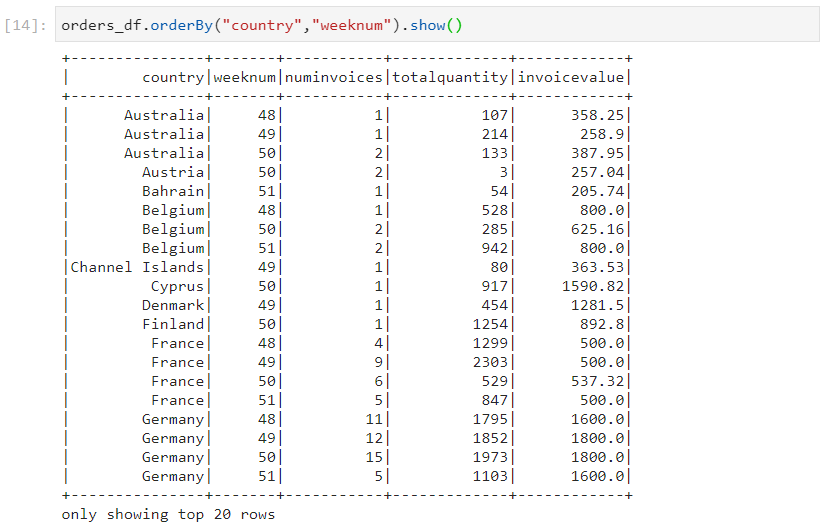
- Lag: Lag is used when the current row needs to be compared with the previous row.
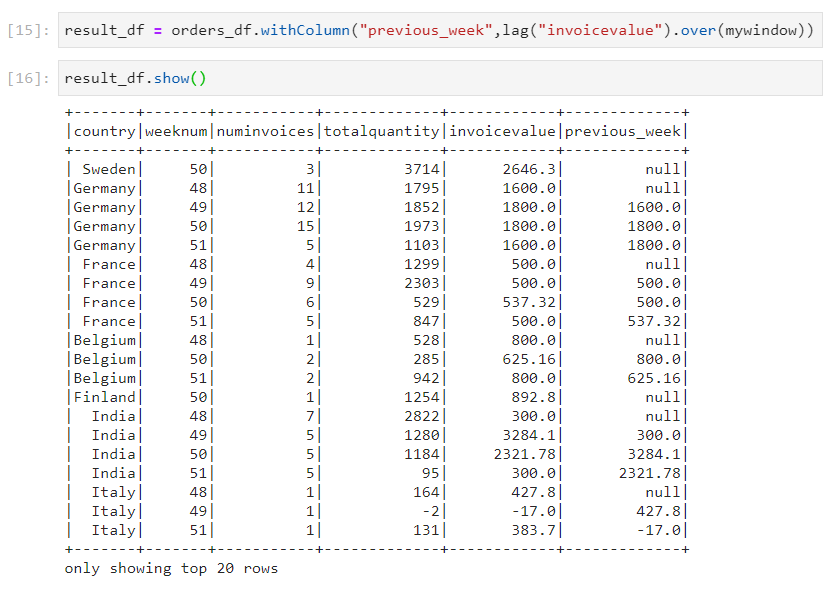
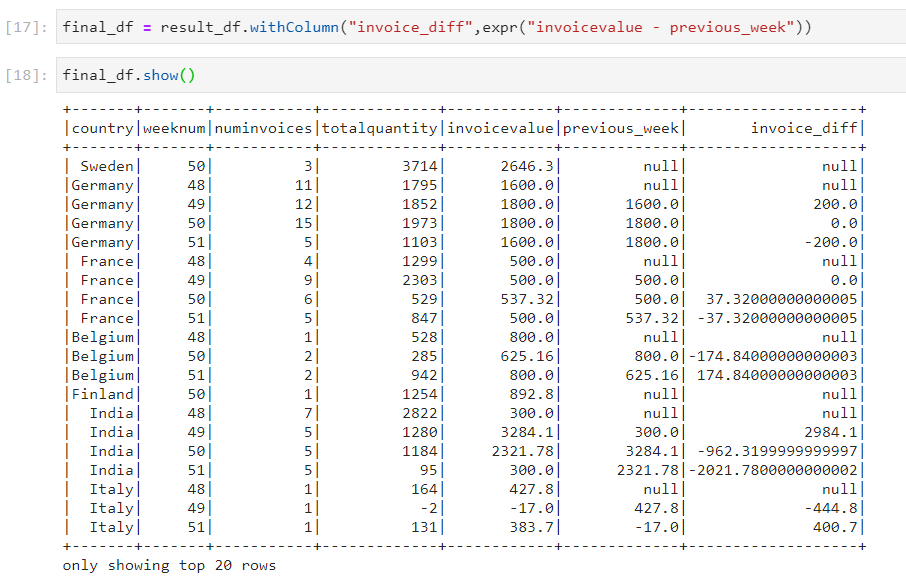
- Use case: We need to calculate the invoice difference between current week and previous week invoice values.
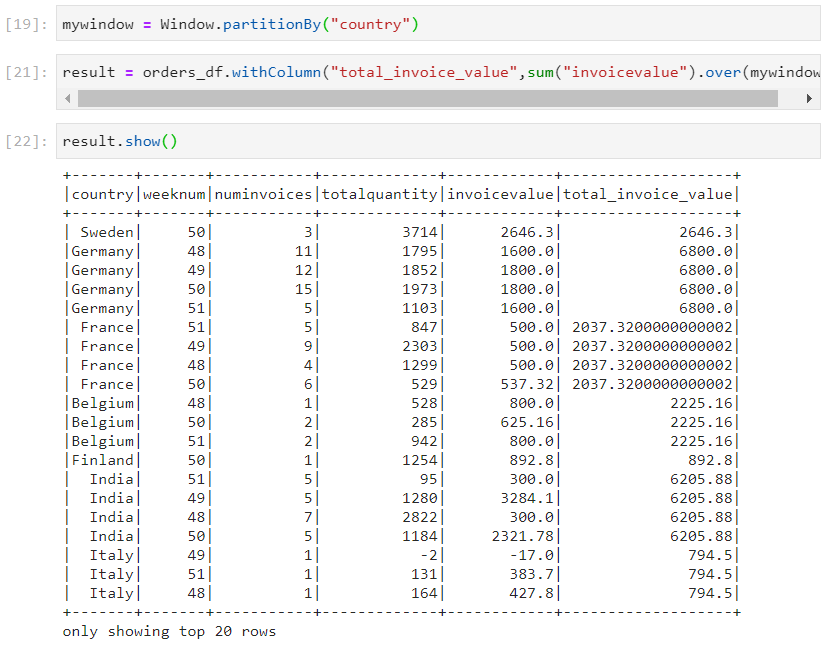
- Sum: Sum is used when we need to calculate the total over a window.
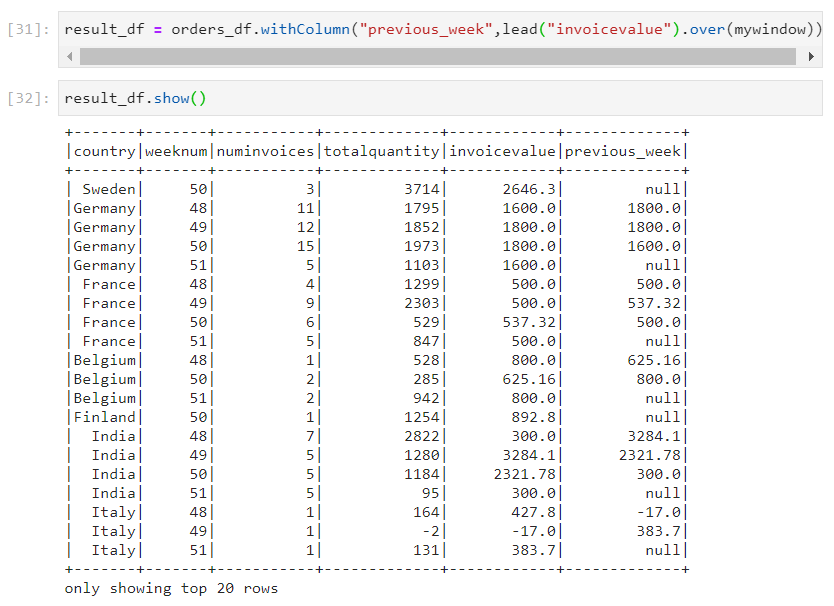
- Lead: Lead is used when the current row needs to be compared with the next row.
Analyzing log files
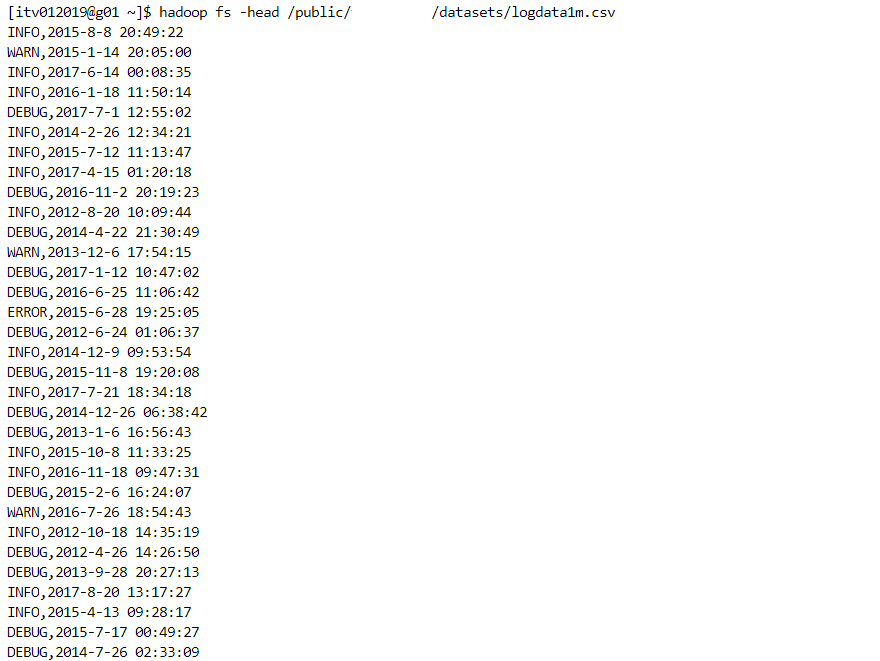
- Some valuable inferences can be deduced by analyzing log files. Let's consider the following log data.
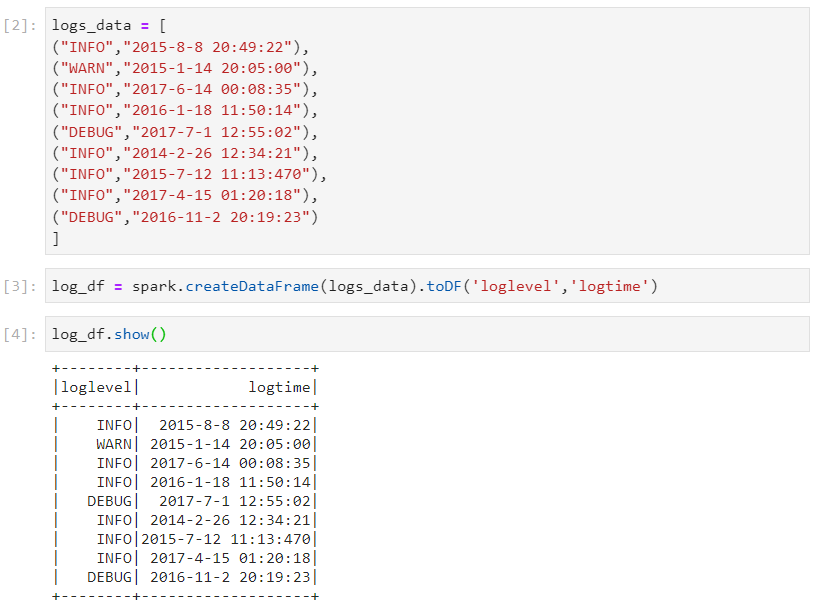
- Firstly, we need to develop the logic for a small sample data.
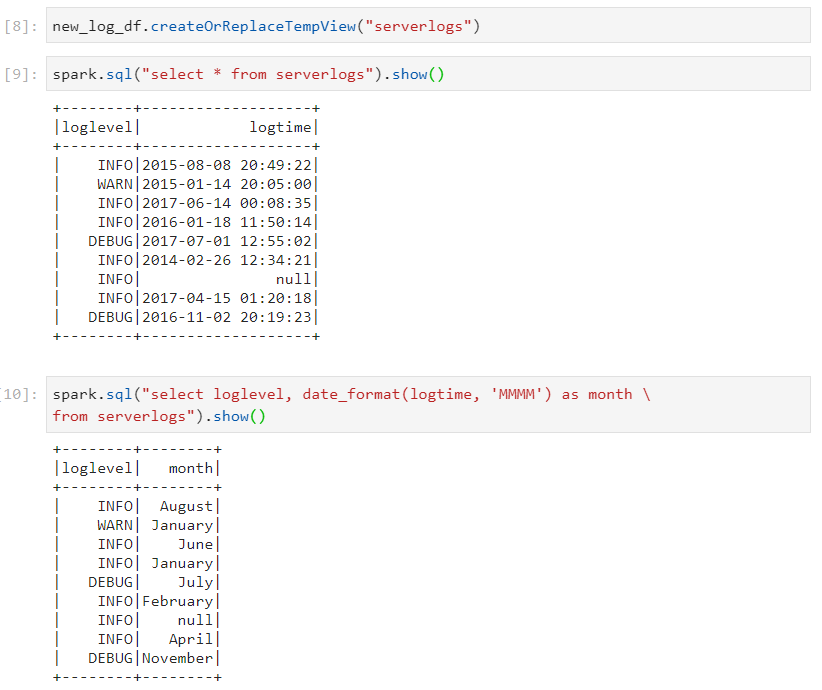
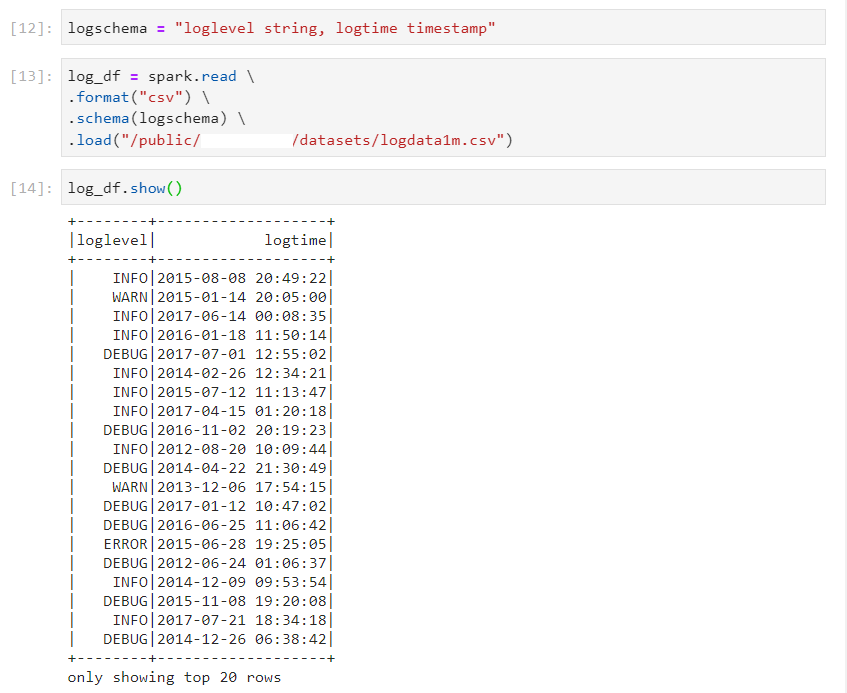
- Changing the datatypes of columns.

Creating a temp view table in order to operate on the data like a SQL table.
Also, if only the months need to be extracted, we perform the following query.
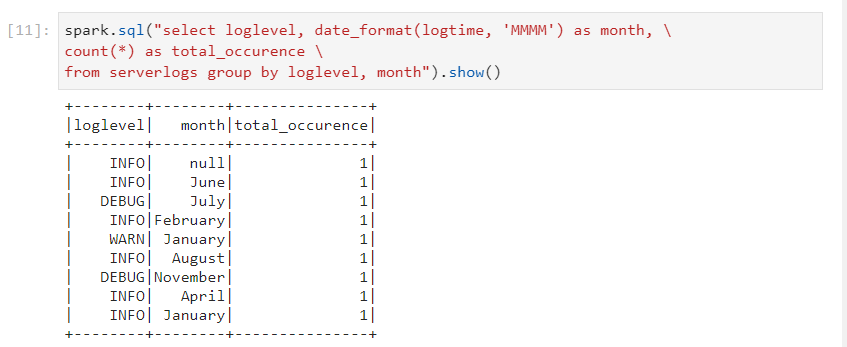
- Applying transformations and calculating the total occurrences of different log status.
- And now, we work on the original dataset after ensuring that the logic is functional without any errors.
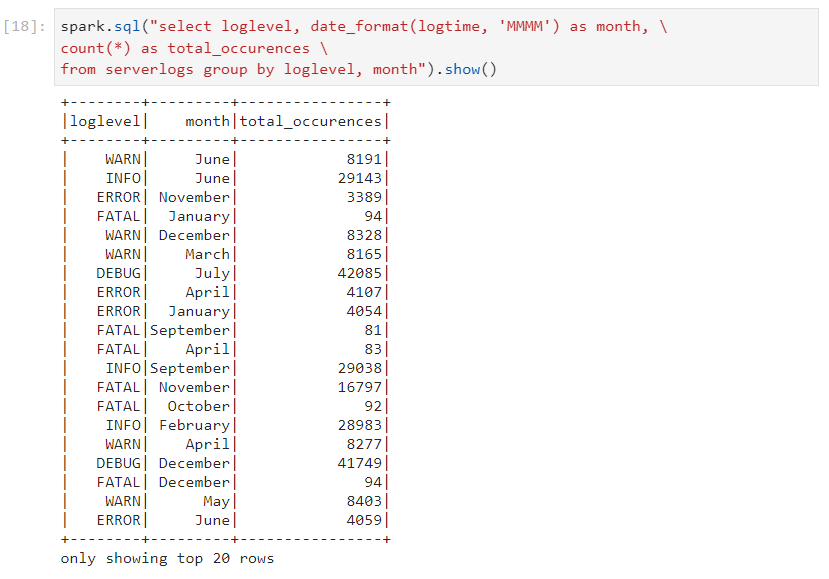
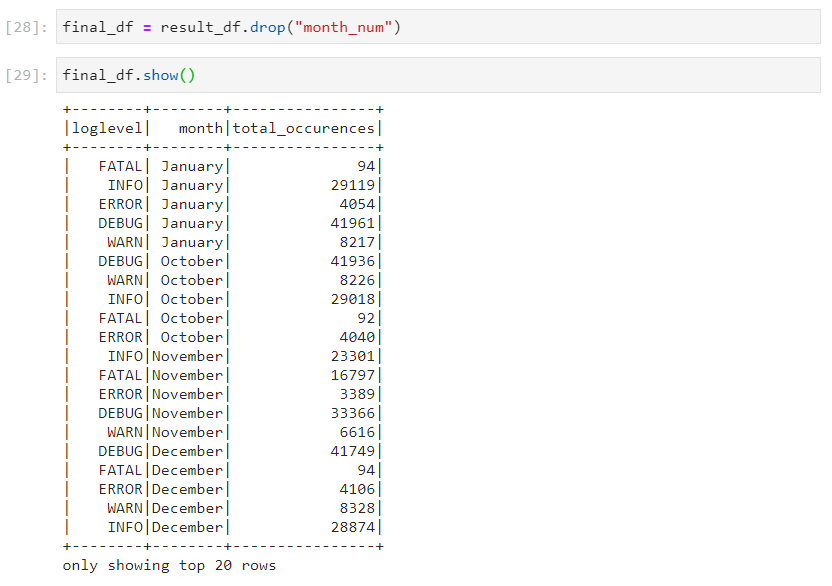
- Calculating the occurrences of log levels by month.
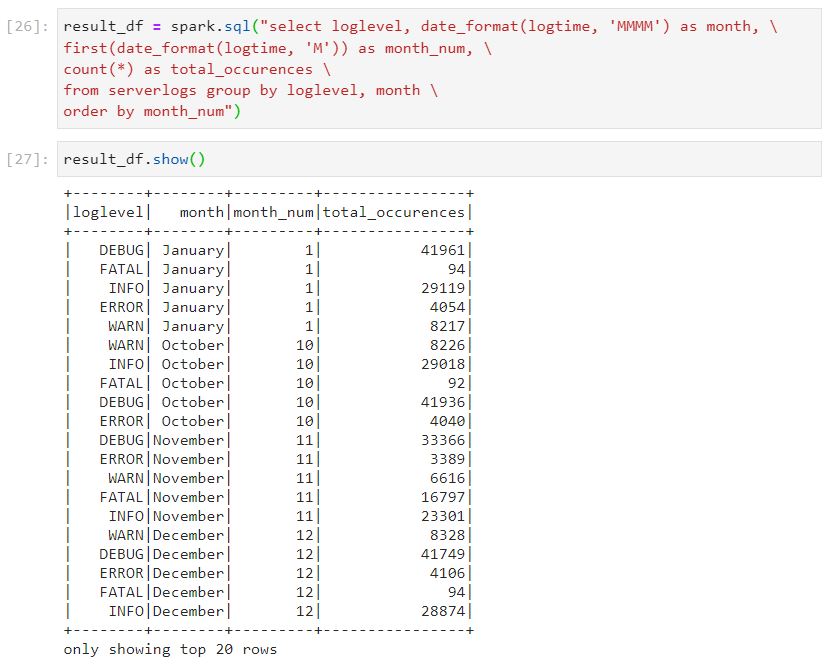
- We can have the month column in different formats as well.
- Finally, after it has served its purpose, month column can be dropped.
Pivot table
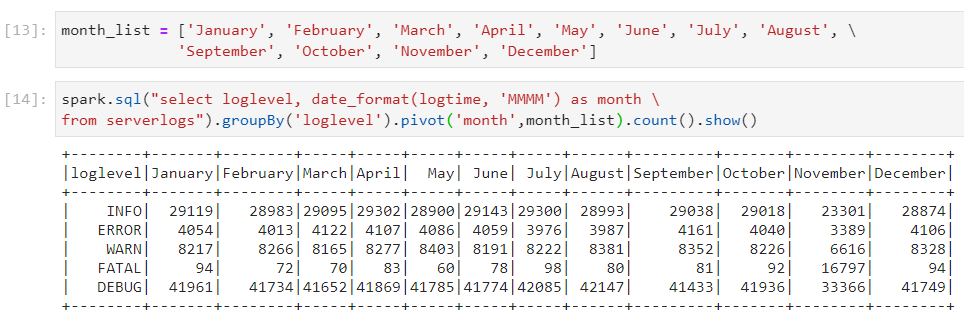
- Pivot tables provide a more intuitive view for analyzing the data, for gaining deeper insights.

- For sorting the months, we can use their 'MM' format.

- In order to save some processing time and improve query performance, we can explicitly provide the list of values on the pivot column.
Conclusion
PySpark's rich set of functionalities for performing simple aggregations, grouping data for insightful summaries or applying complex windowing operations for in-depth analysis, makes it an indispensable tool for big data analytics. By mastering these techniques, you can significantly enhance your data processing capabilities, leading to more insightful and actionable analytics.
Stay tuned for more such topics!
Subscribe to my newsletter
Read articles from Mehul Kansal directly inside your inbox. Subscribe to the newsletter, and don't miss out.
Written by
