Monitoring user interactions with DataDog RUM
 Namito Yokota
Objective
We recently implemented a data export feature that allows users to retrieve specific reports by selecting an option via radio buttons. To assess the feature's adoption and understand user preferences, we needed a way to track how often users initiate an export and which report types are being requested most frequently. After evaluating different solutions, we chose DataDog Real User Monitoring (RUM).
What is DataDog?
Datadog is an observability platform that supports every phase of software development on any stack. The platform consists of many products that help you build, test, monitor, debug, optimize, and secure your software. These products can be used individually or combined into a customized solution.
What is DataDog RUM?
DataDog Real User Monitoring (RUM) provides deep insight into your application’s frontend performance. Monitor real user data to optimize your web experience and provide exceptional user experiences. Correlate synthetic tests, backend metrics, traces, and logs in a single place to identify and troubleshoot performance issues across the stack.
With the Datadog RUM Browser SDK, you can also:
Monitor your application’s pageviews and performance to investigate performance issues.
Gain complete, end-to-end visibility into resources and requests (such as images, CSS files, JavaScript assets, and font files).
Automatically collect and monitor any interesting events with all relevant context, and manually collect errors that aren’t automatically tracked.
Track user interactions that were performed during a user journey so you can get insight into user behavior while meeting privacy requirements.
Surface user pain points with frustration signals.
Pinpoint the cause of an error down to the line of code to resolve it.
Cost
DataDog RUM pricing is based on session volume, meaning you pay for each user session that interacts with your application. A session typically starts when a user loads a page and ends after 15 minutes of inactivity. Basic RUM starts at $1.50 per 1,000 sessions. RUM with Session Replay starts at $1.80 per 1,000 sessions.
Alternative solution
If your company will not pay for DataDog RUM, Log Management (Log Collection) can serve as a viable alternative for tracking user interactions and frontend performance. While RUM is built for real user monitoring, logs can be structured to capture similar data points with added flexibility.
The main 3 difference from RUM and Log Management are:
Log Management does not monitor user interactions. It is a backend-driven logging system; therefore, requires an API request from the frontend.
Log Management requires more configurations as its intended use is wide and provides more control.
Log Management will likely be cheaper, although this varies on the number of logs compared to the number of sessions.
Implementation
All of the code snippets below use the Aurelia framework, so depending on a library/framework you’re using, the implementation can vary minorly.
1. Install the npm package
To use the DataDog Browser SDK, install the following npm package: npm i @datadog/browser-rum. At the time of this writing, the latest package version is 6.4.0 with a bundle size of 59.5 kB (gzip) .
2. Add a new application in the DataDog dashboard
In Datadog, navigate to the Digital Experience > Add an Application page and select the JavaScript (JS) application type.
3. Create a new service in the frontend
The readonly rumConfig object should be copied and pasted from the DataDog dashboard.
import { datadogRum } from '@datadog/browser-rum';
import appSettings from '../../config/appsettings.json';
import packageInfo from '../../package.json';

export class MonitoringService {
  /** Application configurations */
  readonly rumConfig = {
    applicationId: '{{APPLICATOIN_ID}}',
    clientToken: '{{CLIENT_TOKEN}}',
    site: 'datadoghq.com',
    service: '{{SERVICE}}',
    env: appSettings .environment,
    version: packageInfo.version,
    sessionSampleRate: 100,
    sessionReplaySampleRate: 20,
    defaultPrivacyLevel: 'mask-user-input',
  } as RumInitConfiguration;

  constructor() {}

  /**
   * Initializes RUM browser SDK
   */
  initialize(): void {
    datadogRum.init(this.rumConfig);
  }
}
It is valuable here that the environment and the version is dynamic. For our case, I retrieved the environment from client side app settings, and the versioning number from the package.json file.
4. Initialize DataDog RUM SDK on site load
Wherever the root page load logic lives, for us is in the activate method of app.ts , inject the newly created service, then call the initialize() method:
constructor(
  @inject(MonitoringService) private monitoringService: MonitoringService,
) {}

/**
 * Activate lifecycle hook
 */
async activate(): Promise<void> {
  this.monitoringService.initialize();
}
5. Add a method for logging a custom action
Now that we’ve initialized the RUM SDK, all of the built-in features can be viewed in the dashboard. To fulfill the requirement however, we can add a new method in the MonitoringService class:
/**
 * Logs a custom user interaction action
 * @param actionName Unique action name
 * @param additionalInfo Additional data to include in the metric
 */
logCustomMetric(actionName: ActionName, additionalInfo: object): void {
  datadogRum.addAction(actionName, {
    timestamp: new Date().toISOString(),
    ...additionalInfo,
  });
}
Using an enum for the metricName here is key in order to prevent duplicate names from being used.
/**
 * List of action names used for DataDog RUM's custom metrics
 */
export enum ActionName {
    DownloadAssessment = 'download_assessment',
}
6. Call method from the component file
Finally, we are complete with the service implementation. We are able to call the logCustomMetric() method from anywhere in the application to track any user interaction. Here is an example of a component TypeScript file, triggering a button press to download an assessment deliverable:
constructor(
  @inject(MonitoringService) private monitoringService: MonitoringService,
) {}

/**
 * Downloads PDF deliverable of the assessment
 */
downloadAssessment(): void {
  this.canDownloadAssessment = false;
  this.monitoringService.logCustomMetric(
    MetricName.DownloadAssessment,
    {
      pageName: 'PerformReview',
      fileType: 'PDF',
    },
  );

  this.pdfService
    .downloadPdf(this.assessmentId)
      .then((file) => {
        if (file) {
          this.fileService.downloadFile(file.fileDownloadName, file.contentType, file.fileContents);
        }
      })
      .finally(() => (this.canDownloadAssessment = true));
}
Result
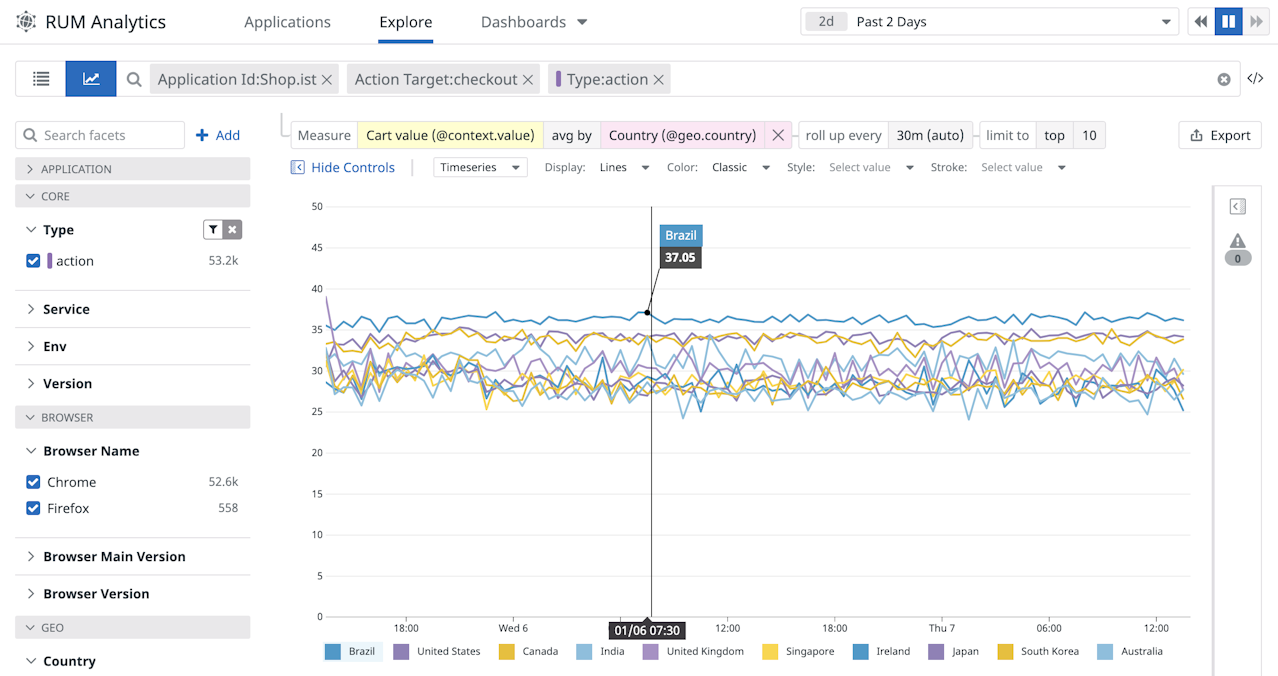
View the dashboard!

Security concerns
Storing applicationId and clientToken in JavaScript feels like a security vulnerability considering a user can easily retrieve it using Developer Tools. However, these values are intended to be stored in the browser’s JavaScript, similar to Google Analytics tool.
The following reasons are why it is safe to keep the strings in the client side:
The
applicationIdandclientTokenare used to identify which account or project the data belongs to, not to authenticate users or provide access to private systems.These tokens only allow data to be sent to the monitoring service. Even if someone extracts them from the browser, all they can do is send fake analytics data—they can’t steal or view any sensitive information from your system.
DataDog RUM has built-in protections against spam or misuse, such as:
Rate limiting (to prevent excessive requests).
Domain whitelisting (so data is only accepted from approved websites).
Filtering and validation (to detect and ignore invalid or manipulated data
Ad Blockers and VPNs
From my testing, using the uBlock Origin browser extension (with over 39 million users) led to a DataDog SDK initialization failure. Ad blockers and VPNs can interfere with RUM tracking by:
Blocking requests to DataDog’s RUM endpoints (e.g., datadoghq.com).
Preventing the RUM SDK from initializing in the browser.
Hiding or altering IP addresses, reducing geolocation accuracy.
The necessity for implementing a work around here is subjective. We need to know how important this monitoring tool is, how many users are affected, and how difficult it is to implement a work around. If desired however, a few potential solutions can be considered:
If the RUM SDK fails to initialize, use a custom logging solution as a backup. For example, an API request to log the error message from the server.
Implement a script to check if RUM has successfully initialized. If it fails, log the failure internally or notify users with a non-intrusive message suggesting they whitelist the site.
Additional readings
Many of the content in this writing is a direct quote or summaries from the following resources:
Subscribe to my newsletter
Read articles from Namito Yokota directly inside your inbox. Subscribe to the newsletter, and don't miss out.
Written by
